
UCR April 2015-June 2015 (FY 2015, Q3)
PDF Version 404KB
PDF files can be viewed with the Acrobat® Reader®
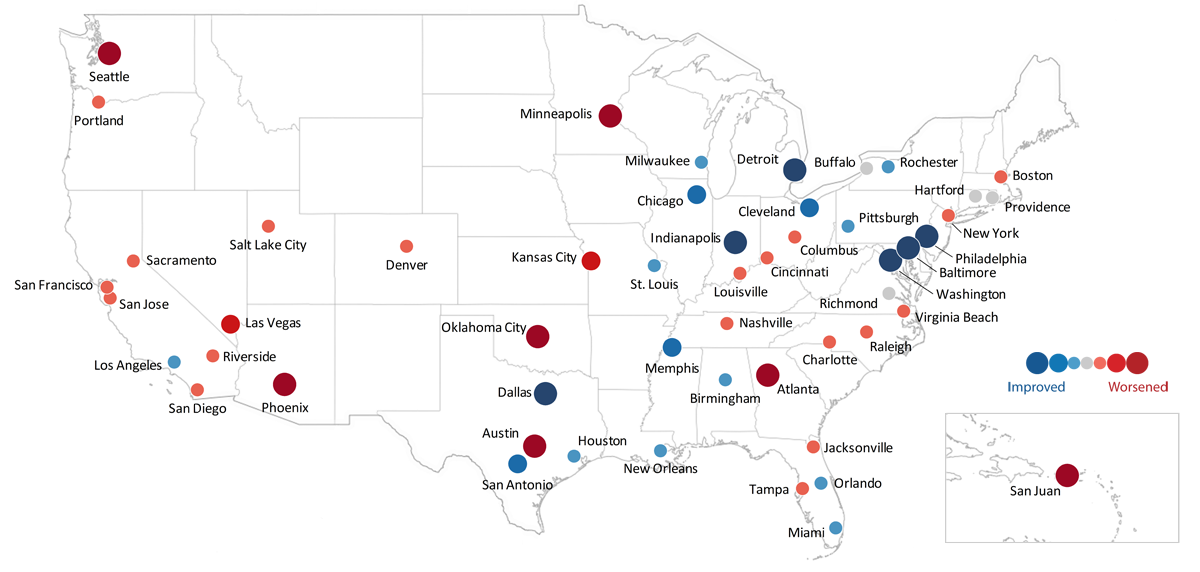
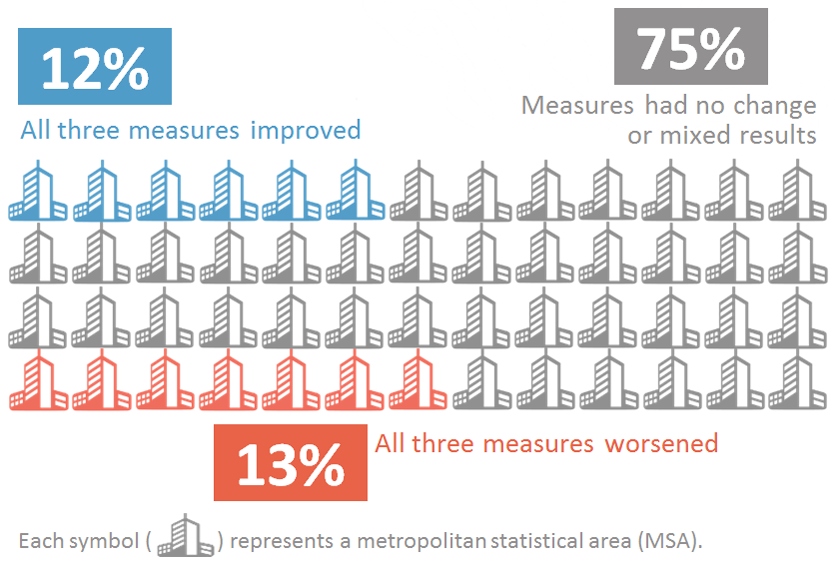
A Snapshot of Year-to-Year Congestion Trends in the U.S. for April 2015 through June 2015.
Congested Hours

-21 minutes
Average duration of daily congestion
Travel Time Index
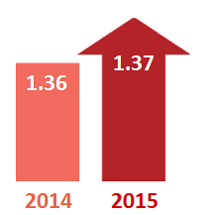
+1 points
Peak period vs. off-peak travel times
Planning Time Index
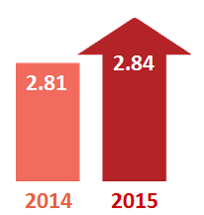
+3 points
Unreliability (variability) of travel
| City (MSA) | Congested Hours | Travel Time Index | Planning Time Index | % Complete Data | |||
|---|---|---|---|---|---|---|---|
| 2015 | Change from 2014 | 2015 | Change from 2014 | 2015 | Change from 2014 | ||
| Atlanta, GA | 4:21 | +0:10 | 1.34 | +1 | 2.52 | +16 | 99% |
| Austin, TX | 4:07 | +0:02 | 1.37 | +2 | 2.75 | +13 | 93% |
| Baltimore, MD | 6:54 | -0:39 | 1.35 | -2 | 2.83 | -9 | 96% |
| Birmingham, AL | 0:46 | -0:12 | 1.04 | -1 | 1.39 | +3 | 100% |
| Boston, MA | 5:34 | -0:09 | 1.47 | +1 | 3.03 | +6 | 97% |
| Buffalo, NY | 5:22 | -0:19 | 1.17 | 0 | 2.05 | +5 | 89% |
| Charlotte, NC | 3:00 | -0:52 | 1.24 | +2 | 2.25 | +12 | 98% |
| Chicago, IL | 6:30 | -0:34 | 1.50 | 0 | 3.03 | -1 | 98% |
| Cincinnati, OH | 3:54 | -0:10 | 1.24 | +2 | 2.23 | +8 | 98% |
| Cleveland, OH | 3:25 | -0:34 | 1.20 | -1 | 2.38 | 0 | 97% |
| Columbus, OH | 2:52 | -0:33 | 1.17 | +1 | 2.06 | +6 | 99% |
| Dallas-Fort Worth, TX | 4:52 | -0:25 | 1.32 | -1 | 2.67 | -12 | 98% |
| Denver, CO | 6:55 | -0:02 | 1.41 | +1 | 3.11 | +6 | 93% |
| Detroit, MI | 3:40 | -1:12 | 1.22 | -28 | 2.69 | -68 | 97% |
| Hartford, CT | 3:01 | -0:29 | 1.18 | 0 | 2.17 | +5 | 94% |
| Houston, TX | 5:10 | -0:04 | 1.34 | -1 | 2.78 | +2 | 97% |
| Indianapolis, IN | 2:21 | -0:34 | 1.13 | -1 | 1.66 | -8 | 99% |
| Jacksonville, FL | 3:07 | -0:10 | 1.17 | +3 | 2.24 | +15 | 95% |
| Kansas City, MO | 3:39 | +0:05 | 1.16 | 0 | 2.05 | +3 | 95% |
| Las Vegas, NV | 3:46 | 0:00 | 1.20 | +5 | 2.07 | +6 | 93% |
| Los Angeles, CA | 8:27 | -0:31 | 1.65 | +3 | 3.74 | -3 | 96% |
| Louisville, KY | 3:31 | -0:26 | 1.19 | +2 | 2.33 | +42 | 99% |
| Memphis, TN | 3:34 | -1:32 | 1.17 | 0 | 1.94 | -7 | 97% |
| Miami, FL | 5:52 | -0:03 | 1.35 | +4 | 2.87 | -2 | 97% |
| Milwaukee, WI | 3:32 | -0:32 | 1.25 | -3 | 2.34 | +2 | 95% |
| Minn.-St. Paul, MN | 5:41 | +0:08 | 1.39 | +5 | 3.11 | +34 | 84% |
| Nashville, TN | 3:40 | -0:16 | 1.28 | +3 | 2.51 | +7 | 98% |
| New Orleans, LA | 5:37 | -0:13 | 1.22 | -4 | 3.27 | +27 | 97% |
| New York, NY | 7:54 | -0:30 | 1.50 | +3 | 3.46 | +12 | 94% |
| Oklahoma City, OK | 3:27 | +0:06 | 1.17 | +2 | 2.05 | +16 | 97% |
| Orlando, FL | 3:46 | -0:03 | 1.20 | +3 | 2.19 | -1 | 98% |
| Philadelphia, PA | 6:19 | -0:52 | 1.36 | -1 | 2.95 | -14 | 97% |
| Phoenix, AZ | 2:44 | +0:07 | 1.21 | +3 | 2.15 | +10 | 96% |
| Pittsburgh, PA | 6:22 | +0:09 | 1.30 | -4 | 3.09 | -6 | 95% |
| Portland, OR | 6:30 | -0:19 | 1.49 | +7 | 3.41 | +17 | 96% |
| Providence, RI | 5:34 | -0:09 | 1.23 | 0 | 2.53 | +12 | 93% |
| Raleigh, NC | 2:05 | -0:02 | 1.15 | +1 | 2.02 | +5 | 97% |
| Richmond, VA | 2:49 | -0:36 | 1.09 | 0 | 1.75 | +4 | 97% |
| Riverside-San Bern., CA | 6:09 | -1:16 | 1.30 | +2 | 2.24 | +6 | 98% |
| Rochester, NY | 3:22 | -0:58 | 1.11 | -1 | 2.06 | +15 | 84% |
| Sacramento, CA | 4:17 | -0:11 | 1.28 | +9 | 2.45 | +15 | 96% |
| Salt Lake City, UT | 3:02 | -0:09 | 1.16 | +2 | 2.01 | +5 | 97% |
| San Antonio, TX | 2:53 | -0:39 | 1.23 | -1 | 2.38 | 0 | 98% |
| San Diego, CA | 4:13 | -0:24 | 1.30 | +2 | 2.76 | +14 | 94% |
| San Francisco, CA | 6:59 | -0:28 | 1.50 | +3 | 3.44 | +4 | 94% |
| San Jose, CA | 5:58 | -0:06 | 1.50 | +3 | 3.70 | +17 | 94% |
| San Juan, PR | 3:50 | +0:22 | 1.49 | +4 | 2.75 | +9 | 44% |
| Seattle, WA | 6:38 | +0:03 | 1.46 | +3 | 3.19 | +3 | 95% |
| St. Louis, MO | 2:56 | -0:41 | 1.15 | -1 | 2.10 | +7 | 98% |
| Tampa, FL | 3:50 | -0:27 | 1.26 | +4 | 2.60 | +2 | 95% |
| Virginia Beach, VA | 4:50 | -0:12 | 1.25 | +2 | 2.76 | +15 | 95% |
| Washington, DC | 7:15 | -0:37 | 1.59 | -1 | 3.53 | -17 | 96% |
Notes:
Blue bolded values (with – sign) indicate improving conditions; red italics (with + sign) indicate worsening conditions.
Comparison of 2015 to 2014 is for the same three-month period (April - June).
% Complete Data compares the reported congestion data for that MSA to what should have been available for the designated roads and time periods.
For More Information
Please contact Rich Taylor at rich.taylor@dot.gov.