Comprehensive Truck Size and Weight Limits Study - Modal Shift Comparative Analysis Technical Report
Chapter 4: Scenario Impacts on Transportation and Logistics Costs and Rail Contribution
A principal reason for considering changes in truck size and weight limits is to reduce total logistics costs associated with the movement of freight. Total logistics costs include not only the cost to transport goods from origin to destination, but also non-transport logistics costs such as inventory carrying costs, storage, loss, and damage. As discussed in the previous chapter, the comparison of these total logistics costs for individual shipments by base case and scenario modes and vehicles is the basis for estimating the potential traffic shifts associated with changes in truck size and weight limits.
This chapter summarizes estimates of overall changes in transportation and non-transportation logistics costs for the six truck size and weight scenarios analyzed in this 2014 CTSW Study. The effect of both truck-to-truck and rail-to-truck shifts on transportation and logistics costs is shown in Table 20.
Scenarios 1, 2, and 3 result in greater total cost savings, primarily because they affect a larger share of the overall freight transportation market. Savings resulting from shifts of base case truck traffic to the Scenario 1 and Scenario 2 vehicles would each result in savings of over $5.5 billion. Savings are slightly greater under Scenario 1 than Scenario 2 even though traffic shifts are slightly greater under Scenario 2. The main reason for the greater cost savings under Scenario 1 is the lower vehicle operating cost for the 5-axle tractor-semitrailers compared to the 6-axle vehicles analyzed in Scenario 2.
Savings from shifts of rail traffic to scenario vehicles would total $15 million for both Scenario 1 and 2. These cost savings were the result of the diversion of 2.3 million tons of freight traffic under each of Scenarios 1 and 2. Even greater cost savings were estimated to come from reductions in rail rates to keep traffic from diverting to the more productive trucks.
Scenario 3 resulted in the greatest cost reduction of all the scenarios – over $13 billion annually. The majority of this reduction came from truck-to-truck shifts as truck traffic captured the benefit of the higher weight allowed under this scenario. A total of 4.9 million tons of rail freight is estimated to divert to trucks under Scenario 3 size and weight limits. Commodities most impacted in each of Scenario 1, 2, and 3 are low value commodities where transportation costs are high relative to the value of the commodity and bulk, feedstock commodities. Commodities shipped in bulk equipment types, dump body, grain, tank, etc., have limited back haul opportunities and rates often must cover the cost of an empty return. At the other end of the spectrum, high value commodities were tested and often found to have lower total logistics cost at payloads below the study base case payload. In many of these cases, non-transport logistics costs that were twice as high as transportation costs were not uncommon. High value commodities generally did not benefit from the increased payload.
Savings from rail traffic were estimated to total $380 million, most of which was from rate reductions to retain traffic on the railroad. The alternative vehicles in Scenarios 1, 2, and 3 provide no productivity gain over intermodal units being hauled by rail for most rail intermodal moves. The typical intermodal payload is below 40,000 pounds and does not approach the current federal 80,000 pound weight limit. The competition from heavier truck weights affected rail rates to a much greater degree than it did diversion of rail shipments to truck. Rate reductions account for close to 90 percent of the revenue losses to the rail industry. The majority of the rail traffic impacted by the increased weight scenarios was carload traffic. The rail intermodal traffic base was generally less than 40,000 pound payloads, which when run in highway combinations is below the current weight federal limit. Rail rates are generally half truck rates, even when drays at both ends are included. What diversion was experienced was in relativity short hauls where rail rates are high relative to long haul intermodal markets and the dray is spread over fewer miles. The percentage change in total logistics costs (transportation and non-transport logistics costs) for Scenarios 1-3 reflects a comparison of total logistics costs to move all traffic in the configurations affected by each scenario in the base case to total logistics costs to haul the same traffic at the size and weight limits for each scenario.
Savings from Scenarios 4, 5, and 6 were not as great—between $1.9 and $2.3 billion per year. For these LTL freight scenarios, the non-transport portion of total logistics cost were not analyzed. Non-transport logistics costs are an important consideration when shipment size changes. In the LTL scenarios, individual shipment sizes are not changed, the number of shipments that can be consolidated into a load changes. This analysis considers only the change in line-haul transportation cost per unit of freight. Very little savings was attributable to traffic currently on the railroads. The rail intermodal LTL analysis included STCCs 46 and 47, Miscellaneous Mixed Shipments and Small Packaged Freight Shipments respectively, as a proxy for LTL shipments. The ability of the scenario vehicles to divert this intermodal freight is limited. Changes in total logistics costs for Scenarios 4-6 are calculated somewhat differently than for Scenarios 1-3 because those scenarios are assumed to apply only to LTL traffic. Total transportation costs associated with moving all non-local LTL traffic both by truck and by rail in the base case are compared with total transportation costs associated with moving the same traffic under the size and weight limits assumed for Scenarios 4-6. Non-transport logistics costs are assumed to remain the same since they primarily reflect impacts of individual shipment sizes that are assumed to be unaffected by the scenario size and weight limits. A total of 1.4 million tons of rail freight was estimated to divert to trucks under Scenario 4 and 2.4 million tons was estimated to divert to trucks under both Scenarios 5 and 6.
4.1 Rail Contribution and Revenue
An important indicator of the impact of lost traffic and rate reductions required to keep traffic on the railroad is rail contribution – the difference between revenues and costs that railroads can contribute toward meeting their fixed costs. The changes in truck size and weight limits included in Scenarios 1-6 would affect both rail revenues and rail expenses. Revenues would be lost both from traffic that diverts to the scenario vehicles and from rate reductions needed to keep traffic on the railroad. Expenses associated with hauling freight that diverts to truck would be avoided, however. For all scenarios these changes are relatively small.
Table 21 summarizes changes in revenues and expenses for each scenario. Numbers in parentheses represent the percentage change in rail revenues, expenses, and contribution. With the exception of Scenario 3, losses in revenues accounted for 0.5 percent or less of total rail revenues. Scenario 3 revenue losses are estimated to be about 1 percent of rail revenues. In all scenarios expenses foregone as the result of lost traffic are less than or equal to 0.25 percent. In dollar terms, the net loss of contribution toward railroad fixed costs is highest for Scenario 3 – over one-half billion dollars. Lost contribution for Scenarios 1 and 2 were both about $200 million. Lost contribution for Scenarios 4-6 ranged from $22 million to $15 million.
4.2 The Effect on Short Line Railroads
This section summarizes results of an analysis concerning the effects on short line railroads brought about by changes in truck sizes and weights. Short line railroads are Class II and Class III railroads as defined by the Surface Transportation Board STB).[5] Input from the short line railroad industry indicates that approximately 90 percent of their traffic interlines with Class I railroads and thus is reflected in the STB Carload Waybill Sample. While flow data on these classes of carriers is not as robust as that for the Class I railroads, the data available and results from the analysis are instructive.
There are around 560 short line railroads operating in the U.S. Of these, 10 are Class II’s with the remaining Class III’s. Together these railroads originate or terminate about 18 percent of Class I carload freight or around 6.5 million carloads, annually and generate around $4 billion in revenues. While commodity makeup on these carriers is diverse, they principally serve rural communities and provide these areas the rail link to the Class I railroad network. Short line railroads provide two primary high level services: 1) extension of Class I railroads with the interlining and 2) regional/intrastate rail service.
Previous truck size and weight studies undertaken by the U.S. Department of Transportation (USDOT) did not consider the effects on short line railroads separately from the Class I railroads. In part, this was due to data limitations and concerns over interpreting the results. But with each subsequent study, the USDOT has attempted to expand the analysis, to the extent possible, to encompass all of the effects that truck size and weight changes place on the transportation system.
Similar to the Class I railroad analysis, the short line analysis examined the impacts of two distinct results; rate reductions or discounting on the part of the railroad to hold onto traffic and diversions from rail to truck when the carrier has to give up the traffic because it will not move the goods if revenues are below its variable cost. Here the short line analysis builds on the results from the ITIC model and the STB Carload Waybill Sample that were undertaken for the Class I railroads. The short line analysis is a subset of the overall analysis above.
To expand the above analysis to consider the effects on short line railroads, those records on the waybill sample were identified, where a short line railroad was an originating, intermediate, or terminating carrier. This is the “documented” set of short line moves. Industry experience tells us that sometimes short line railroads are not included on the waybill sample because the Class I handles the billing for these carriers. Overall, the waybill sample includes around 140 railroads, far short of the number of railroads operating in any year. To handle the unreported short line railroads, an additional dataset was developed that identified waybill records where the origin or destination was on a Class I railroad and there was access to a short line railroad within a reasonable range of their origin or destination. This dataset was referred to as the “potential” short line waybills. This data set identified any waybill record that could potentially use a short line railroad but did not include that short line on the waybill. (Only a portion of the waybill records were identified as using a short line railroad.) In summary, the documented data set included all the short line trips that could be identified in the waybill sample while the potential data set included any possible undocumented short line trip based on a short lines in close proximity to a Class I origin or destination.
These two data sets provide the basis for the revenue estimates. However, data limitations do not allow a rail contribution analysis for the short line business. Likewise, data limitations precluded estimates of revenue impacts on short line railroads associated with Scenarios 4, 5, and 6. Below are the assumptions made in conducting the revenue analysis of the short line railroads:
- No changes from the main analysis were made to the assumptions on the frequency of diversions or the frequency of rate reductions on railroads, this analysis only identified those instances that included or potentially included a short line railroad.
- Revenue estimates for the documented data set only include the revenue attributed to that segment of the trip on the short line railroad.
- Revenue estimates on the potential short line data set are assumed to be 21 percent of the entire revenue on that waybill record. This estimate was derived using the average revenue of documented short line railroads where the origin or the termination was a short line directly connecting to a Class I railroad.
- Short line revenue losses from rate discounting are estimated by applying the proportion of revenue received by the short line to the overall revenue lost from discounting.[6]
See Appendix F and Appendix H for a detailed discussion on the methodology, data sets, models and assumptions.
Even with this more inclusive approach, comparisons across these two data sets proved difficult. The lower bound of impacts is based on estimated impacts of truck size and weight limit changes on documented short line rail moves. Additional potential revenue impacts are estimated for moves that could have involved a short line railroad based on the proximity of the short line to shipment origins or destinations. Combining these two estimates produces the worst case scenario of total revenue losses.
4.3 Results
For the known short line waybills, rate reduction occurred on 16 two-digit Standard Transportation Commodity Codes (STCC) for Scenarios 1 through 3. Of these 16 commodity groups, the most impacted in terms of lost revenue included Pulp, Paper, or Allied Products; Chemicals or Allied Products; and Clay, Concrete, Glass or Stone Products, respectively.
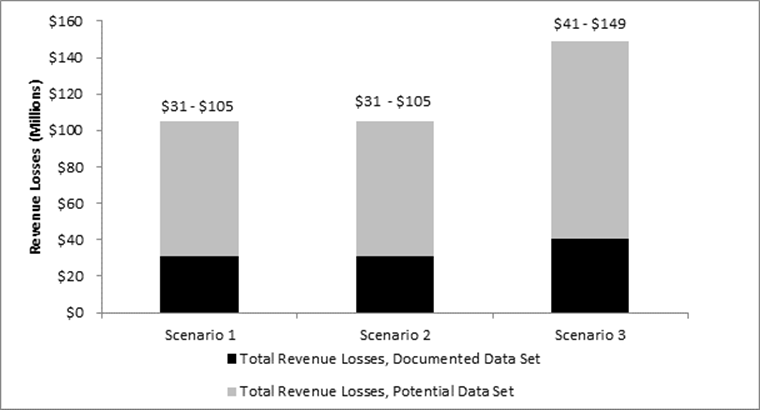
Table 22 shows the revenue losses for the documented and potential data sets while Figure 15 shows the range of estimated losses from the combined data set.
Figure 15: Range of Estimated Losses in Short Line Revenues Associated With Truck Size and Weight Scenarios 1-3 Short Line Combined Data Set
[5] See Federal Register, Volume 79, No. 111, June 10, 2014, p. 33257. The Surface Transportation Board defines class of railroad based on revenue thresholds adjusted for inflation. For 2013, the most recent available, Class I carriers had revenues of $467.0 million or more. Class II carriers have revenues ranging from $37.4 million to under $467.0 million. Class III carriers have revenues under $37.4 million. All switching and terminal carriers regardless of revenues are Class III carriers. (See 49 CFR 1201.1-1). Return to Footnote 5.
[6] For the potential data set, this will always be 21 percent. Return to Footnote 6.