Comprehensive Truck Size and Weight Limits Study - Highway Safety and Truck Crash Comparative Analysis Technical Report
Chapter 2: Crash Analysis
2.1 Overview
Based on information found through a search of existing literature (i.e., desk scan), conducting crash-based analyses of truck safety, particularly for specific alternative truck configurations like those defined in the scenarios for this project, is difficult. The first column of Table 3 shows what might be considered preferred criteria for a crash analysis of the alternative configurations of interest. The second column indicates the current real-world situation. This table concisely describes the challenges faced in attempting to use crash data that reflects actual highway operations within the safety study.
The safety assessment completed for this Study was designed to incorporate as many of these criteria as possible while recognizing that not all could be met. To conduct the best possible study, three different methodologies were attempted –
- A crash-rate comparison study based on State crash data and exposure data from both the State and from supplemental WIM-based exposure data;
- A route-based method which compares the total crash rate of a specific route where a specific alternative truck configuration is operated (e.g., triple-trailer configurations on certain Interstate routes) to a similar route in the same State that does not allow the configuration to operate; and
- A fleet-based method where a specific alternative truck configuration and its control truck both operate on the same roadways using data from participating carriers.
The actual implementation of these methods, with practical constraints, is described in detail in the following narrative.
2.2 Preparation and Review of Draft Safety Analysis Plan
Based on the desk scan and the project requirements, the USDOT study team developed an approach to framing a draft safety analysis plan that introduces these three methods. A thread running through the literature was the difficulty expected in conducting such crash analyses. Of all the studies reviewed, four stand out as perhaps the most important:
- A TRB study of the Turner Proposal (TRB, 1990b)
- A TRB review of Truck Size and Weight Limits (TRB, 2002);
- The U.S. Department of Transportation (USDOT) Comprehensive Truck Size and Weight Study 2000 (2000 CTSW Study) (FHWA, 2000a); and
- The Western Uniformity Scenario (USDOT, 2004).
It is notable that while all four cited safety as one of the primary concerns in studies of truck size and weight, and while all reviewed past crash-based safety studies, only one actually conducted a crash-based study. Three of the four cited or used computer simulation of truck performance characteristics as the principle safety analysis technique.
The team's review of the literature also indicated that while there have been a large number of research studies related to truck size and weight, much of the past research compared tractor-semitrailer configurations to twin-trailer configurations. Many of the studies also involved analyses of only fatal crashes. In contrast, the current study examines specific alternative truck configurations within the larger single- and double-trailer configuration classes and estimates total truck crashes rather than fatal crashes.
The difficulty in studying actual truck weight in crash-based analyses was noted in a TRB study (TRB, 2002), which indicated that the safety implications of GVW had been studied in one prior research effort (Campbell, et al., 1988). The TRB report went on to cite the difficulties in drawing sound conclusions from the data available in that study. While the current study also does not analyze individual truck GVWs due to the lack of such data on State crash forms, the choice of States used in this study was based on the maximum GVW limit allowed in a given State for both the specific alternative truck and control truck configurations.
The desk scan findings emphasized the importance of controlling roadway type or class in the analyses (e.g., Interstate vs. non-Interstate roads). As noted by Campbell, et al. (1988), different truck configurations have different patterns of travel across road types, making simple comparisons of crash rates across multiple road types misleading. In this current study, the comparisons were restricted to crashes within two road classifications – urban and rural Interstates. As noted in Table 3, most WIM stations are located on Interstate System segments. Developing non-Interstate System NHS roadway exposure data was limited by this factor.
A consistent theme in past research on size and weight issues has been the limitations of crash and exposure data. Most crash data systems are inadequate in terms of allowing precise identification of longer or heavier trucks. No State crash data system includes the operating weight of trucks at the time of the crash. Most do not include lengths of either individual units or combination lengths, and very few include axle counts. Exposure data are equally problematic. The only truck-configuration exposure data collected by State departments of transportation (DOT) is vehicle classification data based on FHWA’s 13-level classification system. This system provides categories defined by axles and number of trailers, but includes twin-trailer configuration in up to three classes and consolidates triple-trailer configurations and all other LCVs into one class. For that reason, this current study used WIM data in the development of exposure for specific alternative and control truck configurations, as suggested by various authors (Campbell, Blower et al. 1996; Abdel-Rahim, Berrio-Gonzales et al. 2006b; Montufar, Regehr et al. 2007; Regehr, Montufar et al. 2009).
Finally, there is evidence from Canada and other nations that long combination vehicles (LCVs) in general may experience very low crash rates if stringent restrictions are placed on drivers, routes, bad-weather operation, truck configuration equipment (e.g., dollies), truck components (e.g., brakes) and other safety-related factors (Woodrooffe, Anderson et al. 2004). This current study is being conducted without such stringent restrictions and is based on actual data from the States.
A significant part of the study project plan examined the choice of State databases and potential fleet databases that might be used in the effort. To gather additional commentary, the plan was presented at two public outreach sessions. Responses to comments received at these sessions resulted in modifications to the plan.
The effect of heavier and longer vehicle configurations on roadside hardware and barriers was also investigated in the study. Currently there is no testing protocol in place that supports evaluating the performance of roadside safety appurtenances when trucks weighing more than 80,000 pounds crash into them. The study team identified the steps needed to establish such a crash-test protocol and the cost of developing the framework for such evaluations, which are addressed later in this Report.
The challenge of distinguishing between legal or illegal overloading was considered early on in the process. The information included on the crash data records does not indicate whether the truck involved was operating at a legal weight, above the legal weight but with a legally issued State over-weight permit, or above the legal weight operating without a permit (violators). As a result, the type of analysis initially considered, while desirable, was found not to be feasible.
2.3 State Data Crash Analyses
The goal of the State crash analysis is to assess crashes per mile of truck travel for trucks operating at or below current Federal limits as compared with crashes among those vehicles operating above existing Federal limits in six alternative truck configuration scenarios. The basic method involved the following activities:
- Identify the States where each truck configuration of interest to the study (i.e., trucks operating at and below Federal limits and each of the six alternative configurations) has accumulated adequate annual VMT for a sufficient number of years to accumulate a reasonable sample size of crashes (i.e., determine which alternative truck configurations have accumulated significant exposure in which States).
- Identify the subset of these States in which a) each alternative configuration and the control configurations can be identified through the use of variables in the existing crash data, and b) the allowable GVW limits for the alternative and control configurations (e.g., the maximum allowable GVW for a triple-trailer configuration) match those in Table 2 above.
- Obtain total AADT and other inventory variables for each route section to be studied.
- Obtain WIM data for the routes to be studied and combine it with the AADT data to develop VMT estimates for each alternative and control configuration on each route section.
- Estimate rates and safety performance functions to compare the safety of baseline trucks and alternative trucks.
Choice of State Data Bases
A critical component of this method was the choice of States to be used in analyzing each of the alternative vehicles. Since the State-choice decisions are based on different data inputs for analyzing Scenario 2 and 3, and Scenarios 5 and 6, the following section provides details for each.
Analysis of Single Semitrailer Configurations
This analysis involves comparing the crash experience for Scenarios 2 and 3. The alternative truck configurations both have three axles on the tractor, three on the trailer, and a GVW limit of either 91,000 lbs. or 97,000 lbs. The control vehicle is the standard tractor/semitrailer combination with the three axles on the tractor, two on the trailer, and an 80,000 lb. GVW limit. All three vehicles have a 53 ft. semitrailer. (Note that 53-ft. trailers now operate in all States, so that criteria will be met regardless of the States chosen.) Paralleling the analysis of triple-trailer configurations, the primary criteria for including a State in the analysis are:
- An 80,000 lb. GVW limit for the control vehicle.
- Either a 91,000 lb. or 97,000 lb. GVW limit for the alternative truck configurations. (Note again that because there is no weight data on crash forms, this decision had to be based on the GVW limit for the roads in the State being investigated.)
- Adequate VMT for both the alternative truck configuration semitrailers and the control vehicle. (Note that there will be adequate VMT for the control vehicle in all States.)
- The alternative truck configuration semitrailers can be distinguished from the control vehicle in the crash data using number of trailers and number of total axles. Note that the assumption here is that a six-axle semitrailer combination can be considered a 3-S3 configuration. Only States where the six-axle configuration can be identified and where the GVW limit is higher than 80,000 lb. were considered for this analysis.
The inputs to the decision concerning which States would be used in this analysis were from the following sources:
- A table of “Grandfathered Weights Allowed by States.” The information are based on 23 CFR Part 658 Appendix C.
- A table of “State Weight Exemptions (As of March 2008).” The data are based on U.S. Code Title 23 Section 127.
- GVW limits for alternative truck configurations included in a table of “CTSW Heavy Trucks (grandfathered over 80,000 lb.) allowed on Interstate System.” This table includes States recommended by FHWA personnel and the Commercial Vehicle Safety Alliance (CVSA) for the Volume II: Compliance Comparative Analysis. It was updated a number of times during the study period, with the last update being in April, 2014.
- VMT data from 2008 for each of the 25 vehicle configurations within the 14 functional classes within each State. The classes of interest in this analysis are the six-axle alternative truck configurations in Scenarios 2 and 3 and the five-axle control single configuration.
- Presence of “number of trailers” and “number of total axles” variables on State crash report forms. This information was compiled through searches for crash report forms from publicly available sources available on the Internet.
The USDOT study team extracted data for an initial group of 13 States allowing use of alternative truck configurations. The team looked for the presence and level of VMT on Interstate highways for the alternative truck configurations in the 2008 data. The team also looked for the presence of the needed trailer-count and axle-count crash form variables and the stated GVW limits for both the Scenario 2 and 3 configurations and the control single truck. Note that the final input – the GVW limits – changed as the study progressed based on more detailed data obtained in the Volume II: Compliance Comparative Analysis area of the 2014 CTSW Study for each of the candidate States.
While none of the States allowing the alternative truck configurations fit all of the desired criteria, three States provided data that appeared to be sufficient: Idaho, Michigan, and Washington.
- Idaho – The 2008 VMT data showed mid-level VMT for the alternative truck configurations when compared to the VMT for the alternative truck configurations in other potential States. Axle-count data are present on the crash report form for 2010 and earlier, allowing the separation of the six-axle alternative configuration from the five-axle control configuration. The maximum GVW for the six-axle alternative configuration is 105,500 lbs. rather than the 97,000-lb. target for Scenario 3, and the max GVW for the five-axle control vehicle is the 80,000-lb. target.
- Michigan – The 2008 VMT data showed mid-level VMT for the alternative truck configurations when compared to the VMT for the alternative truck configurations in other potential States. Axle-count data are present on the crash report form for 2008 – 2012, allowing the separation of the six-axle alternative configuration from the five-axle control configuration. The maximum GVW for the six-axle alternative configuration is 105,500 lbs. rather than the 97,000-lb. target for Scenario 3, and the maximum GVW for the five-axle control vehicle is 86,000 lbs. rather than the 80,000-lb. target. However, it was determined that these limits were close enough to provide meaningful data, particularly given the limited number of potential analysis States.
- Washington – The 2008 VMT data showed an adequate level of VMT for both six-axle and seven-axle semi-trailer combinations when compared to other potential States. Axle count data are present on the State crash report form for 2008-2012, allowing the separation of the six-axle alternative configuration from the five-axle control configuration. Information collected for the Volume II: Compliance Comparative Analysis from WSDOT staff indicated that the maximum GVW for the six-axle configuration would be approximately 92,000 lbs., very close to the 91,000-lb. target for Scenario 2. The maximum GVW limit for the five-axle control semitrailer is 80,000-lb., the target value.
Analysis of Double and Triple-trailer Configurations
The inputs to the decision concerning which States were to be used to compare the control double twin to the Scenario 5 and 6 triple configurations were from the following sources:
- List of States allowing travel by triple-trailer configurations. The table entitled “Tractor-trailer-trailer Combinations in Operation” under “ISTEA Freeze” was based on data extracted from the Title 23 Code of Federal Regulations, Part 658, Appendix C. For each of the 17 States allowing triple-trailer configurations, the table provided information on “Allowable Length - Cargo Carrying Units (feet)” and “Gross Vehicle Weight Limit (pounds).”
- GVW limits for triple-trailer configurations included in a table of “CTSW Heavy Trucks (grandfathered over 80,000 pounds) allowed on Interstate System.” This table was developed by the team working on the Volume II: Compliance Comparative Analysis and includes States recommended by FHWA personnel and the Commercial Vehicle Safety Alliance (CVSA) for the compliance study. It was updated a number of times during the study period, the last update being on January 21, 2014.
- VMT data from 2008 for each of the 25 vehicle configurations within 14 functional classes for each State. These data were developed by the study team working on the Volume II: Modal Shift Comparative Analysis effort.
- Presence of “number of trailers” and “number of total axles” variables on State crash report forms. This information was compiled by the safety team through searches for crash report forms from internet sources.
An initial group of 17 States allowing use of triple-trailer configurations was extracted from these data sources and analyzed in the original study plan. Since a sufficient sample size for the VMT of triple-trailer configurations was critical to this analysis, the 2008 VMT data were searched to identify triple-trailer configurations States with VMT for either or both seven-axle triple and triples with eight or more axles. The triple-trailer configuration VMT levels for each State were then categorized as very low, low, medium, or high by functional class was produced to conduct an analysis on NHS roadways. Further, the purpose of including the low and very low volume categories was to conduct assessments on roadway segments representative of local roadways. In addition, for these same triple-trailer configuration States, similar VMT information was extracted for each double-trailer category (i.e., VMT for two-trailer configurations with five, six, seven and eight-axles) since the first one is the potential control vehicle. The study team felt that using 2008 VMT was suitable since the analysis includes crash data from 2008 – 2012, and these data verified that the triple-trailer configurations were in operation for the full period.
Finally, information on the presence of crash form variables related to number of trailers and number of axles were added for each State with triple-trailer configurations. Again, the axle count information is critical to distinguish between data for the control double configuration from data for the heavier double-trailer configurations like the Rocky Mountain Doubles (twenty-eight and one-half foot trailer or semitrailer hitched to a full semitrailer) and Turnpike Doubles (twin full length semitrailer or semitrailer-trailer combination). The study team also initially searched for crash data variables related to operating weight to allow for even better definition of the alternative triple-trailer configurations and separation of the twins from other double-trailer configurations. However, none of the States has actual operating weight information on the crash report forms. For that reason, the study team performed the analysis of the crash experience of the two triple-trailer configurations’ GVW classes by using States with different GVW limits for these combination vehicles. That is, the sample of States to be studied included both those with a 105,500 lb. GVW limit and those with a 129,000 lb. GVW limit for triple-trailer configurations.
Use of maximum GVW limits rather than the missing individual truck weights means that the crash analyses in this study are not comparisons of individual trucks above and below 80,000-lbs., but rather are comparisons of groups of trucks that could potentially run at that weight and configuration (e.g., the comparison of the triple-trailer group with a maximum GVW limit of 105,500 lb with a twin-trailer group with a maximum GVW limit of 80,000 lb).
None of the States allowing triple-trailer configurations fit all three criteria – high VMT for triple-trailer configurations, the ability to limit the control double group to the twin-trailer configuration, and a GVW limit that matches the two scenario targets of 105,500 lbs. and 129,000 lbs. Initially, five States had at least moderate potential for analysis: Idaho and Oregon for the 105,500 lb. triple-trailer configurations and Kansas (Turnpike only), Nevada and Utah for 129,000 lb. triple-trailer configurations.
The lists of candidate States were further reduced as the research team working on the Volume II: Compliance Comparative Analysis effort uncovered additional information concerning actual GVW limits. Oregon was dropped from the 105,500-lb. group and Nevada and Utah were dropped from the 129,000-lb. group because their crash forms did not include an axle-count variable. This made it impossible to differentiate between the different double-trailer configurations in the crash data. This was critical since all three States allow longer and heavier double-trailer combinations (e.g., Rocky Mountain Doubles and Turnpike Doubles). The lighter five- and six-axle double-trailer configurations (the most likely twins groups) could not be separated from these heavier eight- and nine-axle double-trailer configurations (for which there was significant 2008 VMT), making the definition of a suitable reference group impossible.
These reductions resulted in two analysis States – Idaho for the 105,500 lb. triple-trailer configurations (Scenario 5) and Kansas for the 129,000 lb.-triple-trailer configurations (Scenario 6).
In the case of Idaho, while showing moderate triple-trailer configurations VMT in 2008 compared to other States that allow triple configurations to operate, the Idaho crash form contained information on the number of axles on the truck up through 2010. (The variable was removed from the crash form in 2011.) This allowed the isolation of the crashes for the five- and six-axle double-trailer configurations (likely twins) from the double-trailer configurations with more axles. While the maximum GVW limit for double-trailer configurations is 105,500 lbs., information collected by the Volume II: Compliance Comparative Analysis study team from Idaho staff indicates that the realistic maximum for twins is 80,000 lbs., the desired GVW for the control vehicle. The GVW limit for triple-trailer configurations is 105,500 lbs., the target GVW.
For Kansas, the initial investigation showed some triple-trailer configuration VMT on rural Interstates, an 80,000-lb. maximum GVW for double-trailer trucks, and axle-count data on the crash form to allow the isolation of the five- and six-axle (presumed) twin trailer group. The maximum GVW limit for triple-trailer configurations is 120,000 lbs., which is close to but somewhat lower than the 129,000-lb. limit desired. It was later learned that triple-trailer configurations flow was primarily on the Kansas Turnpike with some flow on limited sections of other connecting Interstates. As described below, some turnpike exposure data were later obtained from both the Turnpike Authority and from the Kansas DOT.
Crash data, roadway inventory, and AADT data for Interstate roadways were obtained from the State DOTs in both Idaho and Kansas. Exposure data for the alternative and control trucks on the Kansas Turnpike were still missing since there were no WIM data collected on toll roads. The Kansas Turnpike Authority supplied average daily counts of trips between pairs of toll stations (e.g., toll station 1 and toll station 9) categorized into axle-count classes. Individual counts for vehicles with seven, eight and nine or more axles were included. Safety team staff developed accumulated counts between each pair of mile-posted stations, resulting in AADT estimates for each axle category. Additional data were also acquired from the Kansas DOT Planning Department, which included 13-bin counts for five locations along the Turnpike. A method was developed to combine the two data sets to estimate twin configuration AADT. Unfortunately, the data do not allow the seven, eight, and nine axle counts to be separated into counts for triple-trailer configurations vs. non-triple trailer trucks. Kansas Turnpike Authority staff was interviewed to determine if they could provide estimates of the percentage of triple-trailer configurations within the seven, eight, and nine or more axle categories; they could not. Thus, the triple-trailer configurations estimates were produced from WIM data that were collected on Interstate 35 in the adjacent State of Oklahoma. This is the same Interstate that forms the southern-most leg of the Kansas Turnpike. The percentage of seven-and eight-axle trucks that were classified as triple-trailer configurations in the Oklahoma data were applied to the total seven- and eight-axle vehicles on the Kansas Turnpike to arrive at the estimated AADT values for seven- and eight-axle triple-trailer configurations on the Turnpike.
Similarly, the Indiana Toll Road (ITR) Concession Company, and the Ohio Turnpike and Infrastructure Commission provided either daily segment counts or entry and exit counts for a seven-or-more axle category by month for the entry and exit terminal to the toll road. Staff from both agencies were contacted and asked whether or not there was any supplemental information that could be used to estimate the proportions of the seven-axle-plus group that would be triple-trailer configurations. No such information was available. For this reason, the toll road analysis in these two States was dropped from further consideration.
In summary, two States could provide sufficient data to even attempt analysis – Idaho for the 105,500 lb. triple-trailer configurations scenario and the Kansas Turnpike for the 129,000 lb. scenario.
Data Considerations
At the same time as potential States were in the process of being examined and identified, other data needed in the analyses was also be acquired – crash data, roadway inventory and traffic volume (AADT) data, and exposure data for truck configurations based on weigh-in-motion (WIM) systems.
Crash Data
The crash data required came from State crash databases, which comprise data collected by police agencies. Based on limitations in the WIM data described below, the State crash-based analyses were constrained to Interstate routes only. Since the final choice of States to be analyzed could not be made until late in the project, the USDOT study team requested and received crash data for Interstate routes from nine States (Idaho, Indiana, Kansas, Kentucky, Louisiana, Michigan, Nevada, Oregon and Utah). Data from three more States (Ohio, Maine and Washington) were received from FHWA’s Highway Safety Information System (HSIS). Each crash was linkable to data in the roadway inventory file. The data were received in various formats and were all converted to SAS files for analysis.
Roadway Inventory and Traffic Volumes
The USDOT study team requested and received roadway inventory and AADT data for Interstate routes from the same 12 States identified above. State roadway inventory systems generally include inventory descriptors (e.g., functional class, number of lanes, median width, shoulder width, AADT, etc.) for all State routes, including all Interstate routes. Each data record describes a segment of a route which is homogeneous with respect to critical inventory variables chosen by the State (i.e., all critical variables, including AADT, remain constant throughout the entire segment). Again, data were converted from various received formats to SAS files.
For the final set of States having sufficient crash and VMT data, the study team mapped crashes to the inventory files and added counts of crashes involving the five- and six-axle vehicle and the double-trailer and triple-trailer configurations to each roadway segment as appropriate, sometimes with ramp involvement indication. Some States provided AADT information separately from road inventory information, and in some cases, the ends of the AADT segments did not align with the ends of roadway inventory segments. In these cases, the inventory segments were split where necessary to associate correct values from each file with each segment. Crashes were subsequently mapped to this re-segmented data.
Truck Exposure Data
The WIM data estimates used were developed separately for use across all area of the study. As described in the Volume II: Data Acquisition and Technical Analysis Plan, WIM data were available in the data sets FHWA maintains in the Office of Highway Policy Information’s Traffic Monitoring Program and LTPP databases. FHWA provided VMT data on 13 vehicle types estimated in the classification data, 12 functional highway classes, and all States, and the data were adjusted to match 2011 VMT estimates. WIM data were then used to further split the 13 vehicle types into 28 detailed vehicle classes (VCs) and 100 operating weight groups (OGWs) needed for the study. These 28 detailed vehicle classes included each of the alternative vehicle and control vehicle classes in the scenarios analyzed in this study. The weight data were not used in the safety study since weight-related categorization of crash data was not possible.
The study team originally anticipated that the WIM-based estimates of VMT for the alternative and control truck configurations could be tied to specific locations on Interstate routes in each State and then could be extrapolated to additional roadway sections based on information on alternative truck configuration flows obtained from State staffs (e.g., one assumption might be that while the VMT of the twin configuration varies with total AADT changes along an Interstate route, triple-trailer configurations VMT might be essentially constant from end to end). In addition, ideally the 2008 data used earlier in the safety plan would be similar enough to the new 2011 data to provide a second VMT data point. Unfortunately, further discussions with the FHWA Traffic Monitoring and WIM Program Managers indicated that neither assumption was true. Due to the limitations of the WIM system (e.g., collection in a single lane of a multi-lane Interstate), the data could not be subdivided further than to the functional class (rather than route location) level. In addition, the method used to estimate configuration-specific VMT in the 2008 data differed from the 2011 data to the extent that the 2008 data were not usable as a second data point.
This first restriction of WIM data to the functional class level affected the safety analyses in two ways. First, the data would not allow analysis on non-Interstate routes. The availability of one alternative or control truck VMT percentage for all roadway segments within, for example, all miles of rural principal arterials within a given State was not sufficient to develop the exposure data needed for the crash analysis. The study team anticipated that the alternative truck VMT (e.g., VMT for the Scenario 1, 2, and 3 vehicles) would vary greatly on different rural arterial roads in a given State. The differences in roadway geometrics and AADT levels among all such segments would make comparisons virtually meaningless. After careful consideration, the study team decided that the safety analyses would be restricted to urban and rural Interstate routes. This is a major limitation of the crash-based analyses.
In general, the roadway geometrics (e.g., divided roadway, curvature, grades, paved shoulder width, etc.) are more consistent across all rural or urban Interstates in a given State than would be the case for non-Interstates. In the regression analyses performed, the team used a roadway segment-based analysis method. The urban and rural Interstate route restriction means that the study assumes that the VMT for alternative (and control) trucks varies with the total AADT along any given route in these regression analyses. The team attempted to obtain information that would allow us to modify the assumption in Idaho, the State selected for the triple-trailer configurations analysis. Idaho DOT staff was contacted to obtain information on the specific triple-trailer configurations that may be operating on different Interstates or on sections of a given Interstate. Idaho DOT staff indicated that travel by triple-trailer configurations is unrestricted and that no additional information on triple-trailer configurations routing was available on a route basis.
In summary, each record in the final research files developed for each State was a homogeneous segment of Interstate highway. Crash counts for different crash types were added to each homogeneous segment. The AADT data for the segments were further divided into truck AADT categories for the alternative and control trucks using proportions from the WIM data.
Analysis Methods
This section describes the methods used to analyze the crash data that were obtained from rural and urban interstates in four States: Idaho, Michigan, Washington, and Kansas. In Kansas, only Turnpike data were included. Two approaches were used: crash involvement rates and regression models. Both are described below.
Crash Involvement Rates
The crash involvement rate for a truck category was defined as the ratio of the number of crash involvements to million vehicle miles traveled (MVMT). As described earlier, only axle and trailer counts were available in the crash data. The use of axle count and trailer count data does not necessarily restrict the five-axle tractor semitrailer configuration or the six-axle semitrailer configuration to the 3-S2 or 3-S3 configurations in the scenarios; there could possibly be other five-axle and six-axle semitrailer configurations in the crash data. However, examination of the WIM data, which includes both the 3-S2 and “other five-axle semitrailer” categories indicated that, in the States analyzed, the VMT for the latter was very low compared to the VMT for the 3-S2 configuration. The 3-S2 configuration accounted for over 87 percent of the total five-axle VMT in the States analyzed. The same was true for the 3-S3 configuration and other six-axle semitrailer configurations, where the 3-S3 configuration accounted for over 99 percent of the total six-axle VMT in the States analyzed. Thus, while the five- and six-axle configurations in the crash data are very similar to the 3-S2 and 3-S3 configurations desired in the scenarios, the terms “five-axle” and “six-axle” will be used in the narrative below rather than “3-S2” and “3-S3” to more accurately portray what was used in the crash analyses.
Given this terminology, the following truck types were investigated:
- Five-axle semitrailers (including 3-S2 and other five-axle semitrailer combinations)
- Six-axle semitrailers (including 3-S3 and other six-axles semitrailer combinations)
- Five-axle and six-axle axle twin trailers
- Seven-axle and nine-axle triple trailers
The USDOT study team used data from Idaho, Michigan, Washington, and the Kansas Turnpike to calculate and compare the crash involvement rates for the five-axle semitrailers and six-axle semitrailers. Data from Idaho and the Kansas Turnpike were used to calculate the crash involvement rates for twin and triple configurations in order to compare the rates between these two configurations.
As noted above, the source of the crash data were the crash files from the State DOTs and police agencies. To determine whether a vehicle was a truck that was relevant to the study, information on vehicle configuration, number of trailers, and the number of axles were used. For Idaho, Michigan, and Washington, AADT information was obtained from the State DOT and combined with information on VMT for specific alternative and control truck configurations from the WIM files. As described earlier, the configuration-based VMT estimates for the Kansas Turnpike were developed in a different manner.
Table 4 shows the number of crash involvements and MVMT for semitrailer truck combinations in Washington (Scenario 2), Idaho (Scenario 3) and Michigan (Scenario 3). (Rates calculated from these data are provided later in the “Results” section.) Table 5 shows the crash involvements and MVMT for twin and triple trailers in Idaho. Table 6 shows the crash involvements and MVMT for the Kansas Turnpike, depicting not only the twin- and triple-trailer data used in the Scenario 6 analysis, but also the five- and six-axle semitrailer data used in the later scenario analyses.
It is important to note the crash and VMT sample sizes in all three tables. The VMT and crash samples sizes for the Table 4 six-axle alternative truck configuration in Washington are larger than those for Idaho and Michigan, but all three States provide what are considered to be adequate samples. Conversely, the sample sizes for triple-trailer combination crashes and VMT in Table 5 (Idaho) and Table 6 (Kansas Turnpike) are limited. As will be noted again later, crash involvement rates that are calculated for these categories should be used with caution.
Regression Models
The above-described rate analyses in effect makes two important assumptions:
- Truck crash involvements have a linear relationship to truck VMT. In other words, it is assumed that a certain increase (say, 10 percent) in MVMT would result in the same (i.e., 10 percent) increase in crash involvements.
- The truck involvement rate per truck VMT is constant over the full range of total AADTs on segments of rural and urban Interstate. In other words, increases in total AADT do not affect the truck crashes per truck VMT rate.
Contemporary safety analysis methods respond to these questionable assumptions by using regression models, which seek to develop more detailed information on the effect of total traffic volume on truck crash rates per truck mile. This approach was used for analyses in Scenarios 2 and 3, but not Scenarios 5 and 6 due to the limited number of crashes associated with triple-trailer configurations in these scenarios.
The state-of-the-art method for crash modeling is to use negative binomial regression models with crash involvements as the dependent variable (depending on how the model is structured, it can be used to predict the crash involvement rate per different units of exposure; e.g., per mile or per vehicle miles traveled). The independent variables investigated included truck VMT, AADT, and segment length. AADT for each segment was obtained from the roadway inventory files for each State. Since the intent was to estimate separate models for the different truck configurations, truck volume for each configuration for each segment was needed. As noted earlier, estimates of truck VMT for each configuration were only available in the WIM data developed globally for use in each analysis area of the study. While the WIM data are collected at specific locations on rural and urban Interstates in each of the States being used, the limitations on the data collection methodology meant that the WIM-based VMT estimates were only usable at the functional class level – one estimate for rural Interstate VMT within a given State and one estimate for urban Interstate System VMT.
Given this limitation, the following are estimates for truck volume for each segment:
- The proportion of the VMT for each truck configuration for rural and urban Interstates in each State was determined by using the VMT estimates in the WIM data. For example, the VMT proportion for five-axle semitrailers on rural Interstates in Idaho was the VMT for five-axle semitrailers on rural Interstates in Idaho divided by the total VMT on rural Interstates in Idaho. The VMT proportions calculated for the different truck configurations in Idaho, Michigan, and Washington are provided in Table 7 below.
- The VMT proportion for a particular truck configuration was multiplied by the AADT for a segment to estimate the truck volume for that segment. This means that the truck volume percentage (for a particular truck configuration) was assumed to be the same for all the roadway segments in a State that belonged to the same functional class. In effect, this means that the truck flow for a given configuration along a given route varies with the total AADT flow.
The following model forms were investigated:
 (1)
(1)
 (2)
(2)
 (3)
(3)
Where:
Y = yearly number of crash involvements for a particular truck configuration in a segment,
TruckVMT = million vehicle miles traveled for each truck configuration in each segment,
Length = the length of the segment in miles,
AADT = the annual average daily traffic, and
a, b, c = parameters to be estimated as part of a negative binomial regression.
In model form 1, TruckVMT was included as an offset (i.e., the coefficient multiplying TruckVMT is set to 1.0). In model forms 2 and 3, roadway section length was included as an offset. By including offsets, it is possible to investigate rates – model form 1 would predict the rate of truck crash involvements per VMT as a function of AADT. Model forms 2 and 3 would predict the rate of truck crash involvements per mile as a function of two different types of “combined exposure,” including both truck volume and total AADT.
Model forms 1 and 2 could not be reliably estimated due to the co-linearity between AADT and truck volume. So, only model form 3 was used. In model form 3, the combined exposure term is the product of total traffic volume and truck volume (the 10,000 used in the denominator for AADT is a scaling factor that is used to obtain more significant digits in the estimation process when one of the independent variables is large compared to other independent variables). If b is 1.0, then the relationship between crash involvements per mile and the exposure (product of AADT and truck volume) is linear. If linear, then greater confidence can be place on the use of the truck involvements per VMT rate described in the previous section. Many previous studies have shown that the relationship between crashes and exposure is typically non-linear. So, in most cases, b is expected to be different from 1.0.
Parameter b can be used to determine the rate of increase in crashes as a function of exposure. If b is higher, then crashes increase faster with exposure compared to when b is lower. If there are differences in the size of the b parameters for a given alternative truck configuration versus the control vehicle scenario (e.g., five-axle semitrailer vs. six-axle semitrailer), then the rate per mile for one configuration is more sensitive to total AADT and truck volume than the rate per mile for the other configuration.
Results
Because of the small crash sample sizes available for some of the following analyses, particularly for the triple trailer configurations, results are reported where the p-value resulting from the statistical test conducted (i.e., p ≤ 0.15) is higher than what is typically reported (i.e., p ≤ 0.05). The use of this broader range of significance levels has been supported by others (e.g., Hauer, 2004). In the findings below, the term "significant" will be used to refer to findings at the p ≤ 0.05 level, and the term "marginally significant" will be used for findings with p-values between 0.05 and 0.15.
Crash Involvement Rates
Tables 8, 9, and 10 show the crash involvement rates along with the average crash involvements per year in each State for the different vehicle configurations. It is clear from Table 8 that the crash involvement rates for six-axle alternative truck configurations are consistently higher compared to the five-axle control configuration. The rate for urban six-axle semitrailers in Idaho is unusually high (7.634) and, as shown in Table 4, based on very low estimated VMT relative to the other cells. It should be viewed with extreme caution. Based on the data in Table 4 showing that the VMT of six-axle semitrailers in Idaho and Michigan is much lower (about 17 million vehicle miles) compared to that in Washington (85 million vehicle miles), the Washington rates are likely more reliable estimates; however, note that they are for a configuration with different GVW limits.
A likelihood ratio test (Al-Ghamdi, 2007) was conducted to test the statistical difference between the crash involvement rates of five-axle semitrailers and six-axle semitrailers. The results revealed that the difference was statistically significant (at the 0.05 significance level) in all cases except for rural interstates in Idaho.
Based on Table 9 (from Idaho), the crash involvement rates for triple-trailer configurations are lower compared to twin-trailer configurations. As discussed earlier, triple-trailer configurations have very limited VMTs and, consequently, a limited number of crashes (n=15). The likelihood ratio test revealed that while the differences between the crash involvement rates of twin-trailer and triple-trailer configurations were not statistically significant at the 0.05 significance level, the differences in rates on rural Interstates and combined urban and rural Interstates were marginally significant (i.e., p<0.10). Limitations in VMTs (and consequently crashes [n=15] preclude any further explanation.
The results from Table 10 (from Kansas Turnpike) are slightly different from those in Idaho for twin-trailer and triple-trailer configurations. The overall rate (for combined rural and urban roads) for twin-trailer and triple-trailer configurations is almost identical. On rural roads, the rate for triple-trailer configurations is slightly higher, and in urban roads, the rate for triple-trailer configurations is lower. The likelihood ratio test revealed that the differences between the rates of twin-trailer and triple-trailer configurations were not statistically significant at the p=0.15 significance level. Note again that there was a small sample of triple-trailer configuration crashes in this analysis (n=10). (Note that the rates presented for semitrailer configurations will be used in the later scenario analyses.)
NT: Not tested due to low sample size of urban crashes in Idaho (see Table 5 showing only six twin-trailer and two triple-trailer crashes on urban Interstates in Idaho)
Regression Models
Recall that the modeling effort involved development of a regression model of the following form:
 (3)
(3)
Where:
Y = yearly number of crash involvements for a particular truck configuration in a segment.
TruckVMT = million vehicle miles traveled for each truck configuration in each segment,
Length = the length of the segment in miles,
AADT = the annual average daily traffic, and
a, b, c = parameters to be estimated as part of a negative binomial regression.
Table 11 shows the model parameter estimates for model form 3 for both the five-axle control truck configuration and the six-axle alternative truck configuration. In all the models, rural and urban roads were combined since the sample was not adequate to estimate separate models.
Along with the estimates and the standard errors for a and b, several goodness of fit statistics are provided. k1 is the over-dispersion parameter. Based on the recommendation from Hauer (2001), this was estimated for unit length of the road (i.e., for 1 mile)[2]. Unlike traditional linear regression there is no unique R2 in negative binomial models. Two commonly used R2 are presented: Freeman Tukey R2 (Fridstrom et al., 1995) and the Pseudo R2 (Miaou, 1996). The Pseudo R2 is estimated on the basis of the over-dispersion parameter of the model with the independent variables compared to the over-dispersion parameter of a model with just the intercept term (i.e., just a). The Freeman Tukey R2 tends to be low when the data are sparse, which is the case with truck crashes. So, some researchers prefer to use the Pseudo R2 is these circumstances.
As shown in Table 11, reliable models could not be estimated for six-axle alternative configurations in Idaho. The goodness of fit statistics indicate the remaining models to be reasonable. For the other two States, it is clear that b is very different from 1.0, indicating that the relationship between crash involvements and exposure (i.e., product of AADT and truck volume) is not linear. This indeed raises some caution about the use of rates in comparisons of alternative truck and control truck configurations. If possible (i.e., if adequate roadway segment-based exposure data become available), future analyses of truck safety should use regression-type approaches to overcome this issue.
In addition, in Michigan, b is higher for the six-axle semitrailers compared to the five-axle semitrailers, suggesting that crash involvements among vehicles with the six-axle alternative configuration increase at a much faster rate with an increase in exposure compared to five-axle control configuration. In Washington, there is very little difference between the b for the six-axle model and that for the five-axle model. These contrasting findings are explored more in the following section.
Plots
Using the models that were estimated for Michigan and Washington, the plots shown in Figures 2 and 3 were created between truck involvements per mile on the y-axis and truck volume on the x-axis. The main purpose of the plots was to show the shape of the relationship between crash involvements and truck volume. Since the truck involvement rate per mile shown in these plots is a function of both truck volume and AADT, the plots were created for the mean value of AADT in the two States. In Michigan, the mean AADT was 46,000, and in Washington, the mean AADT was 55,000. These average AADTs are weighted averages based on segment lengths.
Figure 2: Truck Involvements per Mile versus Truck Volume for Six-Axle Alternative Truck Configurations and Five-Axle Configurations in Michigan

In Michigan, the maximum daily volume for five-axle semitrailer combinations was 15,500, and the maximum daily volume for six-axle semitrailers was 170. In Washington, the maximum daily volume for five-axle semitrailers was 8,500, and the maximum daily volume for six-axle semitrailers was 1,150.
The plot was created from truck volume 0 through 10,000. For six-axle semitrailers, only a portion of the line is shown as a solid line (the rest is a dashed line) representing the fact that the maximum volumes for this vehicle configuration were very low compared to the volumes for the five-axle semitrailers. It is clear from these plots that the relationship between truck involvement rate per mile and truck volume is not a straight line, again showing the limitation of using truck involvement per VMT rate in the comparison of scenario and control truck configurations.
The plots also demonstrate the differences between the WA and Michigan models for the six-axle alternative truck configurations vs. the five-axle control truck configurations, with the Michigan data suggesting that crash involvements among six-axle alternative truck configurations increase at a much faster rate with increases in exposure compared to that for the five-axle control configuration. Given the fact that the Washington data (which show very little difference in b values for the two configurations) is based on much higher truck VMTs, whether or not involvement rates per VMT for six-axle configurations do indeed increase more than rates for the five-axle control configuration remains an issue for further study.
Figure 3: Truck Involvements per Mile versus Truck Volume for Six-Axle Alternative Truck Configurations and Five-Axle Controls in Washington
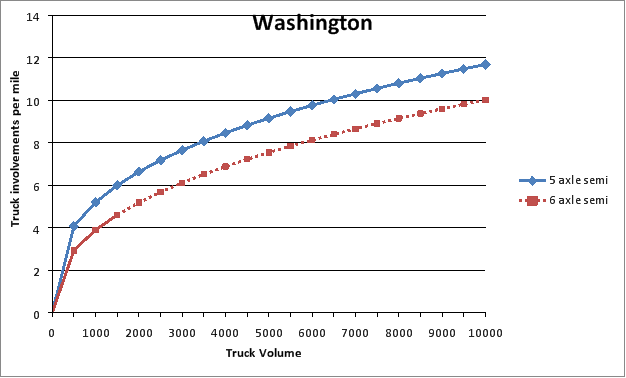
In addition to the crash rate and modeling analyses described above, the safety team conducted two additional analyses to determine (1) the severity of crashes involving each scenario configuration and control truck configuration, and (2) longitudinal barrier impacts involving the different scenario and control configurations. Both of these analyses used the same truck involvements used in the above-described rate and modeling analyses.
Crash Severity
The USDOT study team developed a measure of injury for use in analyzing crash severity that included not only injuries to truck occupants, but also injuries to occupants of non-trucks involved in a truck-related crash. All but one of the crash databases used in the above analyses included a “crash severity” variable, which captured the most severe injury in any vehicle involved in the crash. While this information was not included in the Idaho crash file, it was derived based on included variables related to the number of injuries in the crash for each injury level (e.g., total number of fatalities in the crash).
The “KABCO” scale is used by each State as a measure of the functional injury level of the victim at a crash scene. The codes are selected based on the on-site judgment of the investigating police officer completing the crash report. While there may be minor differences in the descriptions for each severity level across the States, in general, the following definitions apply:
- K – Fatal injury
- A – Incapacitating (serious) injury
- B – Non-incapacitating (Moderate) injury
- C – Possible (Minor) injury
- O – No injury (property damage only)
In the tables below, the A, B and C categories are combined into one “Injury” category.
Also note that injury frequencies shown in each of the tables below are the number of truck involvements in crashes rather than the number of truck-related crashes. The maximum injury severity in the crash is linked to each truck involvement. If two trucks are in the same crash (e.g., a twin vs. a triple), the same maximum injury severity in the crash is assigned to both. The use of truck involvements makes these tables consistent with the earlier analyses, which were also based on involvements, and should not differ much from crash-based frequencies since crashes involving more than one truck are rare. Finally, since the States did not provide person/occupant files, it is not possible to analyze injury to truck occupants separately from injury to non-truck occupants using the State data.
In terms of interpreting the importance of differences in the tables, note that the distributions for each pair of alternative and control trucks were compared using the Fisher’s exact test for contingency tables (Fisher, 1922). It is most useful when sample sizes are small, but it is valid for all sample sizes. It was first developed for a 2 X 2 table, a table constructed of two x-axis values and two y-axis values, but has since been extended to the general case of an m X n table (Mehta and Patel, 1983). In this study, the Fisher’s exact test was implemented using the SAS statistical software.
Table 12 shows the severity results for the control and alternative truck configurations in Scenario 2 – a comparison of the five-axle control configuration with the six-axle alternative configuration. All results in this scenario use data from Washington. While the non-injury percentages for the six-axle alternative configurations are slightly higher in all three comparisons, none of the differences are even marginally significant at the p=0.15 level.
Tables 13 and 14 show the severity results for the alternative and control truck configurations from Scenario 3 – comparison of the five-axle control semitrailer with the heavier six-axle alternative vehicle. Table 13 results are from Idaho data and Table 14 results are from Michigan data. As noted earlier, while the scenario targets were a six-axle, 97,000-lb. configuration and a five-axle, 80,000-lb. control configuration, both Idaho and Michigan allow the six-axle configuration to operate up to 105,500 lbs. and the five-axle control vehicle to operate up to 86,000 lbs.
In Idaho, the involvements of the Scenario 3 six-axle configurations appear to be less severe than the five-axle control vehicle involvements. The rural and urban Interstate differences are marginally significant (p=0.07 and p=0.14, respectively), and the combined distribution differences are significant at the p=0.01 level. The Michigan rural Interstate distributions follow the same pattern as the Idaho distribution (i.e., less severe involvements for the six-axle alternative configuration, p=0.14), but there are no differences in the distributions for the urban or combined situations.
Table 15 shows the severity results for the control and alternative truck configurations from Scenario 5. These results are from Idaho, and the maximum GVWs for both the control and scenario vehicle match the desired GVWs.
The sample sizes for the triple-trailer configurations are very small, making comparisons difficult. Almost all the triple-trailer configurations crashes are on rural Interstates. Comparison of the non-injury crashes shows the triple-trailer configuration to have a higher percentage. The difference in the rural Interstate distributions is marginally significant (p=.09).
Table 16 shows the severity results for the control and alternative truck configurations from Scenario 6. These results are from the Kansas Turnpike data, where the maximum GVW for triple-trailer configurations on the Turnpike is 120,000 lb. rather than the desired 129,000 lb. A realistic maximum GVW for twin-trailer configurations could not be determined. Note that the number of crashes involving triple-trailer configurations is so small that the rural and urban counts are combined in Table 16.
| Rural/Urban | Severity | Truck Configuration | |||
|---|---|---|---|---|---|
| Twin Trailers | Triple Trailers | ||||
| Frequency | Percent | Frequency | Percent | ||
| Rural & Urban | Fatal | 0 | 0.00 | 0 | 0.00 |
| Injury | 11 | 32.35 | 2 | 20.00 | |
| Non-Injury | 23 | 67.60 | 8 | 80.00 | |
| Total | 34 | 100.00 | 10 | 100.00 | |
Because of the small sample sizes for both the alternative and control vehicles, no differences in distribution can be seen or were found with the statistical testing.
In summary, the analysis of crash severity distributions for the alternative truck and control truck configurations in the different scenarios yield slightly different results. The comparisons of twins and triple-trailer configurations were consistently unable to find any differences; small sample sizes likely contributed to this result. Comparisons for Scenarios 2 and 3 showed some indication of reduced crash severity for the six-axle alternative truck configurations compared to the five-axle control vehicle, although this finding was more apparent in Idaho and less apparent in Michigan.
Crashes Involving Longitudinal Barriers
The USDOT study team also investigated possible differences in the behavior of longitudinal barriers when struck by the different control and scenario vehicle configurations. Longitudinal barriers for use in Federally funded projects are currently evaluated based on a series of crash tests where the maximum GVW is 80,000 lb. for a tractor semitrailer combination. On question is whether the heavier trucks in the scenarios would penetrate the existing roadside barriers more often, either resulting in greater injury to the truck driver or to occupants of other vehicles struck if the truck penetrates a median barrier or is redirected into other vehicles as the result of a shoulder barrier impact.
The study team examined this issue by using computerized data in the crash and vehicle/unit files, which would (1) identify run-off-road crashes into barriers and (2) give some indication of a subsequent hazardous impact into either a vehicle or another (possibly hazardous) object. While no State database includes a variable indicating whether a barrier has been penetrated or not, the presence of a subsequent impact with either another vehicle or with a possibly hazardous object would provide at least some information on possible penetration or poor redirection. The nature and percentages of “poor performance after barrier impact” can be compared in impacts involving a control truck vs. an alternative truck.
In effect, this requires that a State’s crash data to include the following:
- A sequence-of-events (SOE) variable for each vehicle in the crash with at least three events coded;
- That the SOE include “run-off-road” as a possible first event;
- That the SOE include codes for impacts with specific longitudinal barriers (e.g., guardrail face or end, median barrier, concrete barrier, cable barrier, etc.) rather than grouping all longitudinal barriers with other “fixed objects”; and
- That the SOE also include codes for “other motor vehicle” and other potentially hazardous objects that could be struck after barrier impact (e.g., ditch, embankment, tree, overhead sign support, bridge pier, culvert, etc.).
The variables in the crash and vehicle files were examined for each of the four States used in the other crash analyses – Idaho, Kansas, Michigan and Washington. Idaho and Michigan files both met the above requirements. While both Kansas and Washington had an SOE variable, longitudinal barriers were grouped with all other fixed objects, thus they were not used in this analysis. To be consistent, the trucks examined in this analysis were the same as in the other analyses. All impacts occurred on rural or urban Interstates in Idaho and Michigan. The crashes on urban and rural Interstates were combined to increase the sample size and because the design of longitudinal barriers would be the same in both types of location.
With respect to Scenarios 2 and 3, both Idaho and Michigan data were used in the comparisons with the 80,000-lb. control vehicle. The first step in the procedure was to scan the SOE codes to identify vehicles that had run off the road. A manual review of the SOEs indicated that different sequences were being used to describe ran-off-road (ROR) crashes both within and between States. Based on this review, the following codes or combinations were used to identify ROR crashes:
- A ran-off-road code in Event 1
- A code for any impact with a fixed object normally found on the roadside in Event 1 (e.g., guardrail, bridge pier/abutment, ditch)
- Event 1 was “loss of control” and Event 2 was either “run off the road” or an impact with a roadside fixed object
Second, each ROR event was screened to identify a next event involving a guardrail face or guardrail end in both States, a concrete traffic barrier in Idaho or a median barrier in Michigan. (No impacts with bridge rails were found as the next event in either State.) Finally, for this barrier-related subset, the subsequent event or events were scanned to determine how many involved subsequent impacts that would likely be hazardous to either the truck or to another roadway user. Of the 65 different event codes in Idaho, 33 were selected as having “likely hazardous” impacts. These included the following codes:
- Immersion
- Pedestrian
- Pedal cycle
- Train
- Other Object Not Fixed
- Parked Car
- Impact Attenuator
- Bridge Pier/Abutment
- Bridge Parapet End
- Overpass
- Overhead Sign
- Luminaire/Light Support
- Utility Pole
- Other Post, Pole or Support
- Culvert
- Ditch
- Embankment
- Tree
- Building/Wall
- Other Fixed Object
- Impact with Another Vehicle (10 Crash types codes)
- Came Back On Road
- Traffic Signal Support
- Utility/Light Support
A very similar list of “likely hazardous” impacts was identified in Michigan’s list of 45 event codes. Note that while “Overturn” is not included in the list above, counts were made of truck overturns immediately after barrier impact. While perhaps not a measure of possible barrier penetration, it is a measure of potential harm after barrier impact.
Example SOE codes not chosen to identify hazardous subsequent impacts included those related to fire/explosion, animals, other longitudinal barriers, delineator posts, traffic sign posts, curbs, mailboxes, etc. Table 17 shows the results of this analysis for 3-S2s and 3-S3s in both Idaho and Michigan.
The primary data of interest here are the percent of barrier involvements followed by subsequent hazardous event. However, the small sample of alternative truck configurations involved in longitudinal barrier impacts in each State (i.e., three in Idaho and one in Michigan) makes drawing conclusions concerning behavior after impact impossible.
The study team also attempted to conduct similar analyses for comparisons of the control double with the Scenario 5 configuration in Idaho, where of the 43 control double configuration involvements, 12 (27.9 percent) were in ROR crashes. However, only one (8.3 percent) of the ROR impacts involved a longitudinal barrier, and an overturn occurred after that barrier impact. Of the 15 Scenario 5 configuration involvements, 6 (40 percent) were in ROR crashes, but none involved longitudinal barriers. Obviously, no conclusions can be drawn from these data.
In summary, while an attempt was made to quantitatively analyze differences in behavior after longitudinal barrier impact for alternative vs. control truck configurations, the analysis of available data indicated that such a comparison was impossible. The sample sizes of the control vehicles and the scenario vehicles striking roadside barriers were not sufficient for conclusions to be drawn. One logical interpretation of this finding is that ROR events do occur with the control and alternative configurations, but barrier involvements are relatively rare, and events subsequent to impacting a barrier are rarer still.
A logical sequence for additional research concerning possible barrier issues would be to expand the State crash databases studied with the above methodology by not limiting them to States which closely match the specific scenarios studied here. As noted earlier, there are additional States that currently allow heavier single semitrailer and double- and triple-trailer configurations. While not known, it would be expected that some of these States would have the needed SOE and hazardous impact codes. Such an analysis would provide needed information on the size of the problem (if any), which would help determine whether additional analysis based on barrier impact simulation or barrier crash testing are justified.
Currently, FHWA has a finite element analysis (FEA) model for an 80,000-lb. tractor-semitrailer (van) configuration. Additional FEA models could be developed for the six scenario configurations showing the largest problems in the crash data. Simulations with these new FEA models would then provide guidance for possible additional barrier crash testing involving the configurations shown to be problematic. Current barrier crash tests involve a 79,400-lb. GVW tractor-van combination and a 79,400-lb. GVW tractor-tank-trailer combination.
2.4 Route-Based Analysis
The USDOT study team originally planned a route-based analysis as part of this effort. The goal was to compare the safety of routes that operate scenario vehicles with routes that operate control configuration vehicles while controlling for such variables as total AADT, truck percentage, roadway type (i.e., functional class), number of lanes, urban/rural location, speed limit, etc. The outcome variable was to be truck crashes per mile of truck exposure. Note that this is a comparison of crashes per mile for all trucks, including the alternative configurations, with crashes per mile for all trucks where the scenario vehicles are not allowed to operate. Note that, unlike the State analyses described above, this is not a comparison of a specific scenario vehicle to a specific control vehicle. The basic method was to:
- Identify States that allow a certain alternative truck configuration on certain routes, but do not allow the same alternative configuration on other similar routes.
- Identify the target and non-target routes or route segments.
- Obtain crash data and total AADT, total truck percentage, and other inventory variables for each route section to be studied.
- Estimate safety performance functions to compare the safety of the target route segments used by the alternative configuration vehicles with route segments not used by those alternative vehicles.
Choice of State Data Bases
Again, this search was for States allowing a specific alternative truck configuration on certain route segments along with similar routes that did not allow the operation of that configuration. The search for potential States occurred at the same time as the search for the other State-based analyses, again examining crash and exposure data. The initial review identified Ohio, Indiana, Maine, and Louisiana as possible candidates for this method. In Ohio and Indiana, triple-trailer configurations are allowed on Interstate toll roads but not on other Interstates. In Maine, the 3-S3 alternative semitrailer configuration has been allowed on the Maine Turnpike since 2008 or earlier, but not on other Interstates until a pilot program began in 2010. In Louisiana, heavier semitrailer configurations are allowed on Interstates during the 100-day harvest season to accommodate the transport of sugarcane. Hence, for this State, the “baseline” would be the Interstate roads during the non-harvest months.
Further exploration eliminated Ohio and Indiana from the analysis because more than one alternative truck configuration operated on the Turnpike routes. In both cases, both triple-trailer configurations and other LCV's (e.g., Rocky Mountain Doubles) were allowed to operate. The comparison would then have changed from the desired triple trailer vs. twin-trailer configurations comparison to a comparison of all LCVs vs. twin-trailer configurations, a comparison that is not in any of the scenarios guiding this research. Louisiana was eliminated due to problems in obtaining a clear listing of routes and dates they were used by the alternative truck configurations.
This left Maine as the only State further considered since Maine (ME) did allow a single alternative truck configuration on a route. In ME, the alternative truck configuration is the Scenario 3 configuration, which was limited to a maximum GVW of 100,000 lbs., very close to the 97,000-lb. target. The target route would be the Maine Turnpike, which is part of I-95 from Kittery at the New Hampshire border north to Augusta in the middle of the State. This route did not allow other LCVs. The control route would be the remainder of I-95, north of the Turnpike section, a route that allowed twins, but not other LCVs. Data from 2008-2009 were to be analyzed since the alternative truck configurations were allowed on the Turnpike but not on the remainder of I-95 during these years.
Unfortunately, exploration of the Maine data from the HSIS system indicated that no truck percent or truck AADT was available. Maine DOT staff was contacted to determine if truck volumes or percentages for 2008-09 were available in any other files, but no such files existed in a format that could be linked with Turnpike and other I-95 sections in the HSIS ME inventory file. Thus it was not possible to conduct the route-based analysis.
2.5 Fleet Analysis
Background
The study team also investigated the availability of fleet data for use in the safety analysis. Early on in this study, the team acknowledged the advantages of obtaining crash data from carriers who operate the vehicle configurations in question, especially when there is uncertainty concerning the availability of accurate State-level crash information for specific configurations. Further, the team also recognized that for triple-trailer configurations, the vast majority of the operations (about 90 percent of vehicle miles) occur with a comparatively small number of carriers (about six). Thus, working through American Trucking Associations (ATA) and the American Transportation Research Institute (ATRI), contacts were established for crash and operations data reflecting triple-trailer and twin-trailer configuration operations (i.e., two 28.5 ft. trailers) as well as alternative configurations with legally permitted divisible loads (i.e., those regularly operating at over 80,000 lbs. GVW).
Two types of analyses were proposed: 1) a comparison of safety for the triple-trailer configuration (i.e., three 28.5 ft. trailers) compared to that for the double-trailer configuration (two 28.5 ft. trailers) and 2) a comparison of the Scenario 2 and 3 configurations with that of the 80,000-lb. control single configuration.
The study team proposed a common approach for the analysis of both the triple-trailer configurations and the Scenario 2 and 3 configurations. Crash data would consist of USDOT-reportable crashes, as these are most consistently reported and known to USDOT; discussions with all trucking industry representatives indicated that this was a reasonable request. Exposure to risk data was needed for all routes in question – either number of dispatches or vehicle miles traveled. To be consistent with the use of safety performance functions, it was critical that we obtain data on road segments with operations that result in zero crashes in a year as well as those with crash events. In addition, segment-based crash and exposure data were required. The intention was to use the fleet-based analysis to supplement analyses at the State level.
Trucking firms were assured that their data would be protected from release and unwarranted exposure. Data sharing agreements were established between carriers and the University of North Carolina, the custodian of the fleet data. In addition, data and model accessibility guidelines were developed to inform carriers of the degree to which their data would be held confidential within the team. The data accessibility guidelines are summarized in Table 18.
Despite these actions, several carriers declined to participate due to concerns about protection of their anonymity. Insufficient data were obtained from operators of alternative six-axle combination truck configurations proposed in this study, so the study team did not attempt analyses of these data. Data were obtained from several operators of triple-trailer configurations, though they were not at the level of detail anticipated. The lack of precision resulted in a more aggregated estimate of the triple-trailer configurations’ safety performance compared to that of the double-trailer configurations than was originally planned.
Methodology
The study Safety Project Plan (see Appendix B) proposed a crash analysis on a segment-by-segment basis. This approach is similar to that used in contemporary highway safety studies. While some data were available to support such an approach, the carriers were unable to supply other critical data. Carriers provided a set of individual crash records describing the crashes among triple-trailer and double-trailer configurations (with some variability from carrier to carrier). The crash records for the triple-trailer configuration were generally consistent with the data requested (see Table 19). In each case, however, there was no information supplied about road segments where the triple-trailer configurations operated with no crashes; this seriously constrained the analyses that could be performed.
1) For crashes involving double-trailer configuration, the same data listed above for each crashes involving double trailer combinations occurring in the following States on Interstate highways only is needed. States of interest are: Idaho, Indiana, Kansas, Kentucky, Louisiana, Maine, Michigan, Nevada, Ohio, Oregon, Utah, Washington.
2) For each of these States, the record of DOT-reportable double-trailer configuration crashes for the years 2006-2013 is needed.
3) For road segments (or terminal pairs) with no crashes, the number of vehicles (or vehicle miles) for each year, the route and the State is needed. It is essential that this information is available to conduct the modeling intended under this part of the study.
The carriers had difficulty in providing the exposure data for fleet-owned trucks in the selected States for the requested years. The primary difficulty was that carriers were not accustomed to analyzing safety based on road segment of travel, so their information systems could not readily supply the data requested. Crash report data and aggregate exposure data from some carriers was received. These data enabled the calculation of aggregate crash rates for triple trailer and double-trailer configurations (contained in Fleet-based Analysis Results section), but the data were insufficient to allow for a more detailed comparison of configuration crash experience.
Analytical Approach
The proposed analysis approach was to compare the safety performance of triple-trailer configurations and the control vehicle (i.e., a double-trailer configuration with two 28.5 foot trailers) used in the comparative analysis on the same or similar roadway segments. The analysis was based on the procedure commonly used in road safety studies and contained in the Highway Safety Manual (AASHTO, 2010). It was applied on a road segment basis as in the State analysis described previously.
This is a new approach not previously used in motor carrier studies (based on the completed Desk Scan – see Appendix A) although it has been broadly used in road safety management for several years. This approach was actively discussed during the second meeting with the NAS Peer Review Panel. Panelist comments recognized the challenges posed by the need to associate truck size and weight with crash outcomes. Had this approach been implemented, it would have allowed a more disaggregate approach to understanding truck crashes and thus provided better insight about the role of vehicle configuration. Unfortunately, sufficient data could not be consistently obtained to support a comprehensive analysis.
Fleet Rate Analysis Results
Carrier-provided data were inconsistent in content and depth. In most cases, complete crash records were available, but these were not matched to exposure so it was not possible to undertake the analysis as planned. In many cases there was no exposure data provided; in some cases where it was provided, it was at an aggregate level. While the required data were not obtained from a range of fleets, there were sufficient data to allow the computation of some comparisons between the safety performance of triple-trailer and twin-trailer configurations.
Based on carrier-supplied data, the following crash rates were computed:
- Twin-trailer configurations – 0.516 involvements per million vehicle miles
- Triple-trailer configurations – 0.355 involvements per million vehicle miles
These estimates were obtained using data from 2006 through 2013. Caution is advised is interpreting these numbers as a difference in crash rates due to several confounding factors:
- The study team was unable to obtain exposure estimates at a detailed functional class level as planned. This restricted the ability to produce rates consistent with the Scenario 5 and 6 vehicle configurations (i.e. triple-trailer configurations).
- Differences in the usage patterns of triple trailer and twin-trailer configurations are very likely to influence the crash estimates shown (e.g., the road types where the configurations were operated). In addition, the total exposure to risk for the two vehicle types is quite different: exposure for twin-trailer configurations exceeds 20 billion vehicle miles, while that for triple-trailer configurations is less than 100 million vehicle miles. The variability in crash frequency will also be higher, in general, for the vehicle class with lower exposure (i.e. triple-trailer configurations). This raises a question about whether the difference in the two rates is “statistically significant”; an issue which cannot be statistically tested given the nature of the data.
USDOT has decided that these two rates should be presented, but that they cannot be considered indicative of a difference in crash experience. At the same time, it should be noted that the fleet rates are in line with the rates produced for Idaho and the Kansas Turnpike.
Fleet Severity Analysis
While the level of detail for the fleet data hindered the study team’s ability to produce crash rates from the fleet data, there is an opportunity to compare the severity of crashes involving twin and triple combinations. The study team included data from line-haul crashes only (i.e., no pick-up and delivery events included). These data were obtained from carriers with crash involvement details including:
- Crash date
- Vehicle type (twin or triple combination)
- Crash severity which includes 4 fields:
- Number of fatalities on truck
- Number of fatalities in other vehicles
- Number of injuries in truck
- Number of injuries in other vehicles
- Type of collision
These data were compiled into three summary tables, one for injuries involving all involved vehicles and all crashes, a second involving injuries to truck occupants only, and the third for injuries involving occupants of other vehicles. The data are presented as follows in Tables 20, 21 and 22 using a structure similar to the severity analysis conducted with the State data. The same Fisher’s exact test was used in analyzing the differences between the pairs of distributions.
Table 20 involves injury severity for both truck and non-truck occupants for all Interstate crashes. The Fisher’s exact test failed to reject the null hypothesis. The conclusion of the test is that there is insufficient evidence to differentiate the severity distribution of twin-trailer and triple-trailer configurations considering all crashes in the data set.
Table 21 is similar to Table 20 except a crash is entered as an injury event only if the occupant of the truck was injured. The Fisher’s exact test again indicated no statistically significant difference in the severity distributions.
Table 22 involves the most severe injury severity for non-truck occupants in Interstate crashes where a twin-trailer or triple-trailer configurations and a non-truck were involved. Twin-trailer configurations appear to be involved in less severe crashes, and the statistical test indicated a significant difference at the p=0.02 level.
2.6 Summary of Crash Data Results
The above sections have described the different analyses conducted using crash data from both State DOTs and from carriers. Table 23 summarizes those findings by type of analysis within each Scenario.
Concerning all the analyses conducted and attempted, several concluding statements may be made. Note that all these findings are related to Interstate roads only. Recall, as previously described, a key component of constructing the exposure data was the data derived from FHWA’s Weigh-in-Motion (WIM) data base. This data was essential for conducting an assessment of crash information among trucks by type and various gross vehicle weight. The WIM data was predominately available for the Interstate System but was very limited for other National Highway System (NHS) roadways. This data coverage issue constrained the analysis to Interstate System roadways.
- It was not possible to conduct crash analyses based on involvement of vehicles by actual weight. These data were not available in any State crash records, nor were weight data for combination vehicles consistently available in fleet crash records.
- Given the lack of weight data, alternative methods applied to the State-level crash analysis used axle count, number of trailers, and the maximum allowable GVW to identify possible control and alternative truck configurations. A small number of States met these criteria and, among them, the maximum GVW for alternative configurations differed from the desired Scenario targets in some States. As noted in the first column of Table 23, the resulting crash rate and regression analyses for Scenario 2 are based on Washington data, the Scenario 3 analyses on Idaho and Michigan data, the Scenario 5 analysis on Idaho data and the Scenario 6 analyses on Kansas Turnpike data.
- In the three States where data could be analyzed, the crash involvement rate for the six-axle alternative configurations is consistently higher than the rate for the five-axle control vehicle. This consistency across States lends validity to this finding.
- As has been noted in other research, the use of rates based on truck crashes per truck VMT does not capture complete information since that truck-crash rate can vary based on changes in total AADT. In this study, this issue has been addressed using regression modeling. There was some indication in the regression modeling that the crash involvements of six-axle alternative configurations increase at a much faster rate with increase in exposure when compared to five-axle semitrailers. This needs to be further verified in future studies in other States.
- Comparisons of crash injury severity distributions for the six-axle with the five-axle semitrailer configurations showed some indication of reduced severity for six-axle configurations. The Washington data were unable to identify differences for the Scenario 2 distributions. The Idaho data for the Scenario 3, 97,000-lb. configuration indicated that the six-axle alternative truck involvements appear to be less severe than the five-axle involvements on rural Interstates, urban Interstates, and when urban and rural are combined. The Michigan data for the same Scenario indicated that the six-axle alternative truck involvements on rural Interstates appear to be less severe than five-axle involvements, but no differences in the distributions for the urban or combined situations.
- Based on Idaho data, the Scenario 5 crash involvement rates for triple-trailer combinations were lower than the rates for the control double configuration on both rural Interstates and rural and urban Interstates combined, and the differences were marginally significant. (See Table 9.) No differences were found in the crash involvement rates for the Scenario 6 triple-trailer configuration compared with the control double configuration based on the Kansas Turnpike data, even at the p=0.15 level of significance. (See Table 10.) In both cases, the small sample of triple-trailer configuration crashes makes drawing conclusions difficult.
- The results of the severity distribution analyses for triple-trailer and twin-trailer configurations were mixed. The Idaho Scenario 5, 105,500-lb. triple-trailer configurations appeared to be in somewhat less severe than the control double configuration. No differences were found in severity distributions for the triple trailer compared with the control double in the Scenario 6, 129,000-lb. Kansas Turnpike data. While the fleet data indicted no differences in severity distributions for twin-trailer and triple-trailer configurations both for all occupants and for truck occupants, there was a significant difference in the severity distributions of non-truck occupants, who experienced less severe injuries in crashes with twin-trailer configurations. Again, the small sample size of crashes for the triple-trailer configuration constrains the ability to form strong conclusions.
- Due to data issues primary related to either missing data or small samples of the alternative vehicles, planned analyses that could not be completed included the regression modeling for Idaho alternative configurations, the regression modeling for both Idaho and Kansas triple-trailer configurations, the route-based analysis, and the fleet crash rate analyses for the alternative configurations.
[2] When the over-dispersion parameter is estimated per unit length, the relationship between the variance (V) and the expected value (E) is as follows: V = E + E2k/L, where L is the length of a segment. Return to Footnote 2