Comprehensive Truck Size and Weight Limits Study - Highway Safety and Truck Crash Comparative Analysis Technical Report
Appendix A: Revised Desk Scan
Table of Contents
- Chapter 1. Introduction
- Chapter 2. Responses to Specific Requests by NAS Panel
- 2.1 Analysis Methods and Synthesis of State of Practice in Modeling Impacts
- 2.2 Identify Data Needs and Evaluation/Critique Available Data Sources
- 2.3 An Assessment of the Needs for Future Research, Data Collection and Evaluation
- 2.4 Synthesis of Quantitative Results of Past Studies
- 2.5 Additional Desk Scan Content
- Chapter 3. Comparison of Results between 2014 CTSW Study and Previously Published Truck Size And Weight Studies
- Chapter 4. Technical Linkage Between Desk Scan and Project Plans
- Chapter 5. References
- Appendix A. Summary of Additional Responses to NAS Peer Review Panel Issues
- Appendix B. Observational and Pilot Studies of Longer/Heavier Trucks
- Appendix C. International Experience
- Addendum. Truck Crashes Involving Barriers
CHAPTER 1 - Introduction
1.1 Purpose
This report presents a revised version of the Desk Scan (Subtask V.A.2) developed to support the Highway Safety and Truck Crash Comparative Analysis (Task V.A) of the 2014 Comprehensive Truck Size and Weight Limits Study (2014 CTSW Study). This revised Desk Scan addresses the recommendations made by the National Academy of Science (NAS) Peer Review Panel concerning the originally submitted version of this scan.
The purpose of the revised Desk Scan is to:
- Reorganize and enhance the original Desk Scan; and
- Add any additional, relevant content that may have been identified since the submission of the original Desk Scan.
Specifically, the NAS Peer Review Panel recommended that the original Desk Scan be reorganized to address four issues:
- Survey of analysis methods and a synthesis of the state of the art in modeling impacts
- Identification of data needs and a critique of available data sources
- Assessment of the current state of understanding of the impacts and needs for future research, data collection and evaluation
- Synthesis of quantitative results of past studies including reasonable ranges of values for impact estimates.
The purpose of this task is to summarize important studies that have explored the safety of different truck and trailer configurations of potential relevance to the 2014 CTSW Study currently underway. This report responds to comments received from the NAS Peer Review Panel on Truck Size and Weight, which reviewed and commented on an earlier version of this desk scan. As a result, this revised scan is structured based upon the FHWA contract. As part of the safety task, the revisions are organized around 3 technical areas; crash analysis; analysis of vehicle stability and control and analysis of inspection and violation data. Content for the scan included reviews of sources recommended through public input and list of safety resources recommended by the NAS Peer Review Panel. All relevant references and sources are included in this scan. The revised scan also responds to additional comments from the NAS Peer Review concerning safety related to the 2014 CTSW project.
The response of the safety team may be somewhat different than the other CTSW teams because the team membership changed completely after the initial desk scan was submitted. Minor revisions and additions were added as part of the submission of the project plan, so the response to the more detailed NAS Peer Review comments resulted in re-writing and reorganizing major sections of the scan.
In particular, an emphasis on analysis methods and data supporting the safety analyses conducted by the team. As such, the prior original scan has been edited to reduce much of the original material, provided by another contractor, dealing with regulatory and policy issues beyond the analysis and assessment of safety. As a result, detailed discussions of regulatory frameworks in Canada, Australia and Europe have been substantially revised and are in Appendix B and C of this report for those interested.
1.2 Historical Perspective of Size and Weight Policy Related to Safety
There have been a number of prior research studies addressing truck size and weight issues; they include:
- TRB study of the Turner Proposal (TRB, 1990b).
- Review of Truck Size and Weight Limits;
- The U.S. Department of Transportation (USDOT) Comprehensive Truck Size and Weight Study, 2000 (FHWA, 2000); and
- The Western Uniformity Scenario.
Former Federal Highway Administrator Francis Turner suggested a new approach to truck size and weight regulation in an address to the American Association of State Highway and Transportation Officials (AASHTO) in 1984. The Turner Proposal envisaged trucks with lower axle and axle group weights, on more axles than current vehicles, and with a greater allowable gross weight. AASHTO asked the Transportation Research Board to establish a committee to conduct a comprehensive study of the proposal, and advise states on its merits.
The committee designed a package of changes in size and weight limits, safety restrictions, and procedures pertaining to bridge deficiencies, routing, and enforcement as a means of implementing the Turner proposal (TRB, 1990b). The truck configurations considered by the study utilized a wide range of possible values for axle weights, length limits, and other vehicle characteristics to achieve the best performance in terms of productivity, pavement wear, bridge costs and safety.
A review of truck size and weight limits was initiated in the 1998 Transportation Equity Act for the 21st Century (TEA-21). It directed the Secretary of Transportation to request the Transportation Research Board (TRB) conduct a study of the regulation of weights, lengths and widths of commercial motor vehicles operating on Federal-aid highways to which Federal regulations apply, and to develop recommendations regarding any revisions to law and regulations that the Board determines appropriate (reference somewhere to 2000 study). Among the results of this study were that Federal truck size and weight regulations should facilitate safe and efficient freight transportation and interstate commerce, establish highway design parameters and help manage consumption of public infrastructure assets (FHWA, 2000).
The study recommended that Congress should create an independent public organization charged with observing and evaluating commercial motor vehicle performance and the effects of size and weight regulation, which the committee called the Commercial Traffic Effects Institute. Among other recommendations, the study suggested that safety requirements should be proposed by states, reviewed by the Commercial Traffic Effects Institute and approved by the Secretary.
The USDOT's Comprehensive Truck Size and Weight Study, 2000 (2000 CTSW) was not primarily focused on any policy initiative but more on development and testing of analytical tools to estimate potential diversion of traffic from one type of truck to another, or diversion between truck and rail, if truck size and weight limits were changed. Impacts of proposed size and weight changes considered to be most critical were: safety, productivity, infrastructure (pavements, bridges, and geometrics), traffic congestion, environment, and on railroads. Because safety was and continues to be a contentious issue in relation to increased truck size and weight limits, this study included an extensive review of past safety studies and developed a consensus of results. Therefore, the study used computer simulation tools to evaluate stability and control properties of different vehicle configurations at different weights and dimensions. The tools were intended to provide a measure of the relative safety compared to vehicles in widespread use.
The Western Uniformity Scenario was conducted at the request of the Western Governors' Association (USDOT, 2004). The study found several benefits from allowing more widespread use of LCVs. The benefits included a reduction in fuel consumption, emissions, and noise-related costs. The study included a comprehensive vehicle stability safety analysis using computer simulation and vehicle performance measures using the same methods as in the 2000 CTSW Study. The study recommended that, to the extent possible, the vehicles accepted would be at least as safe as vehicles on the road at the time and that the companies operating those vehicles should have excellent safety records.
The effect of large and heavy trucks on longitudinal roadside barriers was an issue raised during the 2014 CTSW Study by FHWA Subject Matter Experts (SMEs). Two specific references were reviewed: Gabauer, 2012 ND Knipling, et al., 2004). The data used in the Gabauer study, with the exception of LTCCS, did not contain sufficient details of LCVs to be of interest to the present study. The study provides some ideas of how to include barrier issues in future crash-related analyses for CTSW studies. The second reference conducted no analysis of crash, vehicle stability and control or inspection and violation data; the study focused on safety countermeasures for heavy truck crashes.
1.3 Review of Safety Literature Related to Analysis of Truck Size and Weight
This section focuses on past research on the effect of truck size and weight on roadway safety in North America. There have been two recent surveys of research on truck size and weight issues, including safety (AASHTO 2009; Carson 2011). These surveys reviewed most recent significant research and drew conclusions that are broadly similar to each other. The reviews, particularly the work by Carson, extended beyond the safety of heavy trucks to include significant research on infrastructure, pavement, highway geometrics, enforcement and related issues. These surveys report the findings of a broad array of studies of different aspects of larger and heavier trucks. Rather than repeat the work of these two reviews, the focus in this review will be on data and methodology, how the available data constrains the types of research questions that can be addressed, and the different methodologies that have been employed to address those questions.
1.3.1 Data Issues
A consistent theme of heavy truck research on size and weight issues has been the limitations of crash and exposure data. Most crash data systems are inadequate to identify longer or heavier trucks. No state crash data system includes the operating weight of trucks (or other vehicles) at the time of the crash. Nor do most include lengths of either individual units or combination lengths. A handful of states include some information on the number of axles on trucks, which can be a surrogate to identify trucks designed to carry heavier loads. Most states can distinguish straight trucks from tractor-trailer combinations and single-trailer units from double (or triple) trailer combinations, but cannot identify trucks operating at heavier weights or longer lengths, where heavier weights are considered to be greater than the 80,000 lbs. (Scopatz 2001). Other issues with developing a good analytical model are the biases that exist in some of the data that are available. Since truck weight data are, to a large extent, collected at weigh stations, the available weight data are likely to be biased toward the legal-weight carriers since overweight trucks are more likely to avoid weigh stations, using alternate routes (Taylor et al, 2000). One approach to address this bias is the use of Weigh-In-Motion (WIM) systems that unobtrusively collect vehicle count, weight and configuration data.
At the national level, the two primary Federal crash data sets are the Fatality Analysis Reporting System (FARS) and the General Estimates System (GES) files. FARS is a census file of all motor vehicles in fatal crashes, while GES is a nationally representative sample of police-reported crashes, so it includes both fatal and nonfatal crashes. Trucks are identified in each but details are lacking beyond basic configurations. Neither data set includes any data on weights or lengths nor even axle counts. (NCSA 2011; NHTSA 2011) The MCMIS (Motor Carrier Management Information Systems) includes crash, census, company, and inspection data. (Examples of some of the analysis done include those of Blower, 2004; Matteson, Blower, 2010; Matteson, 2005, available at: http://141.213.232.243/handle/2027.42/3138, http://141.213.232.243/handle/2027.42/21606, and http://deepblue.lib.umich.edu/bitstream/handle/2027.42/65062/102670.pdf?sequence=1.) Discussions with SMEs and within the safety team during analysis plan development indicated inconsistencies in the crash data within MCMIS (e.g. under-counting crashes; limited location information).
The Trucks Involved in Fatal Accidents (TIFA) crash data set from the University of Michigan Transportation Research Institute (UMTRI) is the only data set that includes detailed information about truck configuration that can address at least some of the gap. The data include power unit type, number of trailers, number of axles on each unit, and the types of connection between the units. For example, tractor-double trailer combinations are classified as using either A- or C-dollies or B-trains. Before 2005, TIFA also included the empty weights and lengths of each unit, cargo weight for each unit, and overall weight and length. At that time, TIFA had all the information needed to identify different truck configurations at the required level of detail. But TIFA data collection was stopped after the 2010 data year; hence, this resource is no longer available. In addition, TIFA was limited to fatal crashes only, and did not include exposure (mileage) information (Matteson, Pettis et al. 2007; Jarossi, Hershberger et al. 2012). Some believe that TIFA could be, in concept, an excellent supplement to broader more representative data sets such as state-level data.
Exposure data are equally, if not more problematic. The Federal Highway Administration (FHWA) Highway Statistics publication only distinguishes single unit trucks from combination vehicles, and provides registration and travel estimates by highway type and urban/rural (FHWA 2013). The Vehicle Inventory and Use Survey (VIUS) from the Bureau of Census used a survey of truck users to collect annual estimates of travel for different truck configurations, empty weight and typical gross weight, but the data did not disaggregate travel by road type. Moreover, the data series was discontinued in 2002 (Bureau of the Census 2002) (Campbell, Blower et al. 1996).
Other sources include state estimates from vehicle classification stations and weight-in-motion (WIM) stations. The vehicle classification stations classify vehicles by FHWA's 13-level classification. Trucks are classified as single-unit, one or multiple trailers, and by the number of axles. The WIM stations estimate gross weight. This information can be combined to develop estimates of truck travel for the FHWA truck classes and gross weight, but only for the locations where the stations are operating. This technique has been used in several recent studies (Abdel-Rahim, Berrio-Gonzales et al. 2006b; Montufar, Regehr et al. 2007; Regehr, Montufar et al. 2009). But there remains the problem of matching the VMT estimates derived from these sources to trucks in the crash data because of the lack of detailed configuration information in the crash data.
One older source of travel information is worth mentioning here despite its age, because it was the source of VMT data that was used in several of the influential studies that are discussed here. The National Truck Trip Information Survey (NTTIS) exposure database was compiled by the UMTRI. NTTIS was a survey complementary to the TIFA crash data set, and collected VMT data for configurations at the same level of detail as the TIFA crash data. The VMT data was collected for a sample of registered trucks by road type, time of day (day or night), and urban/rural. The combination of TIFA and NTTIS data allowed crash rates to be calculated by performance characteristics (Blower and Pettis 1988). NTTIS was operated only for one year (1987), and the TIFA data collection effort was discontinued as of the 2010 crash year.
There are specific crash-related factors for which either crash or exposure data will not exist. For example, while crash data include weather conditions, truck exposure data will not. A report by Rossetti and Johnsen (2011) focuses on the potential effect of climate change on commercial motor vehicle safety. The concern is developed in response to potential changes in climate that may pose an increase in crash risk to commercial motors carriers and other highway users.
Broadly speaking, there have been two approaches to evaluating the relationship of truck size and weight to safety. The first approach relies on identifying critical performance characteristics of heavier and longer trucks, such as rollover threshold, braking efficiency, and rearward amplification, and then comparing those parameters to the values for trucks in the existing fleet. The safety of proposed new configurations is then extrapolated from the existing fleet. The other thing to be noted about configurations is that it is not merely size or weight, but the interaction of the two. That is, a longer wheelbase may carry the same load as a truck with a shorter wheelbase, but the shorter wheelbase will create greater damage. That said, the longer wheelbase creates other safety related issues in terms of maneuvering and ability to see other road users. Relationships between crashes and operating parameters have been estimated in one study (Fancher and Campbell, 1995). The second approach relies on observational studies of the operations of trucks of interest in actual operations, insofar as they can be identified. The trucks are operated, often restricted to certain routes or road types, over a certain period of time and then the effect on safety is observed through analysis of crash frequencies and crash rates. Studies using both approaches are discussed.
1.3.2 Studies Focused on Vehicle Stability and Control (Performance Characteristics)
Two TRB reports are discussed first because they laid out the relevant handling and performance characteristics related to safety and provided a model for this approach. They are Special Report 225: Truck Weight Limits: Issues and Options, and Special Report 227: New Trucks for Greater Productivity and Less Road Wear (TRB 1990a; TRB 1990b). Special Report 225 was requested by the US Congress to assess proposals for changes in Federal weight limits, evaluating the impact on productivity, pavement, bridges, safety and operations, and enforcement. For the safety findings, the study largely relies on existing research and assesses the impact on safety in terms of how increases in size and weight would affect critical performance parameters including rollover threshold, rearward amplification, braking, steering sensitivity, low-speed offtracking and high-speed offtracking. Crash analysis used to evaluate the characteristics was based on crash rates calculated using TIFA and NTTIS data, because most of the performance measures can be estimated in those data. The study largely drew on work by Fancher et al., and Campbell et al. (Campbell, Blower et al. 1988; Fancher, Blower et al. 1989).
The second TRB report, New Trucks for Greater Productivity and Less Road Wear (TRB 1990b), applied this basic methodology to estimate the safety and other effects of several specific configurations with longer trailers and heavier loads than currently permitted. These are the so-called "Turner Trucks". The logic of Turner's proposal was to permit higher GVWs, carried on more axles to reduce individual axle loads. The argument is that lighter axle loads would reduce pavement wear and higher payloads would require fewer trucks to carry the same amount of cargo.
Since the truck configurations under consideration are not found in crash data, their safety cannot be assessed directly and was instead inferred from their performance characteristics. This was done by, comparing them to existing truck configurations for which there are some crash experience, and estimating crash rates. The study projected that the 9-axle, two 33-foot trailer, combination would have slightly lower crash involvement rates than current 5-axle, 28-foot trailer double combinations because of better braking efficiency, higher rollover threshold, and lower rearward amplification. However, the study cautions that these findings assume that components such as brakes are not downsized to take advantage of the lower axle loadings. If the components were downsized, some of the advantages of the Turner configurations would be reduced. The study also noted that some operational conflicts, such as during merging, changing lanes, and clearing intersections, would be increased by the greater overall lengths and lower engine horsepower-to-GVW ratios.
Finally, the study cautions that the conclusions are based on performance characteristics derived from simulation and controlled testing rather than operational experience, that the safety inferences are based on extrapolation from the population of existing truck configurations, and that there is statistical uncertainty in the crash rates of truck configurations currently in use.
Harkey et al. considered the performance characteristics of different types of LCVs, including Rocky Mountain double trailer combinations, turnpike double trailer combinations, and triples, in relation to highway geometric design (Harkey, Council et al. 1996). The goal of the study was to project how current design practices might be affected by these characteristics. The measures included offtracking, stability (rollover, trailer sway, and rearward amplification), braking and stopping distance, and speed and acceleration. No explicit performance analyses were conducted.
At about the same time, Fancher and Campbell identified and assessed the primary handling and stability characteristics of heavy vehicles, which directly affect their ability to maneuver safely in traffic. The focus of the work was only on physical characteristics, though the authors noted that "differences in operating environment can overshadow the influence of vehicle characteristics" (Fancher and Campbell 1995).
The paper reviewed the experience of twin-tank trailers in Michigan as showing that heavier vehicles can be designed to provide safety performance equivalent to other trucks. The twin-tank configurations used in Michigan were evaluated and redesigned to improve their stability. The point is to include safety - in terms of handling and stability - as explicit goals of policy. "Simply adding weight to existing vehicles is a poor idea, but new vehicles that are designed to carry more weight can well be safer than less productive, current vehicles."
The paper reviewed the following handling and stability characteristics: Offtracking in turns; rollover in turns related to radius of curvature and superelevation of the roadway; weight-to-power ratios to sustain speed on hills and merge safety; acceleration at intersections in relation to available sight-distance; braking in relation to available sight-distance; braking capacity on downgrades; and adequate sight-distance for passing. TIFA and NTTIS data were used to support the analysis.
1.3.2.1 Findings
- Rollover probability in a crash is inversely related to roll threshold, such that trucks with roll thresholds of about 0.4g are significantly more likely to rollover in a crash as trucks with roll thresholds of 0.6g.
- Rearward amplification, which is the ratio of the lateral acceleration of the last unit in a multi-unit combination to the lateral acceleration of the first unit, is directly related to rollover risk.
- Braking efficiency is defined as the ratio of maximum rate of deceleration achievable without wheel lockup, compared to the coefficient of road adhesion.
- Low-speed offtracking in principle is directly related to crash risk: as low-speed offtracking increases, crash rates would be expected to increase. However, it appears to have only a small effect on fatal crashes; it is more likely to show up in property damage crashes.
- Crash rates tend to increase with increases in GVW. The other characteristics discussed tend to be associated with changes in the rates of specific types of crashes, where the way the crashes occur is related to the performance characteristic. For example, low roll threshold is associated with higher rates of rollover, but not with higher crash rates overall. Weight is different and is associated with higher crash rates overall. Only tractor-semitrailers were analyzed for the report and the authors caution that this result cannot be extended to different vehicle configurations because they may have been designed to different handling and stability levels. That is, they may have been designed for a heavier weight without degrading characteristics below the existing fleet.
USDOT's 2000 CTSW Study that followed shortly thereafter took a similar approach in analyzing safety, with the safety discussion largely focused on the effect of the usual vehicle characteristics. Given the lack of adequate and appropriate crash and exposure data, the analysis drew on the results of engineering tests of performance measures of the vehicle combinations. Qualitatively, the study reported that GVW, weight distribution, and the center of gravity height all had negative effects on static and dynamic vehicle stability, braking and offtracking. The number of units in a combination had a negative effect on dynamic stability, braking and high-speed offtracking, but positive effects on low-speed offtracking. The number of axles, similar to the Harkey et al. finding above, had positive effects on vehicle stability, braking, and low- and high-speed offtracking (FHWA, 2000).
The Western Uniformity Scenario Analysis was undertaken by the USDOT as the 2000 CTSW Study was being completed. The Western Governors' Association requested an analysis of the consequence of lifting the existing freeze on LCV sizes and weights and allowing harmonized limits across 13 Western states (i.e., Colorado, Idaho, Kansas, Montana, Nebraska, Nevada, North Dakota, Oklahoma, Oregon, South Dakota, Utah, Washington, and Wyoming). Weights for LCVs would be limited only by the Federal bridge formula and limits to axle weights, resulting in a maximum GVW of 129,000 lb. The study used the same methods as the 2000 CTSW Study and relied on the same studies and data.
The study analyzed the performance of 17 configurations, including STAA double trailer combinations (two 28-foot trailers), tractor with a 53-foot semitrailer, turnpike double trailer combinations (two 45- or 48-foot trailers), several types of Rocky Mountain double trailer combinations defined by different combinations of cargo body type and connection type (A- or B-train), A-train and C-train conventional triples (28-foot trailers), and a tank truck-trailer. Some of the vehicles were in current operation in the West and others would potentially be permitted. The work focused on handling and stability properties of the vehicles. The study found that most of the LCVs currently in use had roll thresholds as good as or better than STAA double trailer combinations, as did most of the LCV configurations proposed. In terms of rearward amplification all but one of the current LCVs had better values than the STAA double, as did all of the scenario vehicles, except triples with A-dollies, which had by far the highest value at 2.72. Using C-dollies, which eliminates two points of articulation reduced the rearward amplification value to 1.66. Load transfer ratio, which is a measure of load transferred laterally in transient evasive maneuvers, was worse for two configurations in current operations: STAA double trailer combinations and triples using A-dollies. All other configurations, both LCVs currently in use in the West and proposed scenario vehicles, had better load transfer ratios.
Only limited crash and exposure data analysis was undertaken, comparing crash rates for single-trailer versus multi-trailer trucks by road type. The study relied on FARS data and FHWA estimates for travel, and so was unable to disaggregate different current or proposed LCV types. Although the data were unable to resolve any of the specific combination types, the authors emphasized the influence of road type-crash rates on non-limited access roads were estimated to be two to three times higher than limited access-and by extension operating environment.
1.3.3 Studies of Crash Analysis of Configurations
The following is a summary of truck crash analyses that included elements of truck configuration. Most do not consider LCVs, but are included as examples of methodologies that may be modified to include CTSW-type configurations.
Campbell et al. (1988) used the TIFA and NTTIS data to calculate crash rates for fatal accidents by truck configuration, operating environment (road type and time of day), and GCW. The study was not an evaluation of LCVs or an evaluation of trucks configured to operate beyond current limits, but instead to establish fatal crash rates for common configurations and to determine the effect of different dimensions of operating conditions. Estimated fatal crash rates vary by a factor of three to a factor of five depending on the type of road and time of day. In addition, it was noted that different truck configurations have different patterns of travel across road types, making simple comparisons of crash rates between configurations misleading. Adjusting rates to remove the influence of these different travel patterns, the study reported that fatal crash rates for double trailer combinations (primarily STAA double trailer combinations) are about 10% higher than tractor-semitrailers. Rates for bobtail tractors, however, were over twice as high, while straight trucks as a whole had adjusted fatal crash rates about 10% lower than tractor semitrailers. The study also noted an increase in fatal crash rates at higher GCWs. Because of data limitations, only gross weights up to 80,000 lb. were considered; the adjusted rate for the 65-80,000 lb. GCW group was about 40% higher than the 50-65,000 lb. GCW group. This implies that van tractor-semitrailers loaded to 65-80,000 lb. would have a 1.42 times higher rate than all tractor-semitrailers if they had the same distribution of travel (Campbell, Blower et al. 1988).
Blower et al. (1993) used crash and VMT data to develop a log-linear model to predict crash rates using truck configuration, road type, time of day, and urban/rural location as predictor variables. Crash data from Michigan were used, along with VMT data from a survey of truck-tractor operations. In the statistical model, there was no statistically significant difference in crash rates between tractor-semitrailers and double trailer combinations. The type of road had the largest effect on crash rates, with non-limited access roads having crash rates 6.8 times higher than limited access. Crash rates for double trailer combinations were about 10% higher than tractor semitrailers, but the difference was not statistically significant. GVW was not part of the data, so the effect of weight was not examined (Blower, Campbell et al. 1993).
Using a case/control methodology, Braver et al. compared the crash risk of tractor semitrailers and double trailer combinations in Indiana. Cases were crash-involved tractor semitrailers and double trailer combinations and the controls were tractor combinations that passed the case crash sites one to four weeks after the crashes, at the same time and on the same day of the week. Both cases and controls were limited to interstate highway locations. LCVs were not distinguished in the crash population, but the authors state that most double trailer combinations were likely to be STAA double trailer combinations. The study found no difference in crash risk between tractor semitrailers and double trailer combinations. However, drivers of double trailer combinations in the crash population on average were older than tractor semitrailers drivers, and double trailer combinations tended to be operated in larger fleets. Data on drivers and companies was not collected for the controls so the effect of these potentially confounding factors could not be determined. The study also found higher crash risk for double trailer combinations on ice and snow, which may be related to handling properties (Braver, Zador et al. 1997).
Jovanis et al. used fleet data to compare crash rates for tractor semitrailers and double trailer combinations. This study is one of the few that used operational data from fleets, which has the advantage of controlling for differences in fleet operations. The study used randomly selected origin-destination terminal pairs for a national less-than-truckload (LTL) operation. Both tractor semitrailers and double trailer combinations operated over the same roads at approximately the same times, controlling for road type, though the road types were all ones that had been approved for double trailer combinations operations. The study reported that accident rates for double trailer combinations were somewhat lower than tractor semitrailers on every road type and that the differences, though small in some cases, were statistically significant (Jovanis, Chang et al. 1989).
Forkenbrock and Hanley compared crash conditions for single and multi-trailer trucks and concluded that multi-trailer truck crashes were more likely to occur on high speed roads than tractor semitrailers, more likely to involve two or more other vehicles and more likely to occur in conditions of darkness and on low friction roads, than single-trailer truck crashes. The analysis was performed using UMTRI's TIFA fatal crash data (Forkenbrock and Hanley 2003).
Hanley and Forkenbrock also developed a model of the effect of LCV length on the safety of other vehicles passing LCVs on two-lane highways. Policy and economic factors may direct LCVs to interstate-quality roads, but there will be a need for "reasonable access" in order to use the interstates. This will require some travel on lesser-quality roads, likely including two-lane highways. Hanley developed stochastic (probabilistic) models of passing that account for differences in performance between LCVs (impeding vehicle) and light vehicles (overtaking vehicle); driver aggressiveness; traffic volume and spacing of oncoming vehicles, lengths of the impeding vehicles, and speeds of the impeding vehicles. They found that as impeding vehicle length increases, odds of failure to pass increase. Odds of failing to pass a 120-foot long LCV are 2-6 times a 65-foot long truck. (Hanley and Forkenbrock 2005)
Lemp, et al. (2011) identified factors contributing to crash severity in large truck crashes using the Large Truck Crash Causation (LTCCS) and GES crash data, using the Bureau of Census's Vehicle Inventory and Use Survey (VIUS) to measure exposure. The LTCCS data were used to develop statistical models of the factors increasing crash severity. Crashes were more likely to include a fatality in dark or low-light conditions and when the roadway was snowy or icy. The number of trailers was directly related to the probability of a fatality (more trailers increases the chance of a fatality in a crash), but somewhat paradoxically overall truck length and higher gross vehicle weight rating were associated with lower probability of fatality. This result is interpreted as meaning single-trailer trucks have a lower probability of fatality, bobtail tractors have the highest, and single unit trucks and two-trailer LCVs and non-LCVs are in between. The authors caution that "[i]f truck length and/or GVWR increase past the levels common in the LTCCS sample, the model's estimates may not be valid." Thus on a per mile basis, estimated crash costs are about the same in these data, for tractor-semitrailers and double trailer combinations (Lemp, Kockelman et al. 2011). While findings suggest that fatality likelihood for two-trailer LCVs is higher than that of single-trailer non-LCVs and other trucks, controlling for exposure risk suggests that total crash costs of LCVs are lower (per vehicle-mile traveled) than those of other trucks. Because this study primarily focused on analysis of crash severity, given a crash, it is not considered for more detail comparisons later in the scan.
CHAPTER 2 - Responses to Specific Requests by NAS Panel
Based on the more general review described in the previous sections, this section contains responses to specific requests made by the NAS Peer Review Panel.
2.1 Analysis Methods and Synthesis of State of Practice in Modeling Impacts
Blower, D., K.L. Campbell and P.E. Green (1993), Accident rates for Heavy Truck-Tractors in Michigan, Accident Analysis and Prevention, 25(3), 307-321
This study used crash data from the state of Michigan and exposure data collected through a targeted survey. Both crash and surveys were for Michigan-registered tractors only. Factors considered (in addition to three truck types) were road type, time of day, area type (rural urban) and crash severity. The method was also applied to national-level crash and exposure data (Campbell, Blower, Gattis, and Wolfe 1988).
Interestingly, a footnote in the paper indicates that additional information not used in the paper included weights and lengths of all units, cargo body type, cargo weight at every point along the route, driver age and company type. So the method has the potential to overcome some of the major challenges posed over the years in size and weight studies: measurement of weights of vehicles in both the crash and exposure database. In a contemporary setting, it is possible that at least some of the data may be obtained from GPS-type devices, reducing the cost of data collection.
A log-linear model formulation using an underlying Poisson distribution was used to model the crash frequency with an assumed coefficient of 1.0 used for the exposure data (i.e. vehicle miles) to produce an effective crash rate. While more contemporary methods assume an underlying negative binomial distribution, the paper is among the earliest to assume a count distribution of the modeling of crash frequency.
Differences in the crash rates between single and double trailer combinations were not found to be statistically different; bobtails had a significantly higher crash rate than either single or double trailer truck-tractors.
The study is important because it demonstrates a novel method for explicitly linking state-level crash and exposure data using tractor registrations. A similar study was also completed using national-scale tractor information. The ability to integrate targeted crashes and match them to randomly obtained exposure (including vehicle and driver attributes) is a potentially powerful capability that has not been utilized since this research was concluded. There are some similarities between this method and the basic case-control method to be described in another reference.
Jovanis, P., et al., (1989). "Comparison of Accident Rates for Two Truck Configurations." Transportation Research Record 1249
The study used matched pairs of roads in which both double trailer combinations (twins) and single combination vehicles were operated. All crashes experienced by a single firm operating less-than-truckload operations over regular routes were used in the analysis; not just DOT-reportable crashes. Double trailer combinations were found to have significantly lower crash rates than tractor semitrailers, though the differences were small. The precision obtained using company data allowed a tight comparison of both vehicle types operating over the same routes. The tradeoff is the limitation of broader generality. It is unlikely that this method can be applied to many LCV analyses, particularly triples comparisons, because where triples are allowed, firms have indicated that they dominate vehicle usage. In other words, one cannot conduct a paired-comparison test for triples because the second vehicle type, double trailer combinations, would have very low exposure on the same routes and thus very low crash frequency. This was borne out in the safety team's interactions with carriers on this study.
Braver, E. R., P. L. Zador, et al. (1997) "Tractor-trailer crashes in Indiana: A case-control study of the role of truck configuration." Accident Analysis & Prevention 29(1): 79-96
A case-control formulation is used in which the cases are crashes involving single or double combinations and controls are a random sample of similar vehicles passing the crash site at the same time and day of the week. Data could not be disaggregated to the level of LCVs. The findings were that the crash odds of the two configurations were undistinguishable. The authors point out that older, more experienced drivers are more likely to operate double trailer combinations, likely contributing to a reduction in their crash rates.
Another study (Stein and Jones, 1988) also sought to compare the crash rates of alternative configurations using the case-control formulation. Unfortunately, serious questions were raised about the measurement of exposure, invalidating the study, despite its publication in a peer- reviewed journal. A follow-up study (Jones and Stein, 1989) linked crash rates and vehicle defects, further illustrating the utility of the case-control method.
The case-control method is widely used in epidemiology and has been used in several road safety analyses of which these are examples. While this study was unable to identify LCVs, there is no reason why a study cannot be designed with LCV safety as a goal. One of the advantages of the case-control method is its flexibility and ability to identify rare crash events (cases), which are then compared to non-crash events as controls.
Regehr, J. D., J. Montufar, et al. (2009). "Safety performance of longer combination vehicles relative to other articulated trucks." Canadian Journal of Civil Engineering 36(1): 10
The study developed exposure measures using vehicle count data on roadway segments, distributions of gross weight from WIM stations, a survey of vehicle length on one stretch of highway for one year, vehicle classification counts at selected stations, and a roadside survey of fleet mix data. These data were used to develop estimates of VKT (vehicle kilometers of travel) for routes on which LCVs were permitted to operate. Configurations considered in the analysis include straight trucks, tractor-semitrailers, "legal-length" double trailer combinations (STAA double trailer combinations), Rocky Mountain double trailer combinations, turnpike double trailer combinations, and triples. Alberta has among the most stringent driver, carrier, and vehicle regulations on LCVs in the CANAMEX corridor (Canada, US and Mexico). The conclusion stated, "The relatively superior safety performance of LCVs in Alberta may result in part from the stringent conditions placed on their operations through the design and enforcement of special permits. Principal along these is the requirement for experienced, specially-qualified driver for LCV movements" (Regehr, Montufar et al. 2009). LCVs had lower crash rates than other trucks, but this finding cannot be extrapolated to U.S. conditions. As a result of the differences in operating requirements and conditions, the results of this study are not compared to U.S.-based research.
Abdel-Rahim, A., S. G. Berrio-Gonzales, et al., (2006a), Classification of Longer Combination Vehicles Using Weigh-in-Motion Data, Final Report Part A, University of Idaho. , National Institute for Advanced Transportation Technology
Abdel-Rahim, A., S. G. Berrio-Gonzales, et al., (2006b). Longer Combinations Vehicles: A Comparative Crash Rate Analysis, Final Report Part B, University of Idaho. , National Institute for Advanced Transportation Technology
These reports were part of a coordinated study. The first report describes the method for integrating Weigh-in-Motion (WIM) data with VMT counts. Since it involves data modeling for exposure, it is not reviewed here. The crash analysis is similar to what was attempted in the 2014 CTSW state -level crash data are used to compare different vehicle configurations. Conclusions could only be reached for double trailer combinations and single combinations due to a lack of sufficient crash data for LCVs. No differences were found between the two configurations.
2.2 Identify Data Needs and Evaluation/Critique Available Data Sources
A conclusion of many safety studies LCVs is that crash-based studies of truck size and weight using U.S. data are very difficult to conduct successfully. Vehicle stability and control analysis is not subject to the same constraints as crash analysis. There have been several successful tests using this technique, so there are no urgent data needs in this area. Analysis of violation and enforcement data are constrained by a variety of data difficulties, so the existing databases are further discussed in this section of the desk scan. Much of the discussion in this section on crash analysis is drawn from material prepared by Dr. Forrest Council as part of the safety project team technical report.
2.2.1 Crash and Other Data Supporting Crash Analysis
Safety components of truck size and weight studies are likely to continue to have difficulties if the studies are based on the primary data sources in existence today - state crash files, state roadway inventory data, state AADT data and additional data on VMT for specific truck configurations. Crash data supplied by fleets were little better; as discussed in the scan the primary variable of interest - the weight of the LCV configuration involved in the crash, is consistently unavailable. WIM data was insufficient to use for detailed route-level travel needed for enhanced crash analysis using contemporary methods.
The issues found in this study are not new and will continue to be encountered unless changes are made in these primary databases. While existing roadway inventory and AADT data will likely be sufficient for use in future studies, major improvements are needed in crash data and VMT data for specific truck configurations.
Crash data need to include precise information about the configuration and weight of trucks involved in crashes. It is difficult to develop a recommendation in this area that provides the level of detail necessary and can be implemented using existing crash data collection methods. While it may not be possible to have the investigating police officer report the actual GVW on crash report forms since the truck operator does not possess that information, it should be possible, as a minimum, for the investigating officer to accurately report a count of trailers, a count of total axles, and the length of each trailer for combination vehicles involved in crashes. Most state crash forms now include a count of trailers, but far fewer have an axle count variable and almost none have information on trailer length. Consideration should also be given to including an axle count variable and three trailer length variables in the next edition of the Model Minimum Uniform Crash Criteria guidance document (MMUCC, 2012). Another option is to enhance MCMIS data to better and more consistently record the date, time and location of reported crashes. FMCSA, or a contractor, could then follow-up with the carrier to seek information about combination weight.
The single source of state and national truck VMT information for the specific configurations of interest in this 2014 CTSW Study is the WIM data described earlier. The number of current WIM data collection points is so limited that the needed VMT estimates could only be provided at the state functional class level. Even the VMT estimates for rural and urban Interstates for individual states were often based on a very limited number of WIM stations within each roadway classifications. In addition, they could not be used to estimate VMT for a specific configuration (e.g., heavy triples) on a given route. The ability to extrapolate WIM estimates to specific routes would be very important in future attempts to model target truck crashes on non-Interstate roads or to better model truck crashes on Interstate routes such that the effect of AADT changes on truck crashes per mile driven can be more accurate defined. Consideration should be given to increasing the number of WIM collection points.
2.2.2 Analysis of Vehicle Stability and Control
There are no data-related recommendations in this safety technical area. Data are generated within the simulation models so they are collected within a particular model. Modeling and analysis using vehicle simulation are and have been accepted with little discussion or critique.
2.2.3 Analysis of Inspection and Violations
The data used to support the inspection and violations analysis included the selection of the gross vehicle weight variable from the MCMIS database. Discussions with FMCSA indicated that this variable is not always available in the file as a measured weight, but that no better variable exists in MCMIS for description of combination vehicle weight. Mechanisms to improve accurate completion of the variable should include use of weights from scales wherever possible and, if not, assembly of data from on-board the truck to provide an estimate. Additional training of field personnel is likely to be needed to implement this concept within the existing data collection schemes.
2.2.4 Concluding Comment
The above changes would not need to be nationwide. These changes could be limited to states that are allowing operation of the above-limit configurations, and more specifically, to the states which have the highest current VMTs for the configurations of interest (e.g., target axle count and WIM changes to states with the highest use of alternative configuration trucks). Without enhancements to existing safety-related data systems, future studies will continue to experience difficulties in quantifying the safety implications of alternative truck size and weight policies.
2.3 An Assessment of the Needs for Future Research, Data Collection and Evaluation
The area that created the greatest challenge in conducting the safety analysis for the 2014 CTSW Study was the lack of relevant data: crash data and comparable or corresponding travel exposure data. Considering road safety management as a whole, there has been consistent and strong emphasis on providing quality crash data, with complete reporting of data elements, accurately obtained in the field. There has been no comparable effort to improve the quality of truck weight and configuration information within safety-related databases. This problem is not under-reporting of crashes, but a lack of detail about crashes that can be used to connect outcomes to CTSW-type configurations, including weight.
Over the last 10 or more years, there have been tremendous advances in road safety analysis methods; particularly those targeted to the management of road infrastructure investments (e.g. AASHTO, Highway Safety Manual, 2010). Millions of dollars were spent to improve the methods used to identify safety problems, evaluate potential countermeasures and build a scientific basis for future safety investments by properly evaluating the effectiveness of the actions.
In reading the truck size and weight safety literature, there is no comparable comprehensive development of an integrated analysis framework specifically addressing all the nuances of truck size and weight. As a result, needed data are missing, the most important of which is the weight of vehicles involved in crashes. In virtually every study attempting to address the safety of longer and heavier vehicles, there is a recommendation to provide better crash data, particularly including the weight of involved trucks. It is fair to say that there has been no progress in this regard, despite the literature that includes two TRB policy studies (Special Reports 225 and 267 dating back to 1990). So while the road safety management community has been systematically organizing both data and analysis methods to address current and future road safety needs, the truck size and weight research effort has been relatively ineffective.
2.3.1 Alternative 1: UMTRI Survey-based Approach
Interestingly, researchers at UMTRI broke new ground in their state and national scale studies using TIFA and survey-based exposure (e.g. the national Truck Trip Information Survey or NTTIS) in a series of papers and reports (e.g. Campbell, et al., 1988; Blower et al., 1993). They had to undertake a laborious process for exposure data collection involving telephone contact and much manual coding. Now the basic trip-based information of origin, destination, time of travel, distance and others (perhaps weight) are available through on-board GPS units designed for trucks. Even if these are not available, it may be feasible to attach non-company GPS to track some CTSW configuration travel. One could use the basic framework developed and tested by UMTRI using fatality data and seek to apply it using new technology to a broader set of crashes. There are many details to be discussed, but such a system operating over multiple years has the potential to provide adequate exposure data at a high level of precision, while details are decided about the crash data. This combination of targeted crash data and survey/GPS-based exposure data over multiple years has the potential to address many of the fundamental crash analysis problems in CTSW. In fact, such a system could obviate many of the data-related difficulties outlined in response to Task 2.1 b. The idea is to plan ahead, working proactively with carriers and state DOTs as back up, over multiple years, not relying on retrospective crash and exposure data acquisition.
2.3.2 Alternative 2: Case-Control Formulation
There is another alternative to the computation of simple crash rates: structure an analysis plan that utilizes a case-control framework. This technique is used extensively in epidemiological studies and has been used increasingly in road safety. Several studies by IIHS used case-control applied to large trucks (Braver, et al., 1997; Stein and Jones, 1988; Jones and Stein, 1989). Truck driver fatigue has been studied using the method for over 20 years (e.g. Lin et al., 1993; Kaneko and Jovanis, 1992). More recently there have been studies applying the method to studies of the effectiveness of road safety countermeasures (e.g. Jovanis and Gross, 2007; Gross et al., 2009).
One advantage of this method is that it works well when the event of interest is unusually scarce (even among scarce crashes themselves). The driver fatigue research allowed the research team to assemble crash data (the cases) from firms and then use them to identify controls among non-crash trips. A similar approach can be used here: crashes involving LCVs can be the cases; other non-LCV travel can be the controls. Obviously more detail is needed; this approach was considered in the current study but abandoned because it did not fit well with the computation of crash rates used in the analysis. Case-control methods provide a measure of the relative safety of one entity compared to another; they cannot provide and absolute level of crash risk. What would be helpful is to start from scratch and develop a data collection structure that removes constraints and explores a range of possibilities.
2.3.3 Summary
A longer-term future-looking perspective argues that it is not enough to say we need better crash data and better exposure data that include samples of exposure from the configurations of interest. There is a need for a complete fresh look at the safety analysis issues in a way that takes advantage of the many methods developed in the last 10 years along with new technologies for data collection such as GPS and other on-board devices. An essential element of such a perspective is to not wait until 2-3 years before the next report is due to start to look for data. There is a need to begin carefully framing the safety data needs, and verify that a collection system is in place to assemble the needed data over a 5-8 year time period.
In studies of the safety implications of truck size and weight we need analysis methods that yield outputs that are responsive to persistent truck size and weight challenges. Among these are the questions about the safety consequences of increased construction brought about by the need to alter the road infrastructure (including bridges, pavements and road geometric elements) in response to truck weight and configuration changes. An increase in construction zone frequency was a topic raised in the TRB Panel Report and in our discussions with the panel. It could not be addressed in the current framework but is important enough to be included in future CTSW planning. Barrier implications have also been consistently raised; weather-related effects are another issue being studied in other safety and operational contexts but for which there are few studies in the truck literature. Each of these issues should be considered as an element of a more comprehensive safety analysis program, well in advance of the next Congressional mandate.
2.4 Synthesis of Quantitative Results of Past Studies
Table 1 synthesizes the results of previous studies. The quantitative comparisons are made, but all involve double combinations of some types to single combinations of some types. In most cases the researchers were unable to separate what type of double was being used and the number of axles on the single as well. The Jovanis research showed double trailer combinations had lower crash rates than tractor semitrailers, while the Campbell team found the opposite. The remaining studies were unable to find a difference between these basic configurations. The results in this table clearly support the recommendations for alternative data collection plans leading to new data analysis designs.
| Study | Crash Data Source | Exposure Source | Summary | Comments |
|---|---|---|---|---|
| Jovanis, et al., 1989* | Fleet records; all crashes | Fleet dispatches for routes with both twins and 3-S2 operations | Double trailer combinations had lower crash rates than tractor semitrailers on matched pairs of roads | Data from one carrier; all crashes |
| Cambell et al., 1988** | TIFA (1980-84) | NTTIS (1985) | Single combinations higer fatal crash rate on urban interstates; multitrailer on rural interstates; multitrailer higher overall | From Western Uniformity Study Table VII-7, Page VII-17 |
| Abdel-Rahim et al., 2013 | Utah (1999-2004) | FHWA and WIM | No difference found in comparisons of single and double combinations; limited sample size of LCVs | Only computed crash rate per year all facilities; no route type breakdown |
| Idaho (2003-05) | FHWA and WIM | No difference found in comparisons of single and double combinations; limited sample size of LCVs | Only computed crash rate per year all facilities; no route type breakdown | |
| Western Uniformity Scenario Analysis 2005 | 13 Western Uniformity | FHWA | Unable to differentiate involvment rates of single and double combinations | Used approach roughly similar to 2014 CTSW Study but without detailed attempt at scenario comparisons |
** Computed fatal involvement rates per 100 million vehicle miles Return to footnote ** in table
2.5 Additional Desk Scan Content
The safety team has reviewed the suggested data sources supplied by USDOT SMEs and other reviewers; input from those attending outreach efforts related to the 2014 CTSW Study program were also reviewed. Finally, fresh literature searches were conducted to identify new methodologies.
Sowards, K., E. Eastman, J. Matthews and E. Pennington, (2013), "An Analysis of Truck Size and Weight: Phase I - Safety," Multimodal Transportation & Infrastructure Consortium, Marshall University
The authors use fatal crash data from 2005-09 contained in the Trucks Involved in Fatal Accidents (TIFA) data set along with exposure data (vehicle miles traveled or VMT) from the Federal Highway Administration (FHWA). Crash rates are computed and compared for multi-trailer and single-trailer truck configurations. No substantive description is provided of the method used to calculate crash rates. Multi-trailer rates include the many versions of double trailer combinations, combined. The authors state in several places that they cannot assess weight-related safety effects because they are not available in TIFA. They do calculate and compare fatal crash rates of single and double trailer trucks and find double trailer combinations have an 11% higher fatal crash involvement rate. There are several places in the executive summary and the text where the writing style seems less than objective and scientific.
The authors find that tractor semitrailers with 6 axles have a fatal crash rate that is 867% higher than for all single trailer trucks. This finding is difficult to believe, as such poor safety performance would likely result in much lower usage by firms and drivers. Additional shortcomings of this study were identified in a review of the research conducted by Dan Blower of UMTRI (see next review).
Blower, D, Evaluation of "An Analysis of Truck Size and Weight: Phase I - Safety," from the
Multimodal Transportation & Infrastructure Consortium, undated.
Dr. Dan Blower conducted an independent (i.e. non-UMTRI sponsored) review of the report by Sowards. This was a very detailed review as Blower had access to and was very familiar with the TIFA data used for crash analysis and was familiar with the methods applied by Sowards in the crash analysis. Blower conducted several analyses including trying to replicate data contained in several of the tables in the Sowers report. Blower was unable to replicate the data commenting that the most likely reason was confusion on the part of the Sowers team concerning the use of crash and vehicle involvement in a crash. The errors include misleading and incorrect table headings and miscounting of fatalities. As a result, Blower concludes that the study has numerous errors sufficient to make it unreliable as a source of crash rate information. As a result, this Desk Scan does not use the results of the Sowers study in our comparisons of crash rates in Chapter 3.
Cantor, D.E., Ethan Osborn, Prabhjot Singh (2014), A Firm Size and Safety Performance Profile of the U.S. Motor Carrier Industry, Institute for Transportation, Iowa State University, Ames, Iowa.
The purpose of this study was to present a profile of the relationship between firm size and safety performance for firms in the U.S. motor carrier industry. The study uses data from MCMIS and CSA databases obtained from Volpe Transportation Center for 2010. The data include information collected from the following comprehensive data sets: (1) commercial vehicle crash data, reported by states to FMCSA; (2) data collected from individual compliance reviews; (3) data from roadside inspections including violations; (4) data from closed enforcement cases; and (5) MCMIS Census File data on individual carriers, including their type of operations and fleet size.
The study is interesting as a methodology, but does not differentiate findings by vehicle configuration or weight. It also does not attempt to use more contemporary safety performance analysis methods (e.g. AASHTO, Highway Safety Manual, 2010). The study treats the dependent variables as if they are continuous while the basic crash data are counts.
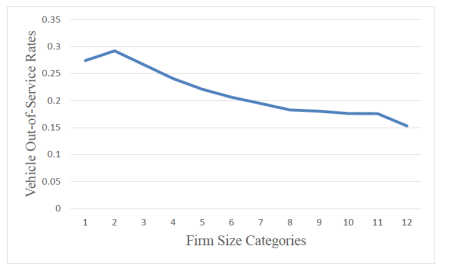
Using simple computed rates (defined as number of violations divided by number of inspections) the study shows that both driver and vehicle out-of-service rates decline with firm size (firm size defined as number of power units) in Figure 1. This is illustrated in the figures below, using the figure number from the report. It should be noted that there is a correlation between firm size and the number of power units. Therefore the development of graphs, such as in the figures below, adjust for scale of operations twice: both in the vertical and horizontal axes. Contemporary safety methods use frequency on the vertical scale and use as a basic predictor the exposure to risk on the horizontal scale (AASHTO, Highway Safety Manual, 2010).
Figure 1: Firm Size and Driver Out-of-Service Rates
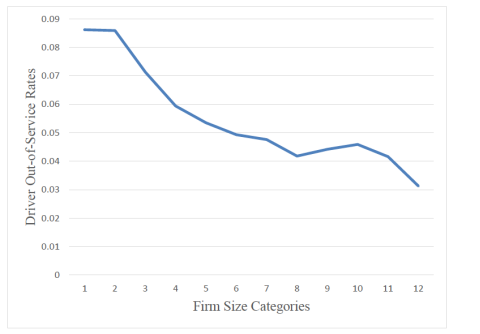
Figure 2: Firm Size and Vehicle Out-of-Service Rates
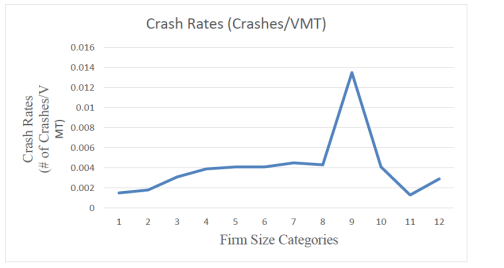
Additional analyses include crash rates, computed as crashes per power unit and per annual vehicle miles travelled. Both relationships show an upward trend, though the second has a peculiar peak for firm size 9 (see figures labeled Figure 3 and 4 following).
Figure 3: Firm Size and Crash Rates by Power Units
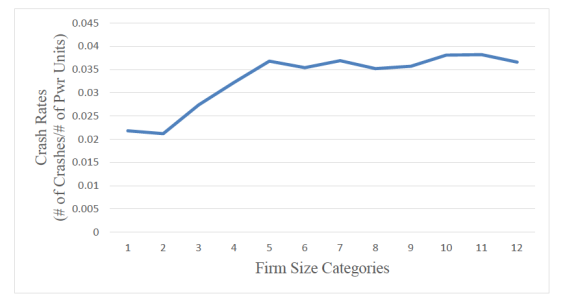
Figure 4: Firm Size and Crash Rates by Annual VMT
Additional crash-related information is obtained from the FMCSA BASIC program, and shows a trend of a decreasing crash indicator with firm size (see figure labeled Figure 5 below). This is the opposite of the findings from crash data directly. The authors leave an explanation of the difference to future research.
Figure 5: Firm Size and Crash Measure
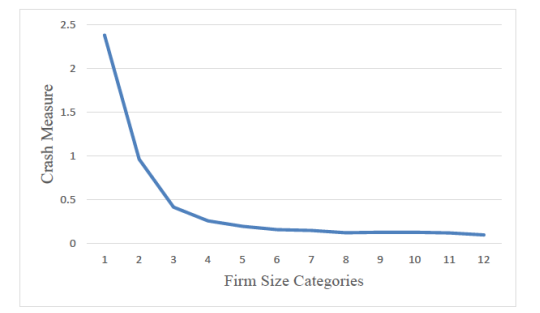
While there are inconsistencies and methodological questions about the study, it is of interest because of its use of existing FMCSA databases. There are also implications for Inspection and Violations analysis joined with the crash analysis.
Segev, Eran; Meltzer, Neil, (2015), FMCSA Safety Program Effectiveness Measurement: Carrier Intervention Effectiveness Model, Version 1.0, Volpe Transportation Systems Center.
The Federal Motor Carrier Safety Administration (FMCSA), in cooperation with the John A. Volpe National Transportation Systems Center (Volpe), developed a quantitative model to measure the effectiveness of motor carrier interventions in terms of estimated crashes avoided, injuries prevented, and lives saved. The model is known as the Carrier Intervention Effectiveness Model (CIEM).
As described in the report, the model computes carrier crash rates, defined as crashes per carrier power unit (PU), for carriers receiving interventions, distinguishing between crash rates for defined periods prior to and following the interventions. Power units are used as the unit of exposure and a control group is used to adjust for exogenous changes in factors influencing crashes and other dependent variables. Carriers are further differentiated by size of operation.
While the model is focused on enforcement interventions and their estimated effectiveness, it illustrates a new approach to the problem using crash data that includes a control group of carriers that did not receive interventions. Method is to be used on an annual basis.
The model does not focus on or identify large trucks or trucks by weight but shows an interest in more in-depth evaluation methods by FMCSA. The report uses a number of FMCSA data sources to derive a relationship between carrier interventions and changes in crashes. The crash frequency changes are in turn used to estimate injuries prevented and lives saved. The report mentions that the motivation is in response to internal U.S. government requirements for program evaluation, not necessarily improved road safety.
2.5.1 Vehicle Stability and Control Analysis
Elsasser, D., and F. S. Barickman, (2013), Tractor Semitrailer Stability Objective Performance Test Research - Yaw Stability, NHTSA, East Liberty Ohio
A series of test track maneuvers were developed and implemented to represent lane-change, obstacle avoidance, and negotiating-a-curve crash scenarios. The goal was to use the tests to support a program of testing heavy-vehicle stability control systems. While not directly related to the use of vehicle simulation tests of particular heavy-vehicle configurations, the report provides additional background on USDOT programs in the area.
2.5.2 Analysis of Inspection and Violations
Hyeonshic S, S Bapna, R Buddharaju, (20140, Maryland Motor Carrier Program Performance
Enhancement Research Report, Morgan State University, for Maryland State Highway Administration
This report examines the effectiveness of the roadside inspection program in terms of the allocation of the limited resources using Research Reporting as a metric for the change in the number of truck violations over the years. The authors find that violations per inspection are dropping and conclude that the Maryland program is effective.
Karim, M. R., A. S. Abdullah, H. Yamanaka, A. Sharizli, and R. Ramli, (2013), Degree of vehicle overloading and its implication on road safety in developing countries, Civil and Environmental Research, Vol.3, No.12
The main purpose of this study is to understand and establish the extent to which vehicle overloading is happening in a developing country like Malaysia. This study used traffic data collected between Oct 2009 and Jan 2010 at a weigh station operated by the Malaysian Road Transport Department on Federal Route 54. Traffic data including the gross vehicle weight (GVW) were obtained. A series of summarized statistics, mainly focusing on 2-axle, 3-axle and 4-axle trucks, were presented in this paper.
This paper is included in the literature review of new material to illustrate the breadth of use of violations data in road safety.
CHAPTER 3 - Comparison of Results between 2014 CTSW Study and PREVIOUSLY PUBLISHED TRUCK SIZE AND WEIGHT STUDIES
3.1 Purpose
The purpose of this report is to compare principal results of the Safety Comparative Analysis (Task V.A.) with other similar studies available in the literature. This involves two main objectives. First, those documents summarized in the revised desk scan that contain quantitative results pertaining directly to enforcement costs and effectiveness (i.e., the main objectives of the current 2014 CTSW Study) are identified. Second, the results from each of the selected documents are reviewed and objectively compared with the results of the 2014 CTSW Study. Two types of comparisons are provided: (1) those pertaining to the scenario results; and (2) other CTSW Study results.
3.2 Comparison of Safety Study Findings
The Safety Comparative Analysis (Task V.A.) compares the results of the 2014 Comprehensive Truck Size and Weight Safety Study with estimates of the safety performance of several tractor -trailer combinations from the existing safety literature.
Table 3-1 summarizes the findings of several key crash studies conducted over the last 20+ years. One can quickly see that there are no findings for LCVs, only for single and double combinations. This is because in all the studies there persisted this issue of a lack of sample size and data detail for LCV crashes. A few studies had results for triples or other double combinations, but review of the reports revealed that the sample size of annual crashes was 20 or less. The team also opted not to include the findings of the study by Dr. Sowers as Dr. Dan Blower profoundly critiqued this research.
A first comparison can be made of the internal consistency of the CTSW estimates for tractor semitrailers and double trailer combinations. While the rural and urban interstate rates vary from state to state, the rural interstate rates are around 0.5 or less for tractor semitrailers, close to the rate for double trailer combinations in Kansas. The 2014 study did not compute crash rates for double trailer combinations in Washington, Idaho and Michigan because it was not part of the scenario to do so. These results are similar to those of Abdel-Rahim using data from some of the same states, but in earlier years. The Western Uniformity Study has higher rates for both tractor semitrailers and double trailer combinations; it is difficult to say why, but that study drew crash data from many more states, so the many state-level differences (e.g., reportability thresholds; data collection practices) may be at play. It is not possible to say much more.
It is more difficult to include the work by Campbell et al., in the comparison because the work involves fatal crashes only. The differences with respect to operating environment are generally the same with urban interstates have high rates then rural interstates. So, what can we conclude? We have some reasonably consistent crash rate estimates for double trailer combinations and single combinations, but there is virtually no information on LCVs. The table provides yet additional evidence of the need to enhance and fundamentally re-think how we address the safety implications of larger and heavier trucks. Previous studies did not conduct safety inspection and violations analyses as no studies of that type were found in the literature. As a consequence, a comparison could not be performed with regard to the current work.
| Study | Crash Data Source | Exposure Data Source | Findings (Crashes per million vehicle miles) | Comments |
|---|---|---|---|---|
| Jovanis, et al., 1989 | Fleet records; all crashes | Fleet dispatches for routes with both twins and 3-S2 operations |
3S2*: 3.83 Twin*: 3.52 |
Data from one carrier; all crashes |
| Campbell et al., 1988 | TIFA (1980-84) | NTTIS (1985) | Single*: Rural 4.50 Urban 5.80 Double* Rural 4.06 Urban 4.30 |
From Western Uniformity Study Table VII - 7, Page VII - 17 |
| 2014 CTSW | Washington (2008-2011) |
WIM and FHWA VMT | Single: Rural 0.27 Urban 0.35 Combined: 0.31 |
Crash frequencies per year range from 85-100 in Idaho, to 270 in Michigan Double trailer combinations sample sizes small in Washington, Idaho and Michigan |
| Idaho (2008-2010) |
WIM and FHWA VMT | Single: Rural 0.47 Urban 0.67 Combined: 0.51 |
||
| Michigan (2008-2012) |
WIM and FHWA VMT | Single: Rural 0.19 Urban 0.24 Combined 0.22 |
||
| Kansas Turnpike (2008-2012) | VMT (2008-2012) | Single Rural 0.58 Urban 1.00 Double: Rural 0.46 Urban 0.53 |
Crash frequencies ranged from 50 to almost 80 per year | |
| Abdel-Rahim et al., 2013 | Utah (1999-2004) |
FHWA and WIM | Tractor semitrailers: 0.48 to 0.81 per year Twin: 0.48 to 1.06 per year |
Only computed crash rate per year all facilities; no route type breakdown |
| Idaho (2003-05) |
Single 0.78 to 0.92 Double 0.91 to 1.16 |
Only computed crash rate per year all facilities; no route type breakdown | ||
| Western Uniformity (1995-99) |
Crash data from 13 WUSA States | VMT for study using FHWA VMT | Rural Inter. - 1.50 single 1.83 multi Urban Inter. 2.10 single 1.39 multi |
CHAPTER 4 - Technical Linkage Between DESK Scan and Project Plans
4.1 Purpose
The purpose of this report is to compare principal results of the Safety Comparative Analysis (Task V.A.) with other similar studies available in the literature. This involves two main objectives. First, those documents summarized in the revised desk scan that contain quantitative results pertaining directly to safety effectiveness (i.e., the main objectives of the current 2014 CTSW Study) are identified. Second, the results from each of the selected documents are reviewed and objectively compared with the results of the 2014 CTSW Study. Two types of comparisons are provided: (1) those pertaining to the scenario results; and (2) other CTSW Study results.
4.2 Safety Analysis Linkages
The safety team developed a unique approach to the safety assessment, especially in the critical crash analysis area. The team chose 3 alternative approaches to address the crash analysis and pursued them all. The state-level crash analysis is most similar to the Abdel-Rahim research. He developed his own algorithm for analysis of WIM data, while the safety team relied on the project lead on WIM analysis, Roger Mingo. The safety team used more current state crash data, but there was much similarity in the discussion of data difficulties. So, it seems clear that there is at least some connection between the analysis undertaken in the Abdel-Rahim study and the analyses completed in this 2014 CTSW study.
There was an added level of detail in the selection of states for participation in our efforts to adhere to scenarios guiding the analysis. Although there is a veneer of similarity in the two approaches, the effort we undertook was certainly guided by the need to estimate crash differences between the control and alternative vehicles in each scenario. As it turned out, we were only marginally successful in the state-level plan.
There were no references in the literature that were comparable to the route-level analysis or the proposed use of fleet data. The team understood the risks associated with both approaches but understood, from our knowledge of the literature, that some innovative ideas were needed. It was unfortunate that the WIM data were not more thorough across the network; that might have allowed us to develop a workable data set for the route analysis.
There were very strong connections between the desk scan material and the analysis of vehicle stability and control. The team was close to the 2000 CTSW Study efforts in this area and the methods were not dependent on data from the field. So, in the case of vehicle stability and control the linkage was very strong. Many of the same metrics were chosen, although the details of the simulation model likely changed substantially over the 15+ years that elapsed from the 2000 CTSW Study.
There was virtually no literature to guide the inspection and violation portion of the study. Again, we were guided by the scenario vehicles and most importantly, the congressional mandate to ". . . evaluate factors related to the accident risk of vehicles that operate with size and weight limits that are in excess of federal law and regulations in each State that allows vehicles to operate with size and weight limits that are in excess of the Federal law and Regulations" . . . This led to the identification and comparison of vehicle that were operating legally but above 80,000 lb. We found no comparable research in the literature.
CHAPTER 5 - References
You will need the Adobe Reader to view PDFs.
Alberta Transportation. Retrieved August 7, 2013, from http://www.transportation.alberta.ca/Content/docType276/Production/lcv.pdf.
Bureau of the Census. (2002). "Vehicle Inventory and Use Survey." Retrieved August 7, 2013, from http://www.census.gov/svsd/www/vius/2002.html.
Carson, J. (2011). Directory of Significant Truck Size and Weight Research. Washington, DC.
Fancher, P. and K. Campbell (1995). Vehicle Characteristics Affecting Safety, Truck Size and Weight Study, Phase I: Working Papers 1 and 2 combined. Washington, DC. FHWA. Retrieved November 13, 2013 from http://wwwcf.fhwa.dot.gov/reports/tswstudy/TSWwp1.pdf
FHWA (2012). Vermont Pilot Program Report. FHWA. Washington, DC. Retrieved November 13, 2013 from https://ops.fhwa.dot.gov/freight/sw/reports/vt_pilot_2012/vt_pilot.pdf
FHWA. (2013). "Highway Statistics." Retrieved July 20, 2013, from https://www.fhwa.dot.gov/policyinformation/statistics.cfm.
Hanley, P. F. and D. J. Forkenbrock (2005). "Safety of passing longer combination vehicles on two-lane highways." Transportation research. Part A, Policy and practice. 39A(1): 15.
Jarossi, L., D. Hershberger, et al. (2012). Trucks Involved in Fatal Accidents Codebook 2010. Ann Arbor, MI, UMTRI.
Jovanis, P., H.-L. Chang, et al. (1989). "Comparison of Accident Rates for Two Truck Configurations." Transportation Research Record 1249.
Knipling, RR, P Waller, RC Peck, R Pfefer, TR Neuman, KL Slack, and KK Hardy, (2004), NCHRP 500, volume 13, A Guide for Reducing Collisions Involving Heavy Trucks, Transportation research Board, Washington, D.C.,
Knight, I., W. Newton, et al. (2008). Longer and/or Longer and Heavier Goods Vehicles (LHVs) - a Study of the Likely Effects if Permitted in the UK. Published Project Report PPR285, TRL.
Scopatz, R. A. (2001). "Crashes Involving Long Combination Vehicles: Data Quality Problems and Recommendations for Improvement." Transportation Research Record 1779.
Sowards, K., E. Eastman, J. Matthews and E. Pennington, (2013), "An Analysis of Truck Size and Weight: Phase I - Safety," Multimodal Transportation & Infrastructure Consortium, Marshall University
Stein, Howard S., and Ian Shore Jones. "Crash involvement of large trucks by configuration: a case-control study."American Journal of Public Health 78.5 (1988): 491-498.
USDOT (2004). Western Uniformity Scenario Analysis, Washington, DC, US Department of Transportation.
APPENDIX A - Summary of Additional Responses to NAS Peer Review Panel Issues
This section summarizes our response to detailed comments concerning the safety desk scan that were contained on Pages 32-38 of the NAS Peer Review Panel Letter report. Our intention is to demonstrate that we carefully reviewed the panel suggestions, even though we were unable to expansively address all of them.
There were several comments in support of the route-based analysis described in the project plan. Unfortunately the WIM data would not support such an analysis, which was a broadly conceptual idea. The safety team knows of no studies that have conducted using such an analysis. This topic is mentioned in the discussion of future research methods in response to Task 2.1 c of the revised desk scan.
The NAS Peer Review Panel inquired about practice of coupling liberalization of limits with special mitigation requirements is common in the United States and other countries. Responding to this request would have required extensive review of additional material to make this connection. While an excellent idea, it was beyond the scope of conduct for new research. The safety team has retained the existing discussion concerning much of the non-U.S. experience with regulatory change and placed it in Appendix B.
An additional comment focused on the advantages of including driver attributes as part of the CTSW in the future. The team has included a discussion of the UMTRI TIFA/NTTIS approach that can include driver attributes. The panel letter mentions fleet data as a method to obtain driver attributes; our experience with fleets is that this will take substantial effort and is best implemented as part of a long-term data collection strategy such as is discussed in Task 2.3. Among the many challenges will be a need to obtain comparable driver detail for non-crash-involved drivers as a means of exposure. This would be difficult unless some type of case-control formulation is used.
It is recognized that there is a gap in the desk scans concerning studies of the safety and environmental costs of increasing the extent or duration of work zones. We have included a discussion of how the safety implications of work zones might be included in future CTSW studies. This would be a particularly challenging undertaking as most work zone safety literature involves trials of a particular device within or before a work zone.
APPENDIX B - Observational and Pilot Studies of Longer/Heavier Trucks
Woodrooffe reviewed the safety performance of LCVs in Alberta, Canada between 1995 and 1998 (Woodrooffe, 2001). LCVs include double trailer combinations and triples longer than 25 m, including Rocky Mountain double trailer combinations, turnpike double trailer combinations, and triples. LCVs are restricted to certain routes (highway types), certain times of day in holiday periods (when there might be more congestion from holiday travelers), specific driver training and experience requirements, minimum required power-to-weight ratios, and the use of certain hitch types. In addition, LCVs are restricted from operating in adverse weather conditions, and at certain times of day in and around specified cities. Finally, there were time-of-day restrictions on two-lane highways. While the study found that LCV had generally lower crash rates than other configurations, the conditions in Canada are sufficiently different than in the U.S. to preclude any more detailed comparison.
Montufar et al. (2007) extended and expanded the Woodrooffe work in Alberta in 2007. The study developed exposure measures using vehicle count data on roadway segments, distributions of gross weight from WIM stations, a survey of vehicle length on one stretch of highway for one year, vehicle classification counts at selected stations, and a roadside survey of fleet mix data. These data were used to develop estimates of VKT (vehicle kilometers of travel) for routes on which LCVs were permitted to operate. Configurations considered in the analysis include straight trucks, tractor-semitrailers, "legal-length" double trailer combinations (STAA double trailer combinations), Rocky Mountain double trailer combinations, turnpike double trailer combinations, and triples. Alberta has among the most stringent driver, carrier, and vehicle regulations on LCVs in the CANAMEX corridor (Canada, US and Mexico). Once again, LCVs had lower crash rates than other trucks, but this finding cannot be extrapolated to U.S. conditions.
This work was also summarized in Regehr et al., which concluded, "The relatively superior safety performance of LCVs in Alberta may result in part from the stringent conditions placed on their operations through the design and enforcement of special permits. Principal along these is the requirement for experienced, specially-qualified driver for LCV movements" (Regehr, Montufar et al. 2009).
Abdel-Rahim et al. performed a similar study of LCVs in several western states, which includes some of the states on the CANAMEX corridor referred to above. A goal of the study is to calculate crash rates for the different LCV configurations. A survey of existing crash and VMT data showed that despite the fact that different types of LCVs are allowed to operate on the highways in several Western states, only Utah can identify in its crash data standard double trailer combinations as well as RMD, TPD and triples. The authors developed a method to estimate LCV travel using WIM-station data and vehicle classification counts. (The method is documented in a companion report (Abdel-Rahim, Berrio-Gonzales et al. 2006a).) Crash rates were calculated for Utah and Idaho. Because of limitations in the Idaho crash data, crash rates could only be calculated by truck configuration, distinguishing tractor semitrailers, double trailer combinations and triples. Specific LCV types such as turnpike double trailer combinations and Rocky Mountain double trailer combinations cannot be identified in the crash data.
In terms of severity, tractor semitrailers and double trailer combinations had similar distributions of crash severity in the states examined. For example, in Idaho, about 3% of crash involvements for each involved a fatality, about 30-33% included an injury, and the remainder involved only property damage (PDO). Among crashes involving triples, only about 2% were fatal crashes and only 13% involved an injury. However, there were only 14 triples crashes over the entire period covered by the data (1999-2005), limiting the usefulness of this finding. Utah crash data can identify RMD, TPD and triples, as well as tractor semitrailers and standard double trailer combinations. In the Utah crash data, the proportion of fatal crashes was about the same for each of these truck types.
In Idaho, crash rates were calculated by year for tractor semitrailers, double trailer combinations, and triples, on state roads and on interstate highways. On state roads, double trailer combinations and triples consistently had higher crash rates than tractor semitrailers, ranging from about 25% to about 50% higher. Triples had somewhat lower crash rates than double trailer combinations on state roads, though it should be noted that there were only six crashes involving triples combinations in three years on Idaho state highways. There were 469 tractor semitrailers and 85 double trailer combinations crashes. On Interstate highways, triples had lower crash rates than either tractor semitrailers or double trailer combinations - about 15% lower than tractor semitrailers and about 30% lower than double trailer combinations. There were 887 tractor semitrailers crashes, 109 double trailer combinations and 36 triples. Tests indicated that the differences between tractor semitrailers and double trailer combinations and between tractor semitrailers and triples were statistically significant.
For Utah, crash rates could be calculated for tractor semitrailers, standard double trailer combinations, RMD, TPD, and triples. The results showed tractor-semitrailers with the lowest overall crash rates, compared with standard double trailer combinations and each of the LCV types. On average, crash rates for RMD were about 60% higher, rates for TPD were over twice as high, and triples' crash rates were 38% higher. Statistical tests showed that each of the differences was statistically significant (Abdel-Rahim, Berrio-Gonzales et al. 2006b).
There has been a series of recent pilot studies within states or groups of states to test the effect of temporarily increasing weight limits on selected roads. In 2013, the State of Idaho issued a final report on the ten-year project to determine the effect of increasing weight limits on state highways (Department of Transportation Idaho, 2013). Despite this extensive effort, most carriers were not willing or able to change equipment or operations to take advantage of the higher permitted weights. No statistically significant effect was observed. There was a 4.1% increase in truck crash rates on pilot routes in comparison with non-pilot routes. Pilot routes with the greatest utilization by the 129,000 lb. trucks also experienced a slight increase, but again, it was not statistically significant. The study was unable to control for any potentially confounding factors, such as changes in the operating environment.
Vermont also implemented a pilot project to assess the effect of increasing weight limits on interstate highways. The pilot allowed 6-axle, 99,000 lb. GVW tractor-semitrailers on interstate highways. In addition, restrictions were dropped on several other configurations that had been allowed on state roads, but would be allowed on Interstates under the pilot. These trucks include 3-axle 55,000 lb.GVW, 4-axle 69,000 lb. GVW, 5-axle 90,000 lb. GVW, and 6-axle 99,000 lb. GVW. The project was a one-year study that assessed effects on truck volumes, the vehicle fleet, damage to pavement and bridges, and fuel consumption, in addition to safety. Highway safety was measured in terms of the number of truck crashes on the interstate and state highways, and the number of fatal truck crashes (FHWA, 2012).
The results with respect to safety were inconclusive. The study reported that no changes in crash rates were statistically significant.
The State of Wisconsin commissioned a study to evaluate the consequences of increasing weight limits on Wisconsin roads (Cambridge Systematics, 2009). The study evaluated several specific configurations, which were not currently in use on any roads in the state, but which might be permitted in the future using assumptions from previous studies rather then crash data per se.
The subject of a Maine/New Hampshire study was the obverse of the other recent states studies: Instead of the consequences of raising allowable weights on interstate roads, the study addressed the consequences of reversing an exemption that allowed trucks over 80,000 lbs. on the Maine Turnpike. The basic study approach is to compare the safety of the exempt trucks on the Maine turnpike with their crash experience on the roads to which they would be diverted. Estimates of VMT were developed from commodity flow data and models, along with vehicle classification counts and weigh-in-motion data from roadway segments. Using this information, VMT was estimated for different truck types and routes, along with estimated changes to VMT if the exemption was removed. The study assumed that drivers would choose the most time-efficient route between origin and destination.
The results show that crash rates for 5- and 6-axle tractor semitrailers on the Maine Turnpike are 1/4th the rates on the diversion routes. Three years of crash data (2000-2002) were used in the calculation, amounting to a reported 1,000 crashes, so the result should be statistically robust, even though confidence intervals were not determined. The difference was consistent with the common finding that crash rates are lower on higher quality roads.
The study also considered the effect on crash severity. Off the Turnpike, crashes on the diversion routes include more intersection, head-on, opposite direction sideswipe, and rear-end/sideswipe (likely same-direction sideswipes). Most of the roads the exempt trucks would be diverted to are two-lane -way roads. Crash rates by severity are all higher on the lower-quality roads. Overall, the analysis found that removing the exemption from Federal weight limits would result in an increase of 1.2 crashes per year and increased crash costs (Wilbur Smith Associates, Woodrooffe and Associates et al. 2004).
APPENDIX C - International Experience
C.1 Alberta LCV
Details on the Alberta LCV program were found on the Provincial website (Alberta Transportation). Long Combination Vehicles (LCVs)[7] are truck and trailer combinations, consisting of a tractor with two or three trailers or semitrailers, in which the number of trailers and/or the combined length of the combination exceed the regular limits of 25 meters (82 feet). These vehicles have been operating on Alberta highways since 1969, when triple trailer combinations were introduced. Currently in Alberta, the maximum gross vehicle weight applicable to LCVs is 62,500 kilograms while the maximum configuration length is 37 meters (121.4 feet). A description of the Alberta LCV configurations follows:
- Rocky Mountain Double - A combination vehicle consisting of a tractor, a 12.2 m (40 feet) to 15.2 m (53 feet) semitrailer, and a shorter 7.3 m (24 feet) to 5.5 m (28 feet) semitrailer. The total length does not exceed 31 m (102 feet). These vehicles are typically used when cargo considerations are governed by weight rather than the cubic capacity of the trailer.
- Turnpike Double - A tractor plus double trailers. Each trailer is between 12.2 m (40 feet) and 16.2 m (53 feet) long. The Turnpike Double is typically used for carrying cargo that benefits from the additional cubic capacity of the trailer arrangement.
- Triple Trailer - This combination consists of a tractor with three trailers of approximately the same length. The typical trailer length is approximately 7.3 m and 8.5 m (24 to 28 feet). The Triple Trailer is used for carrying cargo that benefits from the additional cubic capacity of the trailer arrangement or from the operational flexibility of having three smaller trailers that can be easily redistributed as separate vehicle units at the point of origin and destination.
The province of Alberta has had long standing policy governing LCV operations under a special permit system. The policy is structured to maximize safety by placing controls on the operation and driver qualifications. The policy can be found on the province of Alberta's website (http://www.transportation.alberta.ca/Content/docType276/Production/lcv.pdf).
C.1.1 General Provisions
The following is an edited summary of the provisions that apply to the permit holders.
- The permit holder must formally agree to abide by the routes, vehicle dimensions, equipment and conditions specified and carry a copy of the appropriate permit in each power unit.
- The permit holder must provide any reasonable statistics related to LCV operations to the province.
-
The permit holder must investigate and document the findings of every traffic accident involving a vehicle registered to the permit holder for more than 4,500 kilograms or a passenger vehicle originally designed to transport 11 or more persons, including the driver, that resulted in:
- The death of a person;
- An injury requiring treatment by a medical doctor;
- A condition that causes an employee to lose consciousness; or
- Damage to all property, including cargo, totaling $2,000 or more.
- Collisions found to have occurred while operating under permit must be evaluated to determine if the collision was preventable on the part of the permit holder and/or their driver(s). Each evaluation must use the criteria established by the National Safety Council (www.nsc.org). Verified non-preventable collisions are not used when evaluating the carrier's risk associated with operation under the permit.
- The permit holder must ensure, and be able to provide proof, that their drivers and driver trainers meet and maintain the requirements specified by the program.
- Prior to issuing an LCV Driver's Certificate, the carrier must ensure the driver meets the following qualifications:
- Holds a valid Class 1 driver's license or equivalent;
- Has a minimum of 24 months or 150,000 km of driving experience with articulated vehicles;
- Has passed a Professional Driver Improvement Course within the past 48 months;
- Has passed the Alberta Motor Transport Association's "Longer Combination Vehicles Driver Training Course";
- The driver's abstract, dated not more than one month prior to the issue date of the Drivers Certificate, must show no driving-related criminal code convictions in the prior 36 months; no more than 2 moving violations in the prior 12 months; and no more than 3 moving violations in the prior 36 months; and
- In the past 12 months the driver has reviewed all current regulations, permit conditions and issues covering the operation of LCV's.
- A driver-in-training may operate a long combination vehicle, while accompanied by a driver who holds a valid LCV Driver's Certificate
C.1.2 Equipment Requirements
- All tractors must feature a maximum gross weight to power ratio of no more than 160 kg per horsepower (120 kg/kW).
- Tractor air supply - compressors must be capable of raising the air pressure from 50 PSI to 90 PSI with the engine idling at 1,250 RPM in two minutes or less with the tractor alone and four minutes or less with the trailers hooked up and the complete air system energized.
- Air reservoirs - tractors must be equipped with at least two air reservoirs. Each reservoir must have at least 41,000 cm3 (2,500 in3) of capacity. The two tanks must have a combined capacity of 82,000 cm3 (5,000 in3).
- Brake relay valves - compatible relay valves are required to reduce the time lapse between treadle application and brake application at the rear most trailer.
- The rear axle group of the power unit and all axle groups of the trailers and converters must be equipped with mud flaps or splash guards that are constructed to ensure that they remain in a rigid downward position at all times. All mud flaps or splash guards shall be mounted behind the wheels at a distance not exceeding 25.0 cm (10 inches) to the rear of the wheels.
- The trailers of the combination shall be joined together by means of no-slack pintle hook(s), equipped with an air or hydraulic ram. The no-slack ram is to be incorporated in either the pintle hook or the pintle hook eye of the coupling apparatus.
- The allowable tire and axle weight limits are specified by the special permit program
C.1.3 Operational Requirements
- Any breakup or makeup of an LCV must be done off public roadways on private property or as directed by an authorized Alberta Transportation staff member or peace officer.
- The vehicles in a combination shall be so loaded and coupled together so as to ensure that any such combination travelling on a level, smooth, paved surface will follow in the path of the towing vehicle without shifting, swerving, or swaying from side to side over 10 cm to each side of the path of the towing vehicle when it is moving in a straight line.
- Drivers shall avoid crossing opposing lanes of traffic unless absolutely necessary.
- Maximum speed shall be the lesser of 100 km/h (62 mph) or the posted speed limit.
- The permit cannot be combined with any other permit for overwidth, overheight, overhang, or overweight.
- All provincial and municipal road bans shall be observed unless specified otherwise.
C.1.4 Adverse Weather
For multi-lane highways:
- LCV's shall not cross oncoming lanes where visibility does not allow it to be done safely.
- Where there is accumulated snow on the highway or when the highway is icy, LCV's shall not pass any other vehicle unless that vehicle is traveling at a speed of less than 70 km/hr. (45 mph).
- Where a highway becomes impassible due to icy or slippery conditions, LCV's will obey all advisories posted by the authority of Alberta Transportation.
For two-lane highways:
LCV's shall not operate during adverse weather or driving conditions (including but not limited to rain, snow, sleet, ice, smoke, fog or other conditions) which:
- Obscure or impede the driver's ability to drive in a safe manner; and
- Prevent the driver from driving with reasonable consideration for the safety of persons using the highway.
- The permit holder is required to make a reasonable effort to determine the driving conditions on the route. Vehicles must not be dispatched when adverse conditions are known to be present on the route. Drivers encountering unexpected adverse conditions must stop at the next safe location (or as directed by an authorized Alberta Transportation staff member or a peace officer) and wait for the adverse conditions to abate.
C.1.5 Hours of Operation
Operation will be allowed 24 hours per day except in the following cases:
On all Highways, movement will not be allowed after 4:00 pm on December 24 and December 31. On Two-lane Highways for weekends with no special holiday on the Friday or the Monday, movement will not be allowed from 4:00 pm to 8:00 pm on Friday and from 4:00 pm to 8:00 pm on Sunday. For a long weekend when a special holiday falls on a Friday, movement will not be allowed from 4:00 pm to 8:00 pm on the preceding Thursday and from 4:00 pm to 8:00 pm on Sunday. For a long weekend when a special holiday falls on a Monday, movement will not be allowed from 4:00 pm to 8:00 pm Friday and from 4:00 pm to 8:00 pm on the Monday.
In addition to the general hours of operation restrictions, there are workday and weekend time of day restrictions tied to specific road sections where congestion is problematic.
C.1.6 Exemptions for Vehicle Length
Aerodynamic devices are excluded from the measurement of overall length, provided that:
- Any portion of the device more than 1.9 meters (6 feet) above the ground does not protrude more than 0.61 meters (2 feet) beyond the rear of the vehicle; and
- Any portion of the device within 1.9 meters (6 feet) of the ground does not protrude more than 0.30 meters (1 foot) beyond the rear of the vehicle.
Heavy duty bumpers and devices designed to reduce the impacts of wildlife collisions are excluded from the measurement of overall length, provided that:
- Bumpers and devices do not extend more than 0.30 meters (1 foot) beyond the front of a truck tractor.
In addition to the requirements listed above, there are configuration specific requirements with respect to vehicle weight that are specified in the policy document for safety reasons.
For the Rocky Mountain Double configuration (see Figure C-1):
Figure C-1: Rocky Mountain Double configuration

- In all cases, the lead semitrailer of the configuration must be heavier than the second trailer or semitrailer; and
- An empty converter dolly may be towed behind the combination so long as the overall length does not exceed the limits stated on this page, and the dolly is equipped with all legally required lights and equipment.
For the Turnpike Double configuration (see Figure C-2):
Figure C-2: Turnpike Double configuration

- In all cases, the lead semitrailer of the configuration must be heavier than the second trailer or semitrailer;
- Turnpike double trailer combinations may include a tridem axle group on the second trailer; and
- An empty converter dolly may be towed behind the combination so long as the overall length does not exceed 41 meters (135 feet) and the dolly is equipped with all legally required lights and equipment.
For the Triple Trailer configuration (see Figure C-3):
Figure C-3: Triple Trailer configuration

- In all cases, the lead semitrailer of the configuration must be heavier than the second trailer or semitrailer and the third trailer or semitrailer is the lightest;
- An empty converter dolly may not be towed behind a triple trailer combination; and
- In order to qualify for the 38 m length (125 feet), both trailers two and three must be coupled by a B converter.
C.2 Ontario LCV Program
Long Combination Vehicles began operating in Ontario in August 2009 under a program similar to the Alberta LCV program. However unlike Alberta, the Ontario program is seasonal in that LCVs are not permitted to operate during the winter months of December, January and February. The program is tightly focused on safety and has the following objectives taken from a program review published by Ontario Ministry of Transportation, Transportation Policy Branch (MTO) (Ontario Ministry of Transportation 2011):
- Safety - Ontario's top priority is to make Ontario's roads the safest in North America.
- Through strong program conditions, Ontario ensures LCV operations are safe.
- Economy - LCVs have economic benefits for shippers and carriers with consolidated loads using fewer resources. LCV program is part of the harmonization efforts with Quebec to make it easier for shippers to move goods across provincial boundaries.
- Environment - Greenhouse gas emissions are directly linked to the amount of fuel consumed.
- LCVs use approximately 1/3 less fuel than two tractor-trailers.
- Infrastructure Protection - LCV vehicle weights and dimensions standards minimize damage to roads and bridges.
- Congestion Reduction - LCVs operate outside of rush hour periods in the Greater Toronto Area (GTA).
Limited capacity at rest stops for carriers to use in emergencies has been identified as a potential challenge with expanded LCV operations. Carriers are confident that their dispatching procedures will allow them to work their way through bad weather or traffic issues. MTO continues to work with the industry to address the need for additional rest/emergency stops in key parts of the LCV network.
MTO maintains a careful approach to LCV program management and monitoring to ensure safe and efficient operations. Regular program management tasks include monitoring monthly carrier trip records, and continued random checks of specific trip details to ensure compliance with program conditions. With respect to broader aspects of the program, MTO continues to work with Ontario Trucking Association (OTA) to develop an improved Rest/Emergency Stop Network, as well as work with Quebec and other provinces to better harmonize LCV program conditions.
Several sources of data and information are used to monitor ongoing performance of LCVs, including information obtained from program participants.
- All carriers participating in the program are required to maintain a record of each LCV trip. The recorded trip information includes the driver's name, the trip origin and destination, commodities carried and the trip distance. For each trip, carriers must also indicate the probable alternative mode of transport (truck, rail, other) had LCVs not been available. This information is submitted to MTO on a monthly basis and provides a basis for certain components of this review.
- MTO also requests additional data related to driver qualifications, vehicle standards and speed recordings for selected trips from a random sampling of carriers on a regular basis. This is one of the methods used to verify compliance with program requirements.
- Ontario LCVs are made up of a tractor pulling two full-length semitrailers up to 40 meters (131 feet) in overall length.
- Participating carriers are responsible for verifying that drivers and instructors meet the specified qualifications, training and experience, and have obtained an OTA-issued certificate. This includes ensuring that:
- LCV drivers are proven safe and reliable tractor-trailer operators with a minimum of 5 years of experience;
- All LCV drivers successfully complete specified LCV driver training that includes classroom, yard and on-road training and evaluation, including at least 1,000 km of practical LCV experience;
- LCV instructors have at least 10,000 km of LCV experience; and
- Carriers are required to enter into a Memorandum of Understanding (MoU) with MTO signifying that the carrier accepts responsibilities as outlined in the program conditions. All approved carriers must maintain a satisfactory Carrier Safety Rating, not just in their LCV operations but in all their operations.
Strict guidelines detailing the vehicle configuration, dimensions and weight allowances are specified in the permit conditions. LCVs cannot be heavier than single tractor-trailers (i.e., 63,500 kg = 140K lb.). LCVs are required to have special equipment including horsepower minimums, on-board speed recording devices, anti-lock braking systems (ABS), additional lighting, rear signage and electronic stability control (ESC).
LCV permits have specific and detailed operating restrictions that outline where and when participants may operate these vehicles. Permit conditions outline that LCVs may only operate on approved routes, must not detour off approved routes for any reason, including for road closures, and must not operate on any routes on the evening preceding and the last evening of long weekends.
LCVs must not exceed a speed of 90 km/h, and must not travel in the Greater Toronto Area during morning and afternoon rush hours. They are not permitted to carry livestock or dangerous goods requiring a placard. LCVs must not operate during the winter months of December, January and February and must not operate during inclement weather, poor visibility or poor road conditions.
C.2.1 Carrier Qualifications
In Ontario, carriers must have at least five years trucking experience, maintain a 'satisfactory' Carrier Safety Rating and have at least $5 million liability insurance. Participating carriers are expected to enter into a Memorandum of Understanding (MOU) with MTO signifying that the carrier accepts all responsibilities as outlined in the program conditions document. As well, the carrier must have resources to acquire specialized equipment, train instructors and drivers and engage engineering consultants to assess proposed routes.
If the carrier fails to meet or maintain the high standards set out in the program conditions, they are denied entry into the program or, if they have already been issued permits, those permits are automatically revoked. The potential loss of LCV permits provides a significant incentive for these carriers to ensure all of their operations meet high safety standards.
C.2.2 Driver Qualifications
Drivers must have an OTA-issued LCV Driver Certificate based on a valid Class A driver's license with Z (air brake) endorsement, or equivalent from another jurisdiction, and a minimum of five years provable tractor-trailer driving experience. Drivers must not have had more than two moving violations within the past year, or more than three moving violations in the past two years, and no driving-related criminal code convictions within the past three years.
Each driver must successfully complete the OTA LCV Driver Training Program. This program includes classroom, yard and on-road training and evaluation, including at least 1,000 km of practical LCV experience with a trainer. Alternatively, the driver may have successfully completed an approved Canadian Trucking Alliance (CTA) LCV driver training program in another province or have a Quebec "T" license endorsement issued prior to June 1, 2009, including at least 1,000 km of LCV experience.
LCV instructors may be employed by carriers as 'in-house' driver-trainers or may be attached to an appropriate training organization. The instructors must be qualified LCV drivers themselves and possess an up-to-date OTA-issued LCV Instructor Certificate, which allows them to train Ontario LCV drivers. In addition, LCV instructors must have at least 10,000 kilometers of LCV driving experience. Instruction may only be given to drivers of carriers possessing valid LCV operating permits on approved routes and equipment.
C.2.3 Route Conditions
LCVs are only allowed to operate on designated, approved routes in Ontario. This consists of the primary highway network, rest/emergency stops and origin/destination locations.
The primary LCV highway network consists of 400-series (and similar) highways individually authorized for general LCV travel. Highways must be multilane with controlled access. MTO required the OTA to undertake a full assessment of the highway network to ensure the highways could accommodate LCVs. This included engineering assessments for all the highway-to-highway ramps to identify those ramps that could accommodate LCVs. Some ramps were found to be unacceptable for LCV operations. These are excluded from the primary LCV highway network.
Origin/Destination locations must generally be within km of a primary highway. All off-highway travel to or from any LCV origin or destination location requires a full engineering assessment of the route prior to approval. Carriers are responsible for conducting an engineering assessment of the access route and obtaining any municipal approvals for travel on municipal roads.
C.3 OECD Moving Freight in Better Trucks
The International Transport Forum at the OECD produced two reports (Woodrooffe, Glaeser et al. 2010; Organisation for Economic Co-operation and Development 2011) dealing with the analysis of more productive vehicles. The purpose of the reports was to "identify potential improvements in terms of more effective safety and environmental regulation for trucks, backed by better systems of enforcement, and to identify opportunities for greater efficiency and higher productivity." The two topic areas most relevant to this desk scan are heavy truck safety and the evaluation of truck performance.
First, the studies noted that there was a need for additional research in several safety areas. These areas include the potential aggravation of the consequences of accidents when higher capacity vehicles are involved and possible countermeasures to mitigate these consequences, and the effect of vehicle length on the risk of overtaking and on visibility reduction for other road users.
The studies also commented that government intervention in trucking and associated activities is extensive. It includes regulation of vehicle weights and dimensions, technical characteristics of vehicles, vehicle access to the road network, driver licensing and behavior and the practices of transport operators. In some instances, trucking regulation is fragmented (between jurisdictions), prescriptive, and possibly slow to respond to changing technology, industry needs and community expectations. The study concludes that these issues undermine regulatory effectiveness.
The studies found that in Canada and Australia in particular, the current trends in trucking enforcement include:
- Electronic detection of non-compliance;
- Use of information technology to gather and apply information on patterns of behavior, to enable the focusing of enforcement resources on high-risk drivers and operators;
- Use of accreditation and safety ratings schemes to encourage the application of safety
- Management systems; and
- Imposition of legal requirements on off-road parties with control over truck operations.
It was concluded that, in general, regulatory enforcement can benefit from the same advances in technology and management as general transport operations, using vehicle positioning systems, weigh-in-motion systems, on-board monitoring systems and detection and measurement equipment at the roadside and embedded in the roadway, e.g., advanced weigh-in-motion systems. The safety benefits of many of these regulatory approaches have yet to be quantified.
Most requirements relating to vehicle weights and dimensions are prescriptive. They have evolved over a long period and with significant regional differences, including within federal jurisdictions. Canada pioneered the use of performance standards for trucks in the 1980s. The current CTSW Study safety team believes that there is some evidence that this approach has benefitted Canada, but it yet to be proven that a similar approach would be workable in the U.S.
The study notes that lack of detailed data makes it difficult to assess crash risk on an individual truck basis. A study by TRL in the U.K. (Knight, Newton et al. 2008) assessed the various consequences of allowing different types of larger trucks than the current limits; the authors found likely increases in crash risks per vehicle km, but decreased crash risks per unit of goods moved.
Studies of experiences in Canada (Barton and Tardif 2003; Woodrooffe, Anderson et al. 2004; Montufar, Regehr et al. 2007; Regehr, Montufar et al. 2009) found that accident involvement of higher productivity vehicles per kilometer are significantly less than those of single trailer trucks in general operations. The 2009 study found, however, that the relatively superior safety performance of LCVs in Alberta might result in part from the stringent conditions placed on LCV operation through the design and enforcement of special permits. Principal among these is the requirement for experienced, specially qualified drivers for LCV movements. The CTSW Study safety team believes that these studies support the potential for LCVs to be able to retain or enhance safety, but more definitive experience and analysis is needed.
The OECD study further concludes that computer simulations show major variations in truck performance, with some Higher Capacity Vehicles (HCVs) performing better than today's workhorse trucks. A comparative analysis of the dynamic stability, geometric performance, payload efficiency and infrastructure impact of 39 workhorse and higher capacity vehicles, using computer simulation, revealed major differences between these vehicles. The analysis indicates that, on key performance measures, higher capacity vehicles perform often better than the workhorse vehicles used to transport the majority of road freight around the world today. The data obtained from the vehicle simulations and the comparison of vehicle performance against the selected measures highlighted areas for improvement as well as good practice
C.4 Netherlands
This report documents the safety outcome of a pilot study of longer and heavier vehicles (Aarts and Honer 2010). The Netherlands introduced an initial trial of LHVs between 2001 and 2004. The authorization of LHVs was extended in a second trial period between 2004 and 2006. After a transitional period a large-scale trial was commenced on 1 November 2007. This was the first time that LHVs were introduced on such a large scale. Approximately 118 LHV companies participated during the course of this study and the trial period lasted until November 2012.
LHVs operating in the Netherlands must not transport livestock or hazardous materials and are equipped with the following extra hardware:
- A mirror kit in accordance with the latest European regulations;
- Advanced braking systems;
- An axle load measuring system;
- Side protection between the wheels;
- Side markings to ensure better visibility in the dark; and
- A sign on the back showing the contour of the combination and stating the length in meters.
The handling of the combination and the detailed operation of the vehicles are also subject to further requirements.
In addition to equipment requirements, with regard to road safety, in order to drive an LHV the driver must comply with the following three conditions;
- The driver must have at least five years of experience driving an articulated vehicle;
- The driver must possess a specific LHV certificate; and
- In the three years prior to participation in the trial, the driver may not have been disqualified from driving, have had his/her driving license revoked or been required to surrender his/her license due to an offence or crime.
The objective of this research was to make clear whether the current deployment of LHVs causes any issues in relation to road traffic safety, traffic flow and road design. The intent of the safety analysis is to gain preliminary insight into possible issues concerning LHVs in relation to traffic safety, road design and traffic flow. This insight was obtained through technical analysis of LHV accident records.
The following steps were used in the safety analysis.
- Ascertaining accidents involving LHVs.
- Individual (case-by-case) analysis of the crash.
- Comparison of crash characteristics.
Each identified incident was thoroughly examined on a case-by-case basis addressing the following categories:
- Description of location;
- Description of circumstances;
- Description of accident;
- Significance of LHV characteristics; and
- Accident proneness of location.
With respect to safety the study produced the following conclusions.
Between 2007 and mid 2009 eleven accidents involving LHVs were recorded. All eleven accidents had resulted in material damage only (MDO).
Not all accidents that happen are recorded by police. Considering the high registration level of accidents involving fatalities and casualties requiring hospital treatment, there is little chance for any LHV accident involving casualties to have occurred.
Based on the accident analyses it cannot be concluded that LHVs are at a higher risk of accidents than regular trucks.
One matter of interest is the side visibility and perception of the vehicle combination. LHV drivers have the impression that other road users, upon passing or overtaking, discover too late that they are driving next to a longer vehicle. This poses a heightened safety risk in the following situations:
- Short slip roads and slip roads that do not continue into a hard shoulder; and
- Busy motorways with a high concentration of entry and exit lanes.
Poor weather conditions (wind and slippery roads) in combinations with limited axle pressure because of a light or small vehicle load may also bring about increased traffic safety risks for LHVs.
It is suspected that LHVs at threat of overturning are more difficult to correct than regular trucks.
Interactions with slow traffic will always bring about an increased risk to traffic safety; this is no different for LHVs than it is for regular trucks. The vast majority of potentially treacherous situations that were reported happened on the strategic road network, however. Moreover, drivers indicated they encountered little slow traffic on their routes. The designation of LHV routes may as such be deemed successful.
Current vehicle requirements appear to work well in practice, too:
- At regular police checks LHVs distinguish themselves in a positive sense; vehicle equipment is generally in good order;
- Brake power and visibility from within the an LHV (blind spot issue) is no different from regular goods vehicles or, according to drivers and experts, sometimes even better; and
- Splash guards and anti-spray mud flaps appear to work well in practice.
LHV drivers tend to cherish a great sense of responsibility and anticipate other traffic with great awareness. Separate LHV training and driver requirements contribute greatly to this. LHVs appear to adhere to the routes designated for use by these vehicles.
C.4.1 European Modular System
In the European Union, political initiatives regarding road transport are proposed by the European Commission and decided upon by the Council of Ministers in agreement with the European Parliament. Current policies build on the White Paper "European transport policy for 2010: Time to Decide" and a mid-term review of this White Paper "Keep Europe Moving - Sustainable Mobility for our Continent". The 27 nations of the Union are responsible for domestic policies related to truck regulation but are required to allow trucks that meet European Union standards access to their road networks.
European Modular System is a concept of allowing combinations of existing loading units (modules) into longer and sometimes heavier vehicle combinations to be used on some parts of the road network. The typical modules are 20 and 40 foot cargo containers making this vehicle highly compatible with intermodal freight movement. Because of transport challenges facing Sweden and Finland, vehicle weights were significantly higher than those in most European countries. Therefore it was impractical for Sweden and Finland to apply the EU rules on weights and dimensions as they would have reduced vehicle productivity. In order to find a solution that would enable foreign transporters to compete on equal terms in Sweden and Finland, a compromise was reached to allow increased vehicle length and weight all over the EU on the condition that the existing standardized EU modules were used. This is the so-called European Modular System.
Legislation that limits the maximum size and weight of trucks (Directive 96/53/EC) together with provisions for Combined Transport operations (Directive 92/106/EEC) were re-evaluated with the view to making more efficient use of infrastructure capacity and distribution logistics. This includes potential wider use of European Modular System vehicle combinations 25.25 meters long. These vehicles are in regular use in Sweden and Finland, with trials underway in some other member states (Netherlands, Denmark and some northern German States). In April 2013, Directive 96/53/EC was amended and provided a mechanism to facilitate wider use of EMS vehicles among cooperating countries.
Key elements of the policy on which regulatory decisions are based in the EU are:
- The principle of co-modality (the efficient use of different modes on their own and in combination) has been adopted as the approach to achieve optimal and sustainable utilization of resources;
- European-wide standardization of various conditions of road freight transport, such as driving licensing, working conditions and easing of administrative burdens;
- Establishment of national electronic registers for infringements of Community legislation for road freight transport and interconnection of these registers so as to obtain harmonization of sanctions for such infringements;
- A directive on road charging for heavy vehicles that seeks to prevent discrimination, or charging monopoly rents, by requiring charges to be based on road expenditure but which allows nations to charge some of the external costs associated with road transport in congested and polluted areas; and
- A target to produce 20% less CO2 by 2020 for the EU as a whole, across all sectors of the economy, compared to a 1990 baseline.
C.5 Sweden
The following is a reproduction of the summary of research focusing on the operations and safety of long combinations vehicles published by VTI, the Swedish National Road and Transport Research Institute (Hjort and Sandin 2012).
Longer and heavier vehicles on the roads could result in large transport and economic benefits. In an on-going VTI project, denoted Sammodalitetsprojektet, an economic estimate is made of the effects of allowing longer and heavier trucks in Sweden. A central part of that project is traffic safety analysis and risk assessment of longer and heavier vehicles. This review concerns potential traffic safety effects from the introduction of longer and heavier trucks than those currently allowed in Sweden.
For this purpose, a summary of results from accident studies, literature summaries and in-depth studies of fatal accidents involving heavy trucks done in the past few years was made. In addition, a focus group study with truck drivers was conducted to pick up the traffic safety problems with road transports involving the heavy trucks available today. Results from a parallel VTI study concerning overtaking of longer trucks have also been included in order to give an overall picture of the possible traffic safety effects associated with the introduction of longer and heavier trucks in Sweden.
In summary, the literature shows that it is very complex to estimate how the traffic safety in general would be affected by the introduction of longer and heavier vehicles. Some studies indicate a slightly increased risk of accidents per vehicle mile, and that the increase depends on the vehicle combination in nature. Other studies show that the difference in accident rates in comparison to conventional vehicles is small, at least for larger and safer roads. Several studies make the case that if the number of accidents per unit of transported goods is counted, there is an expected crash risk reduction with longer and heavier vehicles. Potential adverse traffic safety effects per vehicle kilometer could thus be offset by the fact that fewer vehicles are needed to transport a given amount of goods. Some studies conclude that the longer and heavier vehicles may even have a positive net effect on traffic safety. In order to estimate the overall impact on traffic safety of an introduction of longer and heavier vehicles, it is important to take into account whether the traffic volume of heavy transport will change due to the new conditions. Will, for example, the amount of transported goods increase as a direct consequence of the introduction of these vehicles? On which roads will the transports take place? How will the freight be divided across different transport modes if longer and heavier vehicles are introduced on a larger scale? These are matters outside the scope of this report. But in any case, for maintaining or achieving a net positive effect on road safety, it is essential that the longer and heavier vehicles do not significantly increase the risk of any aspect of traffic safety. Based on the aspects that have been addressed in this report, we recommend the following.
- Longer and heavier vehicles should mainly operate on main roads where it is possible to overtake heavy vehicles without fear of oncoming traffic. Longer and heavier vehicles should operate as little as possible in urban areas.
- Longer and heavier vehicles shall be constructed for good stability, and be equipped with Electronic Brake Systems (EBS), which apply different amount of brake force between the wheels to avoid wheel lock.
- Longer and heavier vehicles put greater demand on tires, brakes and especially maintenance and inspection. In that statistics from Svensk Bilprovning show deficiencies in the brake system of heavy trucks (29%) and heavy trailers (45%), it is of the utmost importance that the braking system on conventional as well as longer and heavier vehicles is checked regularly. In general, the legislation should be reviewed to see if an increased responsibility could be put on vehicle owners regarding control of brakes for all heavy vehicles.
- Driver fatigue is a significant causal factor in single-vehicle accidents involving heavy vehicles. Drive and rest times may be harder to keep with the extra-long vehicles if rest areas, which are already today overcrowded along certain roads, are not extended.
- The signs of the transition distance on 2+1 roads should be reviewed to possibly reduce the risk of dangerous situations and emergencies caused by overtaking of heavy vehicles, regardless of length. (Note: A "2+1" road is a three lane road consisting of two lanes in one direction and one lane in the other, alternating every few kilometers, and separated usually with a steel cable barrier.)
- The design or the visibility of the sign that warns of "long load" could possibly be improved in order to reduce the risk of critical situations when overtaking of heavier and longer vehicles on both 2 +1 roads and two-lane roads.
- In the literature, accident risk is usually estimated as an average over all accident categories. In order to identify in better detail which traffic situations may be affected by longer and heavier vehicles, additional studies should be carried out to estimate the risk of accidents per accident category.
- In the literature it is often mentioned that longer and heavier vehicles are likely to have a negative impact at intersections caused by the length of the vehicle and/or slower acceleration. Studies need to be conducted to determine whether this is the case.
- Frontal Collisions with oncoming vehicles when overtaking on two-lane roads results in fatal and serious injuries with significant social costs. Additional field studies on two-lane roads are therefore necessary to determine whether there is a higher risk to overtake a 30 m-long vehicle compared to overtaking a conventional heavy truck.
The following is a reproduction of the summary of research focusing on overtaking safety of long combinations vehicles published by VTI, the Swedish National Road and Transport Research Institute Summary of report (Andersson 2011).
The purpose of this report is to investigate if the introduction of extra-long and heavy vehicles has an effect on traffic safety on Swedish roads, especially in relation to overtaking. Traffic safety effects will be measured by road user behaviors in terms of speed and accelerations and time slots. Road user experiences and heavy truck drivers' experiences will also be studied. The traffic conflict technique (Almqvist, 2006; Ekman, 1996; Hydén, 1987; Svensson, 1998) presents how time-to-collision and speed are related to accidents and near accidents. The traffic conflict technique will be used as a starting point for the discussion on how the introduction of extra-long trucks might affect traffic safety.
The report presents four empirical studies: a focus group interview study with heavy truck drivers, an interview study with extra-long truck drivers, a simulator study and a field study. The simulator study and the field study focuses on overtaking.
The purpose of the focus group interview is to investigate if the heavy truck drivers (that do not drive the extra-long trucks) might have an opinion on how extra-long vehicles could have an impact on traffic safety. The purpose of the interview of extra-long truck drivers is to grasp the experiences they have of the extra-long trucks. Truck drivers that do not drive the extra-long trucks believe that the introduction of extra-long trucks will create a number of traffic safety problems especially in terms of conflict with ordinary road users. The drivers of extra-long trucks do not experience the problems that ordinary truck drivers predict. The problems they experience can be taken care of with more planning (thinking ahead). They also believe that the traffic sign on the back of the extra-long vehicle has a positive effect. The truck company, working environment and truck equipment are other important aspects mentioned by the extra-long truck drivers [sic].
The simulator study investigates over taking situations on a 2+1-road, with extra-long trucks (30 m) and an ordinary truck (18.75 m). The results reveal that the distance from the back of the truck to the point where only one lane exists affects car drivers' decision to overtake, independently of truck length. If the back of the truck is in the same position, the time slot for a safe overtaking was reduced significantly for extra-long trucks compared to ordinary trucks. Overtaking speed was, however, the same (approximately 117 km/h).
The field study also assesses overtaking situations with an extra-long vehicle (30 m) (with a license to drive on a specific road) and a reference vehicle (24 m), on a 2+1 road and an ordinary two-lane road. Overtaking vehicles were filmed with the purpose to measure overtaking behavior but also in order to be able to contact the road users by telephone. The overtaking personal car drivers did not experience a traffic safety conflict on the road at hand. They did not even remember overtaking an extra-long vehicle. The number of data points was relatively few, especially for the reference vehicle. No significant differences were obtained for overtaking speed or time slots. The overtaking speed was, however, relatively high for both trucks. On the other hand, video analyses revealed a small overrepresentation of critical time slots for critical overtaking of the extra-long trucks on a normal road, but not for the 2+1 road.
A.7 Addendum to the Desk Scan - Truck Crashes Involving Barriers
Following the submission of the draft desk scan, the FHWA subject matter experts asked the study team to review two references related to heavy truck crashes and barriers. Provided in this addendum are those reviews. The safety team is aware of the consequences of a heavy truck crash that penetrates a barrier, especially a median barrier, in which the crash results in a collision with an oncoming vehicle. As part of the proposed crash analysis, we will explore differences in the frequencies and rates of multiple collision types, including barrier-related collisions. We will document any differences in these measures between proposed truck configurations and the baseline configurations. The limitation on any collision-type analysis will likely be sample size, e.g., there may be too few truck-involved barrier-related crashes to develop definitive results. More extensive analyses may be conducted with a diagnostic review of crash reports or through the use of finite element analysis. However, pursuit of such options need to be discussed with FHWA in terms of specific objectives, likelihood of success in accomplishing those objectives, cost, and schedule.
Reference Review 1
Gabauer, D. J., (2012), Real-World Barrier Performance of Longitudinal Barriers Struck by Large Trucks, TRR 2309, Transportation Research Board, Washington D.C., p127-134.
The authors seek to identify the performance of barriers when impacted by large trucks as measured by various crash databases including the Large Truck Crash Causation Study (LTCCS), Fatality Analysis System (FARS 2000 through 2009) and the General Estimates System (GES for years 2000 through 2009). Among the metrics used are: barrier crash and fatal crash involvement rates and the impact performance of barriers specifically designed for large trucks and those not designed for large trucks. Different search criteria are used in each database to identify the relevant crashes to be used for analysis. The criteria used to identify barrier crashes may be of interest to the team in identifying the sample size of barrier-related events in our data sets. Exposure data were drawn from annual summaries provided by FHWA.
The databases used were adequate for the analyses undertaken by Dr. Gabauer, but contain insufficient detail for use in the current CTSWL study to assess the crash experience of specific vehicle configurations at different weights. The crash data used in this study (with the exception of LTCCS) does not contain vehicle configuration or weight data.
The focus is on barrier performance but vehicle weight and length are not explicitly included in the analysis. Barrier penetration was assessed using a dichotomous variable: 1 if penetrated and 0 if not. LTCCS analyses aggregated vehicle type in two classes: single unit and tractor-trailer. A logistic regression was used with LTCCS data to estimate the proportion of barriers penetrated. Barrier type was the only predictor of stated significance (see Table 6 in reference). This modeling is described in a summary manner and important measures of model performance such as the receiver operating characteristic curve are not included.
Crash and fatality rates were computed per year for single-unit trucks and tractor semitrailers and compared with light trucks and vans and cars (and motorcycles). The use of crash rates measured over time, while interesting, does not provide keen insights concerning vehicle performance differences, which are of relevance to the CTSW team.
For the purposes of the CTSWL study, the results of this paper are of limited use. The truck descriptions are at a level of aggregation that does not permit identification of even baseline vehicles, let alone future configurations. So the study is useful in general, but does not provide the specificity needed to contribute quantitatively to the CTSWL study.
Reference Review 2
Knipling, RR, P Waller, RC Peck, R Pfefer, TR Neuman, KL Slack, and KK Hardy, (2004), NCHRP 500, volume 13, A Guide for Reducing Collisions Involving Heavy Trucks, Transportation research Board, Washington, D.C.,
The goal of the NCHRP 500 series is to reduce highway deaths. Volume 13 of the series focuses on countermeasures to reduce large truck involvement in these fatalities. To reduce the number of heavy-truck fatality crashes, the study recommends actions including the following:
- Reduce truck driver fatigue
- Strengthen commercial driver's license (CDL) requirements and enforcement
- Increase public knowledge about sharing the road
- Improve maintenance of heavy trucks
- Identify and correct unsafe roadway and operational characteristics
- Improve and enhance truck safety data
- Promote industry safety initiatives
The focus of the volume is clearly on countermeasures and particularly on countermeasures that have already been implemented. As such, it is not directly related to the safety of larger and heavier vehicles. In a detailed description of the problem, however, truck weight is specifically mentioned in terms of the disparity between the weight of trucks involved in fatal crashes (from one study over half weighed in excess of 60,000lb) and the weight of passenger vehicles (given as typically less than 5,000lb).
A set of strategies (Objective 12.1E in the reference) are proposed that seek to identify and correct unsafe roadway infrastructure and operational characteristics These roadways strategies are stated as being focused on impacting the speed of trucks or overcome loss of control due to excessive speed (Page V-38 of report). Barriers, particularly those designed for heavy trucks are specifically mentioned as a countermeasure to reduce heavy vehicle road departures, particularly to the left of the road.
You may need the Adobe® Reader® to view the PDFs on this page.
previous | next