Comprehensive Truck Size and Weight Limits Study - Compliance Comparative Analysis Technical Report
Chapter 3: Compliance Effectiveness of Enforcement
3.1 Scope
This chapter documents the results from the effectiveness of enforcement analysis. The purpose of this work is to compare the effectiveness of enforcing TSW limits for trucks operating at or below current Federal truck weight limits and trucks operating above those limits. Specifically, the objectives of the work are to:
- Analyze effectiveness at the national level in terms of enforcement program outputs (e.g., weighings, citations) and pertinent relationships between certain outputs and the program inputs discussed in Chapter 2;
- Analyze truck size and weight enforcement effectiveness for States where trucks operate above Federal limits as compared with enforcement effectiveness among States that adopt Federal truck weight limits; and
- Analyze effectiveness by assessing compliance outcomes for the alternative truck configurations and estimate these outcomes for the scenarios.
In addition, this work identifies statutes and regulations pertaining to Federal truck size and weight limits that would be impacted in the event of changes to these limits. These impacts are summarized at the end of Section 3.3, with details provided in Appendix D.
The scope of analysis for this work is constrained as follows:
- The base analysis year for the 2014 CTSW Study is 2011. To capture annual trends in enforcement program outputs, the analysis includes data reflecting program inputs and outputs from 2008 through 2012, thereby using the most current, reliable data available.
- This work focuses on effectiveness related to enforcing truck weight; less emphasis is placed on truck size enforcement
- The work supports the comparative analysis of commercial motor vehicles that operate at or below 80,000 pound gross vehicle weight, 20,000 pound single axle weight, 34,000 pound tandem axle weight, and at or below weight limits as calculated through the Federal Bridge Formula as provided in Title 23 of the United States Code under Section 127. Exemptions to the size and weight limits stated and provided in 23 USC Section 127 that allow alternative configuration characteristics are to be treated as “vehicles operating in excess of Federal size and weight limits.” Similarly, vehicles operating under a State-issued permit, including all divisible or non-divisible load movements, are to be treated as “vehicles operating in excess of Federal size and weight limits.”
For the purposes of this work, the following terms are defined:
- Weighing: A weighing is the process of using a certified weight measuring device to assess a commercial motor vehicle being used for highway transport for compliance with applicable commercial motor vehicle weight regulations. A weighing may be conducted statically or dynamically.
- Weight violation: A weight violation occurs when a commercial motor vehicle being used for highway transport is found to be in non-compliance with one or more of the weight regulations governing commercial motor vehicle operations. A weight violation may or may not lead to the issuance of a weight citation, as a vehicle may be brought into compliance by offloading or load shifting. The industry and the literature frequently use the terms “violation” and “citation” interchangeably.
- Weight citation: A weight citation occurs when a legal summons is issued due to the observance of one or more weight violations.
- Weight-compliant event: A weight-compliant event occurs when a commercial motor vehicle being used for highway transport is subject to a weighing and is found to be in compliance with all weight regulations governing commercial motor vehicle operations.
3.2 Methodology
As described in Chapter 1, enforcement program effectiveness is considered in terms of outputs and outcomes within the performance-based approach applied in this study. Within the context of this over-arching study approach, this section provides specific details about the methodology and data applied for each of the three objectives. The methodology applied in this study extends the results of the previous 2000 CTSW Study (see U.S. Department of Transportation 2000) in three main ways. First, it provides an updated analysis of enforcement program activities (i.e., outputs) at the national level. Second, it establishes output-based relationships that can be used to describe and compare enforcement program effectiveness. Finally, it analyzes WIM data to assess truck weight compliance for the alternative truck configurations and uses the results of this assessment to estimate the compliance impacts of introducing these configurations into the traffic stream.
National-Level Output Trends and Relationships
The measures of enforcement program output included in this component of the analysis are the number of truck weighings (by type of weighing method), citations (by type of citation), load shifting and off-loading requirements, and permit issuance activities. In addition, the analysis develops three pertinent output-based relationships of enforcement effectiveness: weighing cost-efficiency, citation rate, and citation rate as a function of enforcement intensity. Another relationship that could provide an output-based understanding of enforcement effectiveness is the impact that the level of sanctions (or severity of the penalty) has on the number of citations. For example, to reduce the number of citations, it may be more effective to increase the amount of fines violators are subject to rather than increase the intensity of enforcement by weighing more vehicles. Investigation of this relationship, however, is beyond the scope of this study.
The Annual Certifications of Truck Size and Weight Enforcement database contains data reported by States for each of these output measures and is the primary data source used to analyze enforcement program outputs. Data from 2008 to 2012 are included in the analysis. The following limitations apply to the data:
- The Federal regulations that require States to certify the enforcement of Federal truck size and weight laws do not explicitly define the vehicles that fall within the scope of TSW enforcement activities. It is understood, however, that the types of vehicles included in the scope of TSW enforcement activities generally coincide with the definition of a commercial motor vehicle. According to the 23 CFR Part 658, a commercial motor vehicle is “a motor vehicle designed or regularly used to carry freight, merchandise, or more than ten passengers, whether loaded or empty, including buses, but not including vehicles used for vanpools, or recreational vehicles operating under their own power.” [3] While this definition includes passenger-carrying vehicles, these represent a negligible proportion of vehicles subject to weighings in most States. In fact, passenger-carrying vehicles are generally not required to stop at weigh stations simply because they have passengers on board and there is concern with delaying the passengers. In addition, some States may include recreational vehicles and various types of light duty trucks within the scope of their weight enforcement activities. For these reasons, there may be inconsistencies in the data submitted by the States.
- The Federal regulations that require States to certify the enforcement of Federal truck size and weight laws do not provide a clear distinction between violations and citations. As defined earlier, it is impossible to have a citation without a violation. However, a vehicle found to be in violation may result in a citation, multiple citations (corresponding to multiple violations), or no citations. The regulations themselves also appear to use the terms “violation” and “citation” interchangeably. For these reasons, there may be inconsistencies in the data submitted by the States.
- The Federal regulations that require States to certify the enforcement of Federal truck size and weight laws do not specify whether the reported number of weighings by WIMs should include only those WIMs used within a State’s TSW enforcement program, or also WIMs used within a State’s traffic monitoring program. It is generally understood that most States only report weighings by WIMs used specifically for TSW enforcement purposes.
- None of the data contained in the Annual Certifications of Truck Size and Weight Enforcement database can be disaggregated by truck configuration. This precludes the analysis of weighings and citations for the specific control vehicles and alternative truck configurations of interest in the 2014 CTSW Study. The citations recorded in the database cannot be attributed to a specific enforcement method (i.e., fixed, portable), industry, commodity, or time period (other than calendar year). In addition, the actual axle or gross vehicle loads that triggered the issuance of a citation, shifting of the load, or off-loading are not recorded.
Figure 8 provides a diagrammatic view of how weighings lead to citations, which are ultimately recorded in the Annual Certifications of Truck Size and Weight Enforcement database. There are two types of weighings: those that occur while the vehicle is stopped (i.e., static weighings at fixed, portable, or semi-portable scales) and those that occur while the vehicle is in motion (i.e., dynamic weighings at WIM sites).
Figure 8: Weighings, Weight Violations, and Weight Citations
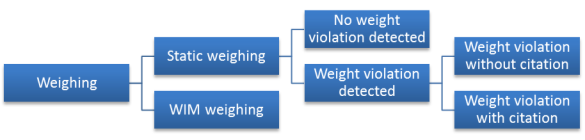
Currently, WIM weighings are not used to directly enforce truck weight in the United States, though they are an important component of the weight enforcement process. Some fixed truck weight and inspection sites have sorter lanes that all trucks are required to follow. The sorter lanes include WIM devices that have computer software capable of alerting a law enforcement officer monitoring the equipment when a truck exceeds axle, gross weight, or bridge formula requirements. The officer will direct the truck exceeding one or more of the weight parameters to a fixed static scale to verify the weight identified by the WIM device. Some WIM devices are also used for truck weight enforcement on the open highway. When a WIM device identifies that a passing truck exceeds its weight requirements, the device signals an enforcement response. Law enforcement personnel will track the truck and either direct the truck to a site where portable scales can be deployed or to a fixed weigh site to verify the weight.
While direct enforcement using WIM remains a goal for some jurisdictions, there are technological and legal issues associated with issuing a citation based on the comparison of a dynamically measured weight and a static weight limit. Thus, only static weighings result in the detection of weight violations that can be issued a citation.
A static weighing has two possible outcomes: either no weight violation is detected and the vehicle is deemed to be weight compliant, or at least one type of weight violation (axle, gross, or bridge formula) is detected and the vehicle is deemed to be weight non-compliant. The subset of vehicles deemed to be in violation (weight non-compliant) may then be required to offload, have load adjustments made, or may be issued a citation and be placed out of service until other equipment can be summoned to take part of the load. Thus, while the issuance of a citation can only take place following the (static) detection of a weight violation, not all weight violations lead to citations if the vehicle is brought into compliance by offloading or load shifting. Further, as noted earlier, there may not be a one-to-one relationship between weight citations and weight violations, as a single citation may be issued for a single weight violation or may represent multiple weight violations on the same vehicle.
State-Level Comparative Analysis
This component of the analysis for this work compares the effectiveness of TSW enforcement programs for States that allow vehicles in excess of Federal truck weight limits (i.e., above-limit States) and States that do not allow vehicles in excess of Federal limits (i.e., at-limit States). For this comparison, the relationship between citation rate and enforcement intensity is examined separately for at-limit and above-limit States with the aim of determining whether differences in this relationship are apparent at the State level. As such, this comparison can be understood as a way of revealing potential variations in enforcement effectiveness based on vehicle-specific differences. As with the cost analysis, the designation of States as at-limit and above-limit considers three information sources:
- Relevant TSW regulations pertaining to single-semitrailer and multiple trailer trucks operating in each State (e.g., 23 CFR 658, Appendix C) indicate whether a State may be effectively at-limit or above-limit. For example, States that routinely permit triple trailer combinations on Interstate highways may be designated as above-limit States.
- Estimated 2011 vehicle-miles traveled (VMT) for the scenarios’ alternative truck configurations (e.g., six-axle tractor semitrailers, triple trailer combinations) provides an indication of the extent above-limit trucks operate in a State by highway network type. For example, States where six-axle semitrailers commonly operate above 80,000 lb. GVW (other than those where a single-trip permit may be required) may be designated as above-limit.
- Insights from commercial motor vehicle State enforcement officials provide an experiential indication of whether a State may be designated as at-limit or above-limit.
As such, this comparison does not account for State-specific variations in enforcement program delivery and permitting activities, nor does it fully consider the extent to which each truck configuration is allowed to operate within a State. Nevertheless, the comparison provides a pragmatic approach for identifying potential differences in enforcement program effectiveness associated with enforcing different types of truck configurations.
The scope of the comparative analysis includes the 29 comparison States, although specific State names are withheld. Based on these information sources for the purpose of this comparative analysis, 13 of the 29 comparison States are designated as at-limit and 16 as above-limit. As indicated earlier, the 29 comparison States were selected because they: (1) are considered to be enforcement programming leaders in the Nation; (2) have experience in enforcing vehicles subject to grandfather provisions (e.g., longer combination vehicles); or (3) have recently undertaken research and development projects related to TSW enforcement. In addition, the selection of these States considered the need to represent general variations in trucking operations across the Nation (e.g., configurations in use, industries served) and geographic factors.
Assessment of Compliance Outcomes for the Alternative Truck Configurations
Beyond the analysis of outputs, enforcement effectiveness can also be understood in terms of enforcement program outcomes. This component of the work assesses truck weight compliance outcomes (in terms of the proportion of weight-compliant observations and the severity of overweight observations) at a vehicle-specific level using WIM data at selected locations. Comparing the distributions of axle and gross vehicle loads with static weight limits enables the assessment of truck weight compliance for certain control and alternative truck configurations. The following paragraphs describe the data and methodology applied for these comparisons.
Weigh-in-motion devices measure the axle weights (and by summing these, the GVW), the spacing of these axles, and speed of a passing vehicle without requiring the vehicle to stop. Extensive deployment of WIM systems throughout the United States for both enforcement purposes and transportation planning and engineering functions (e.g., pavement and bridge design) has resulted in a rich, often continuous information source about truck operations over extensive highway networks. Because WIM measurements are dynamic, they currently do not provide sufficient grounds for issuing a legal citation for operating an overweight commercial vehicle in the United States. Nevertheless, WIM devices play a role in the effectiveness of truck weight enforcement by providing a screening mechanism that reduces the number of trucks that must be targeted for static weighings.
As described in Chapter 2, the most common technologies used in WIM devices are piezoelectric sensors, piezoquartz sensors, bending plates, and single load cells. The accuracy of the weights measured by a WIM device varies by the type of technology as well as a number of installation, calibration, and environmental factors. According to ASTM E1318-09 (ASTM International, 2009), depending on the intended function of the WIM, a properly installed and calibrated WIM device should provide load measurements (95 percent of the time):
- Between ±15 percent and ±30 percent relative to a reference value for axle loads;
- Between ±10 percent and ±20 percent relative to a reference value for axle group loads; and
- Between ±6 percent and ±15 percent relative to a reference value for gross vehicle loads.
The Federally managed WIM database comprises State data submitted monthly to the Federal Highway Administration (FHWA). These State submissions for 2011 are the source of the WIM data used in the compliance assessment. The Study directs a comparative analysis of the weight compliance for control vehicles currently in widespread operation across the United States relative to alternative truck configurations (with specified axle configurations, GVW limits, and trailer lengths). Thus, the compliance assessment requires WIM data obtained from sites at which both a control vehicle and an alternative truck configuration are currently operating. This requirement is the primary criterion applied to determine the eligibility of WIM sites included in the compliance assessment. In addition to this primary criterion, several other factors were considered in the selection of WIM sites for the compliance assessment, but their influence was not quantified or fully controlled:
- The weights measured by a WIM device in close proximity to a fixed weigh scale or other locations subject to frequent or intense weight enforcement activity may be influenced by the presence of this activity. This influence may vary temporally and by highway functional class.
- The weights measured by a WIM device located on a portion of a highway network in a particular State in which alternative truck configurations operate may be influenced by weight limits in neighboring States if the neighboring State prohibits or restricts these configurations. The same type of influence could be present at WIM sites located near urban areas if special prohibitions or restrictions exist for specific configurations in that urban area.
- The types of industries that generate the demand for truck travel vary geographically and temporally. The specific characteristics of the commodities generated by these industries influence the weights measured by WIMs in those regions. In addition, at certain locations, special weight allowances exist for trucks hauling certain types of commodities.
- Trucks operating under special permit may be more likely to operate on certain routes than others, but cannot be identified within the WIM database. Because these vehicles are subject to higher weight limits, their presence in the traffic stream influences the WIM measurements used in this compliance assessment if they operate with the same configuration as the control vehicles or alternative truck configurations being examined.
Table 12 lists the vehicle-specific comparisons and indicates whether or not the comparison is included in the compliance assessment. As shown in the table, the assessment includes two comparisons involving single-semitrailer trucks.
- Five-axle tractor semitrailer (53 ft.) at 80,000 lbs. (control vehicle) and the six-axle tractor semitrailer (53 ft.) at 91,000 lb: This comparison (Comparison 1) uses WIM data from the State of Washington. Table 13 provides the details on the applicable axle weight and GVW limits in Washington. The GVW limit for six-axle tractor semitrailers is controlled by the bridge formula but would typically be limited to 92,000 lb. This differs slightly from the GVW limit for the alternative configuration, but is not expected to influence the comparative compliance assessment.
- Five-axle tractor semitrailer (53 ft.) at 80,000 lbs. (control vehicle) and six-axle tractor semitrailer (53 ft.) at 97,000 lbs: This comparison uses WIM data from Maine and comprises two components: data from the Interstate System (Comparison 2a) and data from off the Interstate System (Comparison 2b). Table 13 provides the details on the applicable axle weight and GVW limits in Maine. Comparisons 2a and 2b account for the differences between the tandem axle weight limits on and off the Interstates. The GVW limit for six-axle tractor semitrailers is 100,000 lbs., which differs from the GVW limit for the alternative configuration; however, this difference is not expected to influence the comparative compliance assessment.
| State and Configuration | Weight Limits on Interstate (pounds) | Weight Limits off Interstate (pounds) | ||||
|---|---|---|---|---|---|---|
| Tandem Axle | Tridem Axle | GVW | Tandem Axle | Tridem Axle | GVW | |
| Comparison 1 (Washington) | ||||||
| Control Vehicle 3-S2 @ 80K lb. (53’) | 34,000 | n/a | Bridge formula (typically 80,000) | 34,000 | n/a | Bridge formula (typically 80,000) |
| Alternative Configuration 3-S3 @ 91K lb. (53’) | 34,000 | Bridge formula (typically 45,000) 1 | Bridge formula (typically 92,000) | 34,000 | Bridge formula (typically 45,000) 1 | Bridge formula (typically 92,000) |
| Comparisons 2a and 2b (Maine) | ||||||
| Control Vehicle 3-S2 @ 80K lb. (53’) | 34,000 | n/a | 80,000 | 38,000 | n/a | 80,000 |
| Alternative Configuration 3-S3 @ 97K lb. (53’) | 44,000 2 | 54,000 3 | 100,000 | 44,000 2 | 54,000 3 | 100,000 |
1 In Washington State, a typical tridem axle has a maximum 12-ft spread and is therefore limited to 45,000 pounds by the bridge formula.
2 This limit applies for certain commodities. The tandem axle weight limit for other commodities is 41,000 lb.
3 This limit applies for certain commodities. The tridem axle weight limit for other commodities is 48,000 lb.
As shown in Table 14, the assessment also includes two comparisons involving multi-trailer trucks.
- Five-axle tractor semitrailer with two 28.5-ft. trailers at 80,000 lbs. (control vehicle) and seven-axle tractor with three 28.5-ft. trailers at 105,500 lbs.: This comparison (Comparison 3) uses WIM data from Oregon. Table 14 provides the details on the applicable axle weight and GVW limits in Oregon.
- Five-axle tractor semitrailer with two 28.5-ft. trailers at 80,000 lb. (control vehicle) and seven-axle tractor with three 28.5-ft. trailers at 129,000 lb.: This comparison (Comparison 4) uses the same seven-axle triple trailer configuration as in the previous comparison, even though the alternative 129,000-lb. configuration has nine axles. The seven-axle configuration is used because it currently operates in Nevada and Utah; the nine-axle configuration is not commonly used. The comparison uses WIM data from Nevada and Utah. Table 14 provides the details on the applicable axle weight and GVW limits in these States.
| State and Configuration | Weight Limits on Interstate (pounds) | Weight Limits off Interstate (pounds) | ||
|---|---|---|---|---|
| Single Axle 1 | GVW | Single Axle 1 | GVW | |
| Comparison 3 (Oregon) | ||||
| Control Vehicle 2-S1-2 @ 80K lb. (2 x 28.5’) | 20,000 | Bridge formula up to 105,500, but must have permit above 80,000 | 20,000 | Bridge formula up to 105,500, but must have permit above 80,000 |
| Alternative Configuration 2-S1-2-2 @ 105K lb. (3 x 28.5’) | 20,000 | Bridge formula up to 105,500 (under annual permit) | 20,000 | Bridge formula up to 105,500 (under annual permit) |
| Comparison 4 (Nevada and Utah) | ||||
| Control Vehicle 2-S1-2 @ 80K lb. (2 x 28.5’) | 20,000 | 80,000 2 | 20,000 | 80,000 2 |
| Alternative Configuration 2-S1-2-2 @ 129K lb. (3 x 28.5’) | 20,000 | 129,000 | 20,000 | 129,000 |
1 This limit may be governed by the tire manufacturer’s rating.
2 In Utah, this vehicle may operate between 80,000 and 112,000 lb. (depending on the bridge formula). Practically, however, the configuration would typically operate within 80,000 lb. to enable interstate moves.
Two comparisons are not included in the compliance assessment. Comparison of the five-axle tractor semitrailer (53 ft.) at 80,000 lbs. (control vehicle) with the same configuration at 88,000 lb. is not included because it is not possible to distinguish the subset of five-axle tractor semitrailers that would be subject to the higher weight limit. The comparison of the five-axle tractor with two 28.5-ft. trailers at 80,000 lbs. (control vehicle) with the alternative truck configuration with two 33-ft. trailers is not feasible because the alternative configuration is not currently in use in the United States.
At the selected WIM locations, the configurations being compared are isolated from the WIM dataset using axle-based vehicle classification algorithms. Then, cumulative probability distributions are used to analyze the loads for each axle group (i.e., single, tandem, tridem, as appropriate for each configuration) and the gross vehicle load. These distributions facilitate the compliance assessment using the following performance measures:[4]
- Gross vehicle weight-compliant, proportion: the fraction (or percentage) of the gross vehicle weight observations which is less than (or equal to) the legal (static) gross vehicle weight limit.
- Gross vehicle overweight, severity: the extent (in pounds) to which average measured gross vehicle weights for the observed subset of overweight trucks exceeds the legal (static) gross vehicle weight limit.
- Single-axle weight-compliant, proportion: the fraction (or percentage) of the single-axle weight observations which is less than (or equal to) the legal (static) single-axle weight limit.
- Single-axle overweight, severity: the extent (in pounds) to which average measured single-axle weights for the observed subset overweight single axles exceeds the legal (static) single-axle weight limit.
- Tandem-axle weight-compliant, proportion: the fraction (or percentage) of the tandem-axle weight observations which is less than (or equal to) the legal (static) tandem-axle weight limit.
- Tandem-axle overweight, severity: the extent (in pounds) to which average measured tandem-axle weights for the observed subset of overweight tandem axles exceeds the legal (static) tandem-axle weight limit.
- Tridem-axle weight-compliant, proportion: the fraction (or percentage) of the tridem-axle weight observations which is less than (or equal to) the legal (static) tridem-axle weight limit.
- Tridem-axle overweight, severity: the extent (in pounds) to which average measured tridem-axle weights for the observed subset of overweight tridem axles exceeds the legal (static) tridem-axle weight limit.
When assessing truck weight compliance using WIM data, it is important to note two issues that arise because of the nature of the WIM measurements. First, as stated earlier, WIM devices measure axle weights while trucks are in motion and are therefore subject to the dynamic interactions between the vehicle and the road. As such, an overweight observation by a WIM may not result in an overweight observation if the same axle (or truck) is weighed on a static scale. Because of this, the analysis differentiates between an overweight observation as recorded by a WIM and a violation or citation, which normally arises from a static weighing with reference to a legal (static) load limit. For the same reasons, a weight-compliant observation by a WIM cannot be unequivocally deemed to be in compliance with applicable weight laws. The definitions of the performance measures used in the compliance assessment reflect these realities.
Second, because most WIM scales are not selective about the trucks they weigh (i.e., a WIM scale does not target a vehicle for weighing based on the likelihood that it is overweight), the proportion and severity of overweight observations is representative of all trucks passing over the scale during the observation period. In contrast, the proportion and severity of overweight observations at portable scales or even a static weigh scale could reflect targeting of trucks likely to be overweight. By extension, it is incorrect to assume that the proportion of weight-compliant vehicles observed at a WIM scale is the same as that observed at portable or static weigh scales.
Despite these inherent issues and the uncontrolled factors identified above, the WIM data allow the USDOT study team to conduct the necessary vehicle-specific compliance assessments to formulate pragmatic insights. In particular, by conducting the vehicle-specific compliance comparisons at the same WIM sites, the assessment limits the influence of some of these issues and factors. For example, while WIM calibration may vary in time and the local level of enforcement intensity may impact the axle weights observed at the WIM, these effects are expected to be largely independent of vehicle configuration.
The four comparisons provide the proportion of compliant GVW observations for four of the six alternative truck configurations introduced into the traffic stream through the applicable scenarios (i.e., Scenarios 2, 3, 5, and 6). This component of the analysis assumes that these proportions, which were observed at locations which facilitated direct comparisons of the control and alternative truck configurations, are applicable under base case and scenario traffic conditions. To extend these results to the scenarios and apply them to the VMT estimates for the control and alternative truck configurations in these scenarios, the analysis assumes that the compliant GVW proportions observed at the selected sites (i.e., specific points on the network) also apply across the network as a whole. In other words, this assumption considers the compliant proportion of GVW observations measured at a point to be the same as the weight-compliant proportion of VMT for the control and alternative truck configurations that would be observed over the network. Following these assumptions, for each of the four scenarios, the analysis calculates the total (combined) proportion of weight-compliant VMT for the control vehicle and alternative truck configuration for the base case and compares this to the total (combined) proportion of weight-compliant VMT of the same two configurations under the scenario traffic conditions. Thus, the scenario analysis reveals the system-wide impacts on enforcement effectiveness—as measured by compliance outcomes—that could result from the introduction of the alternative truck configurations into the traffic stream.
3.3 Results
This results section:
- Summarizes national-level truck weight enforcement program output trends and develops and examines pertinent relationships between certain outputs and program inputs.
- Compares the effectiveness of TSW enforcement programs for States that allow vehicles in excess of Federal truck weight limits (i.e., above-limit States) and States that do not allow vehicles in excess of Federal limits (i.e., at-limit States) using a State-level analysis.
- Analyzes enforcement effectiveness by assessing truck weight compliance outcomes (in terms of the proportion of weight-compliant observations and the severity of overweight observations) at a vehicle-specific level using WIM data at selected locations.
- Identifies statutes and regulations pertaining to Federal truck size and weight limits that would be impacted in the event of changes to these limits.
National-Level Output Trends and Relationships
This section summarizes national-level truck weight enforcement program outputs, including:
- Weighings by type (i.e., weighings at fixed, semi-portable, portable, and WIM scales);
- Citations by type (i.e., axle weight, GVW, and bridge formula);
- Number of load shifting and offloading vehicles; and
- Overweight permits issued by type (i.e., divisible, non-divisible, trip, and annual permits).
The Annual Certifications of Truck Size and Weight Enforcement database contains data reported by States for each of these output measures. A total of 50 States report data, including the 49 jurisdictions in the contiguous United States and Alaska. However, there are instances where certain data elements may be unavailable for specific States in a particular year. The following analysis first summarizes the output statistics for all the States that reported in each year from 2008 through 2012. Then, to facilitate a more reliable and detailed understanding of annual changes and trends, the analysis examines data from a subset of 44 States for which a complete set of data were available in each year.
In addition, the discussion develops three pertinent effectiveness relationships: the weighing cost efficiency (calculated as non-WIM weighings per personnel cost), the citation rate (calculated as citations per non-WIM weighing), and the relationship between citation rate and enforcement intensity (calculated as weighings per truck VMT). These relationships provide an output-based perspective of program effectiveness.
Nationwide Enforcement Program Outputs
Table 15 summarizes the nationwide annual outputs of State enforcement programs from 2008 through 2012 as reported in the Annual Certifications of Truck Size and Weight Enforcement database. Output data were unavailable for four States in 2008 and three States in 2012. On average, all States combined reported conducting a total of approximately 188 million weighings annually, of which over 60 percent were conducted by a WIM device. States issued an average of approximately 865,000 weight-related citations (GVW, axle, and bridge) annually during this time period, and approximately 73,000 size-related citations annually. An average of approximately 324,000 vehicles were required each year to shift loads or off-load cargo as a result of a weighing that indicated a weight violation. Finally, States issued an average of about 4.8 million permits each year for oversize and overweight loads.
In general, these output data (without normalizing for the different number of reporting States) indicate year-to-year decreases in the level of enforcement activity over this time period. Specifically, the number of reported total weighings (non-WIM and WIM weighings) was lower in 2012 than in 2008, and was at its lowest level in 2009. Similarly, the total number of weight and size citations dropped from 2008 to 2012, as did the number of vehicles required to shift loads or offload cargo and the number of permits issued for oversize and overweight loads. By comparison, trends in the level of resources dedicated to enforcement personnel over this same period peaked in 2010 before stabilizing at approximately 2010 values in 2011 and 2012. The impact of the national recession and the stress on state budgets is evident when viewing these trends.
Table 16 normalizes the weighings data for the 44 States which reported total (non-zero) weighings in each year from 2008 through 2012. This normalized data reduces potential bias in the annual changes and trends evident from the data resulting from differences in the number of States for which data were available in each year. The normalized analysis first examines weighings and citations and then considers permitting for oversize and overweight loads. Based on these values, the total reported number of weighings decreased from 2008 to 2012, from a maximum value of 196 million in 2008 to 180 million in 2012. The largest year-to-year decrease occurred from 2008 to 2009, when the total number of reported weighings declined to approximately 177 million from 196 million. Since 2009, the total number of reported weighings fluctuated between 177 million and 183 million annually.
Fixed platform weighings accounted for between 35 and 40 percent of the total number of weighings in each year, and nearly all (about 99 percent) of the non-WIM weighings in each year. The number of fixed platform weighings decreased by 22 percent from 2008 to 2009 before exhibiting more moderate fluctuations from 2009 to 2012. Portable weighings represented less than one percent of total non-WIM weighings in each year. Year-to-year, the number of portable weighings exhibited a pattern similar to the number of fixed platform weighings. Semi-portable weighings also accounted for less than 1 percent of total non-WIM weighings in each year. Unlike the trends observed for fixed platform and portable weighings, the number of weighings using semi-portable scales peaked in 2009 and has subsequently declined each year since then, with a 24 percent decrease between 2011 and 2012. WIM weighings accounted for between 60 and 65 percent of the total number of weighings in each year. The number of WIM weighings decreased by 10 percent from 2008 to 2009 and remained at approximately 2009 levels through 2012.
| Scale Type | Nationwide Number of Weighings by Year 1Percent Change of Weighings from Previous Year | ||||
|---|---|---|---|---|---|
| 2008 | 2009 | 2010 | 2011 | 2012 | |
| Fixed platform | 79,171,055 | 64,664,598 | 69,141,343 | 64,354,898 | 71,493,875 |
| -22% | 6% | -7% | 10% | ||
| Portable | 582,626 | 512,342 | 554,788 | 521,894 | 554,514 |
| -14% | 8% | -6% | 6% | ||
| Semi-portable | 353,984 | 373,716 | 350,998 | 328,544 | 264,699 |
| 5% | -6% | -7% | -24% | ||
| Total (Non-WIM) | 80,107,665 | 65,550,656 | 70,047,129 | 65,205,336 | 72,313,088 |
| -22% | 6% | -7% | 10% | ||
| WIM | 115,913,985 | 111,897,092 | 113,094,061 | 113,493,183 | 107,793,559 |
| -4% | 1% | 0% | -5% | ||
| Total | 196,021,650 | 177,447,748 | 183,141,190 | 178,698,519 | 180,106,647 |
| -10% | 3% | -2% | 1% | ||
1 The statistics shown in the table are summed for the 44 States that reported total (non-zero) values for each year 2008 through 2012.
Table 17 shows the normalized number of weight citations issued from 2008 through 2012 in the 44 States. Over this time, the total reported number of weight citations decreased from 2008 to 2012, from a maximum value of approximately 1 million in 2008 to about 750,000 in 2012. Year-to-year decreases were particularly evident from 2008 to 2009 and from 2010 to 2011. More specifically, of the total number of weight citations, the proportional distribution of the type of citations in each year remained relatively consistent. Citations for excessive GVW represented nearly 60 percent of the total number of weight citations in each of the 5 years, excessive axle weight citations represented nearly 25 percent of total weight citations, and citations for weights exceeding the bridge formula represented nearly 20 percent of total weight-related citations.
Table 17 also summarizes annual statistics on the number of oversize citations and the number of vehicles required to shift a load or offload cargo as a result of the detection of a weight violation. The number of oversize citations decreased in each year, with the largest decrease occurring from 2010 to 2011. Proportionally, size-related citations consistently represented about 8 percent of the total number of citations (size and weight) issued. Additionally, over the 5 year period, the number of times a vehicle was required to shift a load as a result of a weight violation decreased steadily, while the number of times a vehicle was required to offload cargo remained relatively constant. Load shifting represented more than 80 percent of the total number of load change requirements (shifting plus offloading) in each of the five years.
| Citation Type | Nationwide Number of Citations by Year 1Percent Change of Violations from Previous Year | ||||
|---|---|---|---|---|---|
| 2008 | 2009 | 2010 | 2011 | 2012 | |
| Overweight GVW | 586,921 | 500,572 | 517,621 | 427,699 | 447,705 |
| -17% | 3% | -21% | 4% | ||
| Overweight Axle | 244,797 | 214,872 | 210,320 | 170,128 | 170,473 |
| -14% | -2% | -24% | 0% | ||
| Bridge Formula | 185,695 | 151,502 | 145,790 | 150,794 | 135,743 |
| -23% | -4% | 3% | -11% | ||
| Total Weight | 1,017,413 | 866,946 | 873,731 | 748,621 | 753,921 |
| -17% | 1% | -17% | 1% | ||
| Oversize | 88,369 | 78,814 | 73,162 | 59,913 | 58,797 |
| -12% | -8% | -22% | -2% | ||
| Load shifting vehicles 2 | 329,844 | 300,195 | 266,846 | 232,952 | 223,656 |
| -10% | -12% | -15% | -4% | ||
| Offloading vehicles 2 | 52,572 | 49,830 | 50,219 | 45,937 | 51,344 |
| -6% | 1% | -9% | 11% | ||
1 The statistics shown in the table are summed for the 44 States that reported total (non-zero) values for each year from 2008 through 2012.
2 Vehicles required to shift loads or offload cargo may not be issued a citation.
In addition to weighings and citations, the output of an enforcement program includes permits issued for oversize and overweight loads. Motor carriers transporting non‐divisible, oversize/overweight (OS/OW) freight must first obtain appropriate permits, routing, and approvals from State authorities. Each State is recognized as independent in administering OS/OW permit processes according to its own statutes and regulations. OS/OW permits are the most frequently issued commercial vehicle credential. Some motor carriers apply for multiple OS/OW permits on a daily basis from multiple jurisdictions.
The current TSW regulations are a blend of Federal and State regulations. Federal law controls maximum gross vehicle weights and axle loads on the Interstate System. Current Federal limits are 80,000 lbs. GVW, 20,000 lbs. on a single axle, and 34,000 lbs. on a tandem axle group. The Federal Bridge Formula controls the stresses placed on bridges. When the Federal limits were imposed in 1956, 33 States had laws in effect that allowed higher weights on some highways. Those higher weight limits were “grandfathered” and States were permitted to allow those higher weights on their Interstate highways. Since 1956 many State-specific exemptions, which allow vehicles heavier than Federal weight limits on the Interstate System, have been enacted. These often pertain only to individual commodities or specific highways. All States may issue permits allowing vehicles carrying non-divisible loads to operate above Federal weight limits on the Interstate system, and a majority also has grandfathered authority to issue divisible load permits. Single trip OS/OW permits are valid only for a single trip. Multiple trip OS/OW permits may be issued for a number of trips or set a period of time (often 1 year, hence the term “annual permit”) as each State may determine. Routing for either single trip or multiple trip permits can be either for a specific route or for a network system (AASHTO, 2001).
As per 23 CFR 658.5, a non-divisible load is defined as one that can exceed legal size and weight limits and cannot be reasonably divided, broken down, or dismantled to conform to legal limitations. Certain machinery and electric transformers are good examples of non-divisible loads. A divisible load is defined as one that can be divided, broken down, or dismantled to conform to legal limitations.
Often, certain commodities may be transported under permit at certain times. For example, in Louisiana, sugar cane transported during the harvest season may be hauled by trucks with gross weights up to 100,000 pounds. Also, under Section 1511 of the MAP-21 legislation (Public Law 112-141), special permits for divisible loads are allowed during periods of national emergency if declared by the President under the Robert T. Stafford Disaster Relief and Emergency Assistance Act. Sixteen States have grandfather authority for moving divisible loads above the legal limit on the Interstate System. All States have authority to permit the movement of non-divisible loads on the Interstate System and to permit divisible and non-divisible loads on non-Interstate State highways.
A limited number of States have developed information systems that allow roadside enforcement personnel to electronically validate an OS/OW permit in real-time. Anecdotal information suggests that in States that have deployed automated permitting systems, compliance rates for obtaining OS/OW permits by motor carriers have increased significantly. Proper permitting and routing enhances safety, preserves infrastructure, and can potentially limit the impact of OS/OW movements on the mobility of other vehicles (I-95 Corridor Coalition and FHWA, 2008).
Table 18 shows the normalized number of permits (by permit type) issued from 2008 through 2012 in the 44 States. Over this time, the total reported number of permits increased from a maximum of 4.1 million in 2008 to about 4.2 million in 2012. An 11 percent year-to-year decrease occurred between 2008 and 2009, followed by steady increases from 2010 through 2012. The proportional distribution of total permits issued in each year remained relatively consistent. Non-divisible trip permits accounted for between 80 and 83 percent of total permits in each year, non-divisible annual permits accounted for about 6 percent, divisible trip permits accounted for 6 percent, and divisible annual permits accounted for between 9 and 12 percent.
| Permit Type | Nationwide Number of Permits by Year 1Percent Change of Permits from Previous Year | ||||
|---|---|---|---|---|---|
| 2008 | 2009 | 2010 | 2011 | 2012 | |
| Non-divisible trip | 3,411,636 | 2,987,590 | 3,222,452 | 3,446,444 | 3,490,566 |
| -14% | 7% | 6% | 1% | ||
| Non-divisible annual | 263,082 | 244,736 | 242,776 | 260,290 | 272,939 |
| -7% | -1% | 7% | 5% | ||
| Divisible trip | 65,401 | 89,703 | 79,236 | 97,389 | 88,918 |
| 27% | -13% | 19% | -10% | ||
| Divisible annual | 358,731 | 359,201 | 503,871 | 369,897 | 383,333 |
| 0% | 29% | -36% | 4% | ||
| Total | 4,098,850 | 3,681,230 | 4,048,335 | 4,174,020 | 4,235,756 |
| -11% | 9% | 3% | 1% | ||
1 The statistics shown in the table are summed for the 44 States that reported total (non-zero) values for each year from 2008 to 2012.
Pertinent Effectiveness Relationships
The results of the normalized analysis of enforcement outputs can be used to develop three pertinent output-based relationships that illustrate enforcement effectiveness: weighing cost-efficiency, citation rate, and citation rate as a function of enforcement intensity.
Weighing cost efficiency is a measure of effectiveness that relates program inputs (in terms of personnel costs) to program outputs (in terms of non-WIM weighings). Essentially, weighing cost efficiency indicates the extent of weighing activity completed given the level of financial resources attributed to enforcement personnel.
Table 19 shows the weighing cost efficiency in each year from 2008 to 2012, inclusive. A subset of 35 States which reported both total non-WIM weighings and total personnel costs in each of the 5 years comprise the data reported in the table. Between 2008 and 2010, weighing cost efficiency decreased from 173 to 125 weighings per $1,000 before stabilizing at about this level in 2011 and 2012. Put another way, each non-WIM weighing cost approximately $8 in 2012 compared to less than $6 in 2008 (in 2011 USD).
| Nationwide Weighing Cost-efficiency by Year 1Percent Change from Previous Year | |||||
|---|---|---|---|---|---|
| 2008 | 2009 | 2010 | 2011 | 2012 | |
| Total non-WIM weighings | 65,674,380 | 55,510,405 | 56,431,193 | 53,517,386 | 55,609,799 |
| -18% | 2% | -5% | 4% | ||
| Total personnel costs | $378,727 | $393,267 | $451,025 | $447,520 | $448,117 |
| (thousand 2011 USD) | 4% | 13% | -1% | 0% | |
| Weighing cost-efficiency | 173 | 141 | 125 | 120 | 124 |
| (weighings / thousand 2011 USD) | -23% | -13% | -5% | 4% | |
1 The statistics shown in the table are summed for the 35 States that reported total (non-zero) values for each year from 2008 through 2012.
A citation rate is a measure of effectiveness that relates two program outputs: weighings and citations. Essentially, a citation rate indicates the proportion of weighings (other than weighings by a WIM) that translated into weight citations. It is determined by dividing the total number of weight citations (axle, gross, and Bridge Formula) by the total number of non-WIM weighings. WIM weighings are excluded from this calculation because they are not currently used to issue a citation directly.
Table 20 shows the citation rates in each year from 2008 through 2012. The citation rate in 2008 is 0.013 citations per non-WIM weighing. In other words, about 1.3 percent of vehicles weighed were cited for a weight violation. This rate decreases steadily through 2012 to a value of 0.010 citations per non-WIM weighing.
| Nationwide Citation Statistics by Year 1Percent Change from Previous Year | |||||
|---|---|---|---|---|---|
| 2008 | 2009 | 2010 | 2011 | 2012 | |
| Total weighings | 80,107,665 | 65,550,656 | 70,047,129 | 65,205,336 | 72,313,088 |
| (non-WIM) | -22% | 6% | -7% | 10% | |
| Total weight citations | 1,017,413 | 866,946 | 873,731 | 748,621 | 753,921 |
| -17% | 1% | -17% | 1% | ||
| Citation rate | 0.013 | 0.013 | 0.012 | 0.011 | 0.010 |
| [citations / weighings] | 4% 2 | -6% | -9% | -10% | |
1 The statistics shown in the table are summed for the 44 States that reported total (non-zero) values for each year from 2008 to 2012, inclusive.
2 There is a four percent increase in the citation rate from 2008 to 2009, even though this increase is not apparent from the rounded citation rates.
A citation rate is one indication of enforcement program effectiveness, but interpretation of this rate is somewhat complex. Ultimately, if the enforcement program met its compliance objectives, the citation rate would in theory be zero. This would arise if all weighings indicated weight compliance and could signal an effective enforcement program. However, the likelihood of observing a weight violation that could result in a citation depends on the enforcement method (e.g., fixed, portable), the intensity or frequency of that enforcement, and ultimately the predictability of the weighings being conducted. For example, one might expect a relatively low citation rate if weighings are conducted in a highly predictable way, enabling weight violators to avoid detection. Conversely, a relatively high citation rate could result from a weight enforcement program that is unpredictable in space and time or one which employs targeting strategies to detect violators (or both). Thus, an enforcement program that relies on relatively unpredictable and potentially targeted portable weighings rather than fixed scale weighings could see a relatively high citation rate—an indication of an effective program. Presumably, consistent application of such an unpredictable or targeted program would eventually lead to lower citation rates if the probability of detection and penalty severity was sufficiently high.
Examining the relationship between citation rate and enforcement intensity provides a third perspective on enforcement effectiveness by revealing the impact of the intensity and method of enforcement on citation rates. Factors associated with the industries in a particular region, the commodities hauled and truck configurations used to carry these loads, and temporal considerations may also impact citation rates, but are not examined here.
The data available from the Annual Certifications of Truck Size and Weight Enforcement database enable systematic analysis of the relationship between citation rate and the intensity of weight enforcement in a State, but cannot be used to disaggregate citations by enforcement method (i.e., fixed, portable), industries or commodities, gross truck and axle weight, truck configurations, or temporal variations. As with the national-level analysis, the citation rate for each State is determined by dividing the number of weight citations by the total number of non-WIM weighings. To normalize the number of weighings in each State, enforcement intensity is calculated as the total weighings divided by the total truck miles traveled in each State.
Figure 9 shows the relationship between citation rate and enforcement intensity, where each point represents one State. Essentially, this relationship can be interpreted to suggest that at some point, increases in enforcement intensity (i.e., more weighings per truck VMT) cause no further decrease in the citation rate. In other words, when measuring effectiveness in terms of citation rates, increasing the intensity of enforcement beyond a certain point—approximately 500 weighings per million truck VMT based on the data shown in Figure 9—does not further decrease the citation rate. Presumably, there is a minimum citation rate that can be achieved through on-road enforcement (i.e., the curve approaches some minimum citation rate greater than zero), suggesting that no matter how intense the enforcement, there will always be some inadvertent or intentional violators. The available data suggest that this minimum citation rate may be approximately 0.005 citations per non-WIM weighing (or 0.5 percent).
Figure 9: Citation Rate as a Function of Enforcement Intensity: 2011
![Figure 9 shows the relationship between citation rate and enforcement intensity, where each point represents one State. The figure is organized by citation rate (non-WIM) [citation/weighings] and enforcement intensity [weighing /truck vehicle miles of travel in millions]. When measuring effectiveness in terms of citation rates, increasing the intensity of enforcement beyond a certain point-approximately 500 weighings per million truck VMT based on the data shown in Figure 9-does not further decrease the citation rate.](images/fig9.png)
Notes: The figure excludes three States because the citation rates for these States exceed the scale of the figure; however, these States were included in the analysis. One State had a citation rate of 0.15 and an enforcement intensity of 132, another State had a citation rate of 0.19 and an enforcement intensity of 9, and the last State had a citation rate of 0.38 and an enforcement intensity of 2.
The foregoing interpretation, however, assumes that all States adopt similar enforcement methods (i.e., fixed, portable) and similar levels of enforcement targeting. Consider the portion of the curve where a relatively high citation rate is obtained with a relatively low enforcement intensity. One might conclude that this portion of the curve represents States that have a relatively ineffective truck weight enforcement program. The rationale for this conclusion is that a State does not enforce truck weights intensely enough (i.e., low enforcement intensity) and could improve enforcement effectiveness by increasing enforcement intensity and lowering the citation rate.
Conversely, one might also conclude that this portion of the curve represents States that have achieved a relatively effective enforcement program through less predictable (more random) or more targeted enforcement strategies that reduce the need for frequent weighings. The rationale for this conclusion is that a State that weighs vehicles less predictably or efficiently targets its limited enforcement resources towards times, places, industries, or carriers expected to be likely weight violators may observe a high citation rate with a relatively low enforcement intensity. Depending on the degree of unpredictability or enforcement targeting, this elevated citation rate may be a truer reflection of the actual magnitude of overweight trucking that more predictable and less flexible methods of enforcement do not detect, or, conversely, it may actually exaggerate the extent of overweight trucking. The effect however, may be temporary, as potential violators may eventually be less likely to violate if the perceived probability of detection is high and the consequences for operating overweight are sufficiently severe.
Figure 10 supports this latter interpretation of the relationship by sizing each point on the curve according to the relative emphasis that each State places on portable and semi-portable weighings compared to fixed weighings. The figure shows that those States that conduct a higher proportion of portable and semi-portable weighings generally have lower overall enforcement intensity and a higher citation rate. Further, when examining changes in citation rates for the nine States with a relatively high proportion of portable and semi-portable weighings (greater than 20 percent), there is some evidence that the citation rates appear to rise as the proportion of portable and semi-portable weighings increases, reach a maximum value, and then decline. While this effect cannot be systematically demonstrated, it does lend some support to the potentially temporary nature of the elevated citation rates being observed.
Figure 10: Citation Rate as a Function of Enforcement Intensity and Weighing Method: 2011
![Figure 10 supports the interpretation of the relationship by sizing each point on the curve according to the relative emphasis that each state places on portable and semi-portable weighings compared to fixed weighings. The figure is organized by citation rate (non-WIM) [citation/weighings] and enforcement intensity [weighing /truck vehicle miles of travel in millions]. The figure shows that those states that conduct a higher proportion of portable and semi-portable weighings generally have lower overall enforcement intensity and a higher citation rate.](images/fig10.png)
Notes: Each point in the figure represents one State. The size of each point reflects the proportion of total non-WIM weighings conducted by portable and semi-portable scales. The figure excludes three States because the citation rates for these States exceed the scale of the figure; however, these States were included in the analysis. One State had a citation rate of 0.15, an enforcement intensity of 132, and a 0.17 proportion of portable scale weighings. Another State had a citation rate of 0.19, an enforcement intensity of 9, and a 0.22 proportion of portable scale weighings. The last State had a citation rate of 0.38, an enforcement intensity of 2, and a 0.51 proportion of portable scale weighings.
State-Level Comparative Analysis
Building on the foregoing analysis of the relationship between citation rate and enforcement intensity, Figure 11 depicts this relationship for only the 29 comparison States (see Table 3; page 16), identifying each State (or data point) as either an at-limit or above-limit. The figure reveals the same general relationship as in Figure 9 for both the at-limit and above-limit State groups. Specifically, both at-limit and above-limit States exhibit a range of enforcement intensity, where those States with a low enforcement intensity (less than about 500 weighings per million truck VMT) have a relatively high citation rate compared to States with a higher enforcement intensity (more than about 500 weighings per million truck VMT). Further, when plotting this relationship by enforcement method (Figure 12), it is evident that those States that place a higher emphasis on portable and semi-portable weighings rather than fixed weighings—whether at-limit or above-limit—have a lower enforcement intensity and a higher citation rate.
Therefore, based on this comparison, the interpretation of the relationship between citation rate and enforcement intensity provided in the foregoing section applies equally to at-limit and above-limit States. Put another way, the comparison of at-limit and above-limit States does not reveal any difference in enforcement program effectiveness when measured in terms of citation rate and enforcement intensity. Rather, effectiveness as measured by this relationship appears more sensitive to the enforcement method (i.e., fixed or portable weighings) used in the State.
Figure 11: Citation Rate as a Function of Enforcement Intensity for At-limit and Above-limit States: 2011
![Figure 11 depicts the relationship of citation rate as a function of enforcement intensity for at-limit and above-limit states in 2011. The figure is organized by citation rate (non-WIM) [citation/weighings] and enforcement intensity [weighing /truck vehicle miles of travel in millions]. The figure reveals that both at-limit and above-limit states exhibit a range of enforcement intensity, where those states with a low enforcement intensity (less than about 500 weighings per million truck VMT) have a relatively high citation rate compared to states with a higher enforcement intensity (more than about 500 weighings per million truck VMT).](images/fig11.png)
Notes: “Federal States” refers to States with maximum weight limits consistent with the 80,000 lb. Federal maximum GVW; these are also referred to as “at-limit States.” “Non-Federal States” refers to States with maximum legal weight limits that exceed the Federal limits, also referred to as “above-limit States.” The figure excludes two States (one at-limit and one above-limit) because the citation rates for these States exceed the scale of the figure; however, these States were included in the analysis. The at-limit State had a citation rate of 0.19 and an enforcement intensity of 9; the above-limit State had a citation rate of 0.38 and an enforcement intensity of 2.
Figure 12: Citation Rate as a Function of Enforcement Intensity for At-limit and Above-limit States by Enforcement Method: 2011
![Figure 12 is organized by citation rate (non-WIM) [citation/weighings] and enforcement intensity [weighing /truck vehicle miles of travel in millions]. This figure illustrates that states that place a higher emphasis on portable and semi-portable weighings rather than fixed weighings-whether at-limit or above-limit-have a lower enforcement intensity and a higher citation rate.](images/fig12.png)
Notes: “Federal States” refers to States with maximum weight limits consistent with the 80,000 lb. Federal maximum GVW; these are also referred to as “at-limit States.” “Non-Federal States” refers to States with maximum legal weight limits that exceed the Federal limits, also referred to as “above-limit States.” The figure excludes two States (one at-limit and one above-limit) because the citation rates for these States exceed the scale of the figure; however, these States were included in the analysis. The at-limit State had a citation rate of 0.19, an enforcement intensity of 9, and a 0.2 proportion of portable scale weighings. The above-limit State had a citation rate of 0.38, an enforcement intensity of 2, and a 0.5 proportion of portable scale weighings.
Assessment of Compliance Outcomes for the Alternative Truck Configurations
This compliance assessment comprises an analysis of axle and gross vehicle load distributions for specific vehicle configurations at the selected WIM sites and compares these with the static weight limits in effect for these configurations at these sites. The comparisons use the performance measures listed and defined as part of the description of the compliance assessment methodology.
The templates shown in Figure 13 to Figure 22 (one template for each truck configuration) provide the results of the compliance assessments for the four vehicle-specific comparisons. Each template:
- Identifies the configuration, State(s), and analysis year;
- Provides information about the citation rate and enforcement intensity in the State(s), which is identified by the orange dot in the figure;
- Shows the cumulative probability distributions for each axle group (i.e., single, tandem, tridem), if relevant for the configuration, with accompanying statistics about the number of observations, mean, static weight limit, proportion of weight-compliant observations, severity of overweight observations, and static limit allowance (based on the accuracy of WIM devices); and
- Shows the cumulative probability distributions for the gross vehicle weight, with accompanying statistics about the number of observations, mean, static weight limit, proportion of weight-compliant observations, severity of overweight observations, and static limit allowance (based on the accuracy of WIM devices).
Figure 13: Performance Measures for the Comparison 1 Control Vehicle
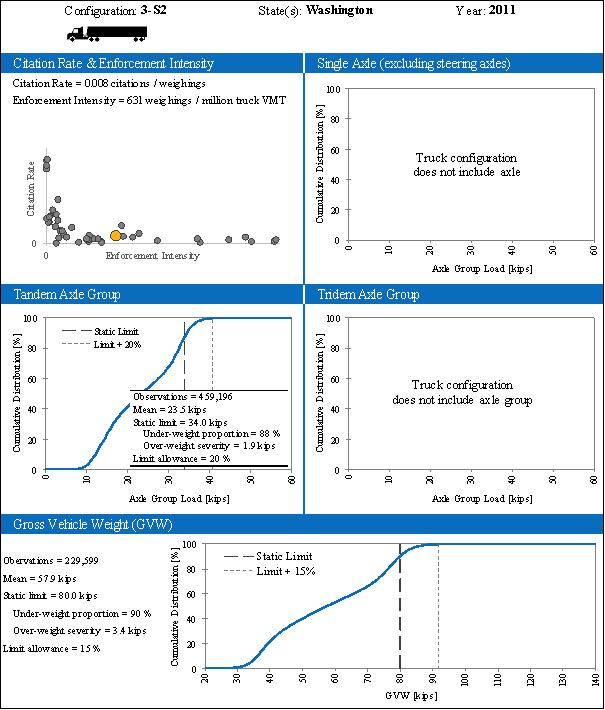
Figure 14: Performance Measures for the Comparison 1 Alternative Configuration
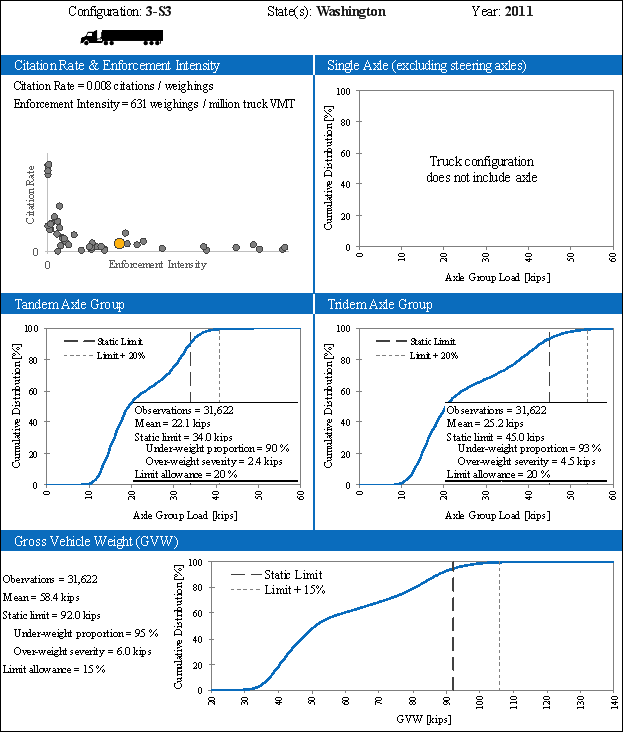
Figure 15: Performance Measures for the Comparison 2a Control Vehicle
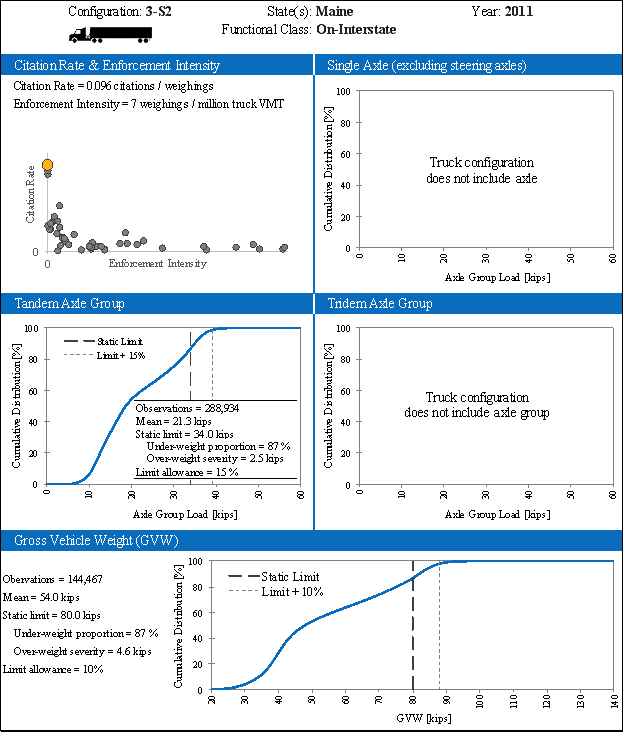
Figure 16: Performance Measures for the Comparison 2a Alternative Configuration
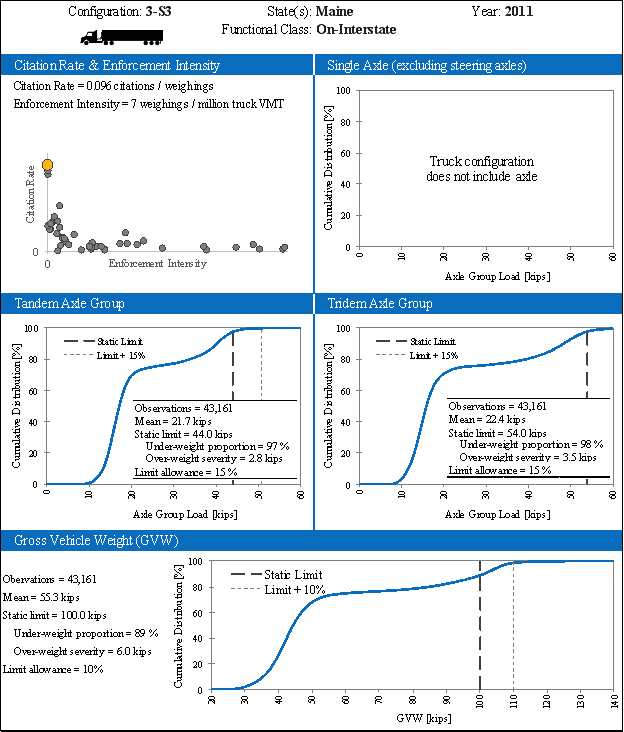
Figure 17: Performance Measures for the Comparison 2b Control Vehicle
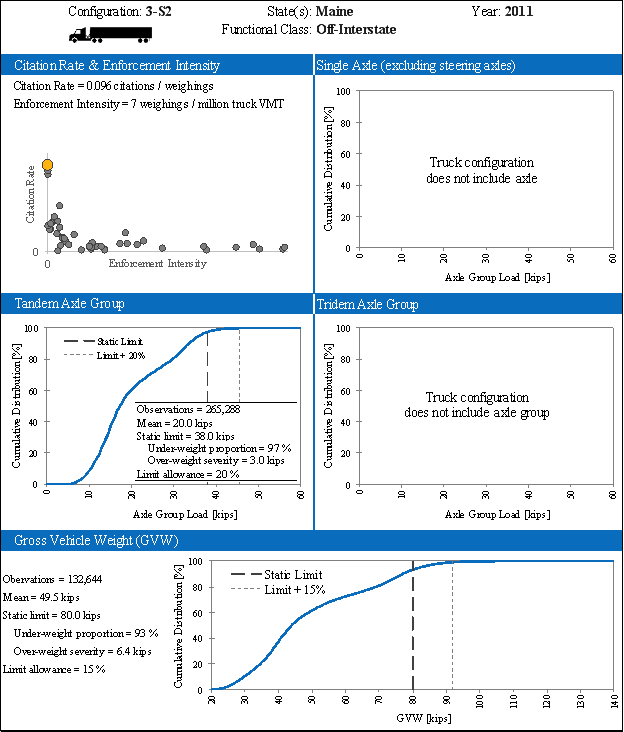
Figure 18: Performance Measures for the Comparison 2b Alternative Configuration
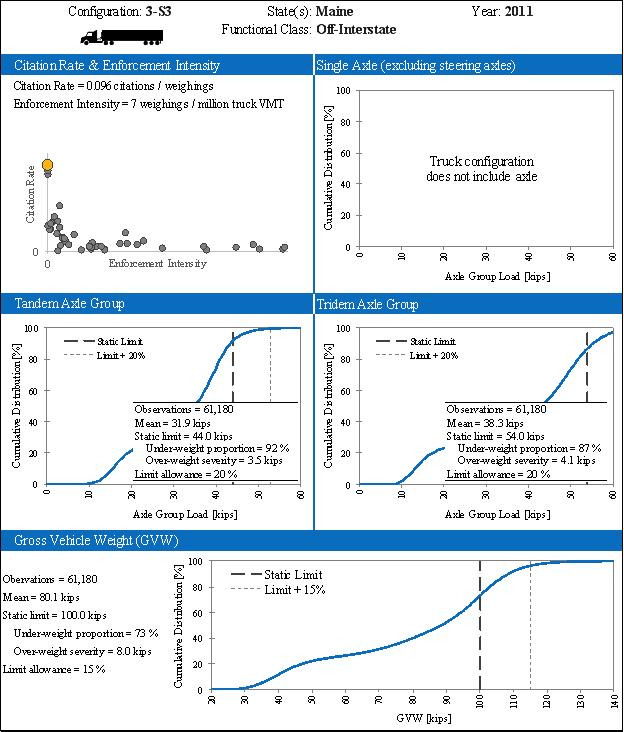
Figure 19: Performance Measures for the Comparison 3 Control Vehicle
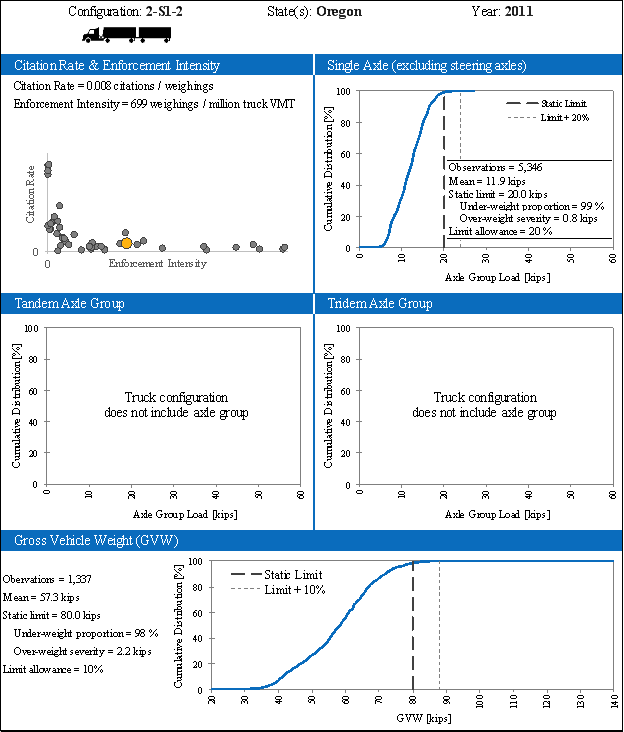
Figure 20: Performance Measures for the Comparison 3 Alternative Configuration
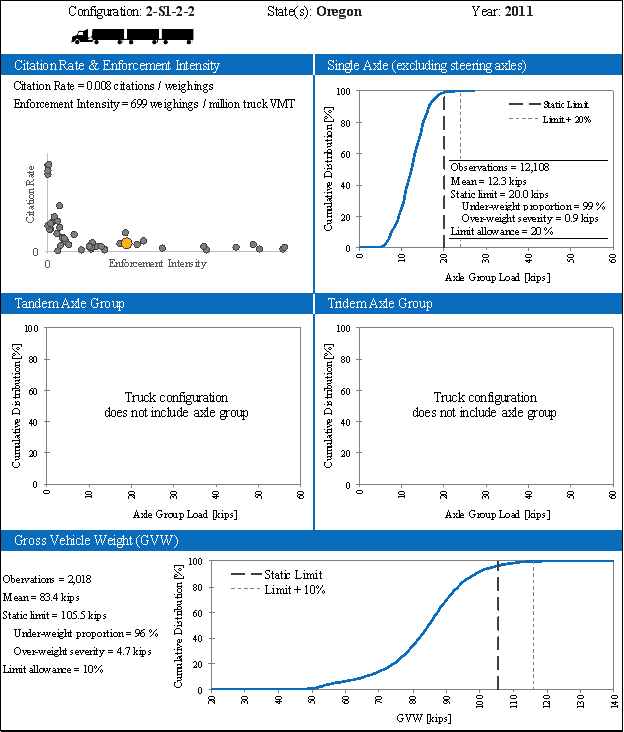
Figure 21: Performance Measures for the Comparison 4 Control Vehicle
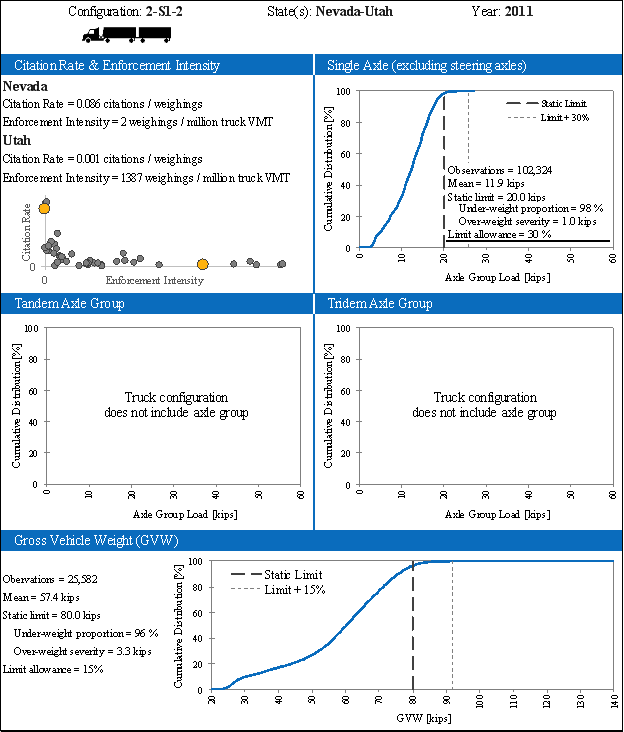
Figure 22: Performance Measures for the Comparison 4 Alternative Configuration
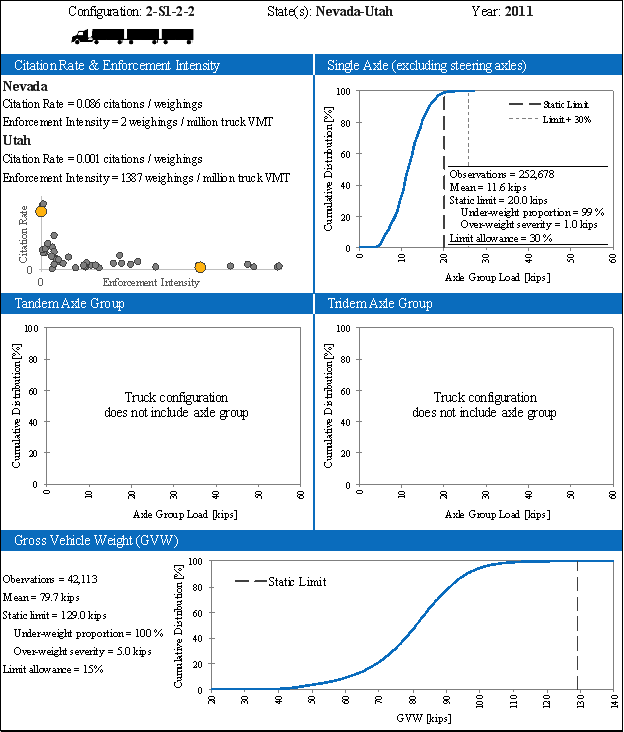
Table 21 to Table 24 summarize the four comparisons using the performance measures defined above. Comparison 1 (Table 21) reveals a higher proportion of weight-compliant observations for tandem axle groups and GVW for the alternative configuration (3-S3 at 91,000 pounds) compared to the control vehicle (3-S2 at 80,000 pounds). Specifically, considering GVW, the proportion of weight-compliant observations is 95 percent for the 3-S3s compared to 90 percent for the 3-S2s. In terms of the average severity of overweight GVW observations, however, 3-S3s exhibited a higher level of severity than 3-S2s (6.0 kips overweight for 3-S3s compared to 3.4 kips overweight for 3-S2s).
| Weight Compliant Proportion (%)1 | Overweight Severity (kips) | |||||||
|---|---|---|---|---|---|---|---|---|
| Single | Tandem | Tridem | GVW | Single | Tandem | Tridem | GVW | |
| Control Vehicle 3-S2 @ 80K lb. (53’) | - | 88 | - | 90 | - | 1.9 | - | 3.4 |
| Alternative Configuration 3-S3 @ 91K lb. (53’) | - | 90 | 93 | 95 | - | 2.4 | 4.5 | 6.0 |
1The percentages shown in the table are reported to the nearest percentage point as these values are used subsequently in the scenario analysis. The methodological assumptions and source data characteristics described in Section 3.2 should be considered when interpreting these results.
Comparison 2a (Table 22), which analyzes WIM data obtained for Interstate highways, reveals a higher proportion of weight-compliant observations for tandem axle groups and GVW for the alternative configuration (3-S3 at 97,000 pounds) compared to the control vehicle (3-S2 at 80,000 pounds). Specifically, considering GVW, the proportion of weight-compliant observations is 89 percent for the 3-S3s compared to 87 percent for the 3-S2s. In terms of the average severity of overweight GVW observations, however, 3-S3s exhibited a higher level of severity than 3-S2s (6.0 kips overweight for 3-S3s compared to 4.6 kips overweight for 3-S2s).
In contrast, Comparison 2b analyzes WIM data obtained for non-Interstate highways. Table 22 reveals that 73 percent of GVW observations are compliant for the alternative configuration (3-S3 at 97,000 pounds), compared to 93 percent of GVW observations for the control vehicle (3-S2 at 80,000 pounds). In terms of the average severity of overweight GVW observations,
3-S3s exhibited a higher level of severity than 3-S2s (8.0 kips overweight for 3-S3s compared to 6.4 kips overweight for 3-S2s).
| Weight Compliant Proportion (%)1 | Overweight Severity (kips) | |||||||
|---|---|---|---|---|---|---|---|---|
| Single | Tandem | Tridem | GVW | Single | Tandem | Tridem | GVW | |
| Comparison 2a: On Interstate | ||||||||
| Control Vehicle 3-S2 @ 80K lb. (53’) | - | 87 | - | 87 | - | 2.5 | - | 4.6 |
| Alternative Configuration 3-S3 @ 97K lb. (53’) | - | 97 | 98 | 892 | - | 2.8 | 3.5 | 6.0 |
| Comparison 2b: Off Interstate | ||||||||
| Control Vehicle 3-S2 @ 80K lb. (53’) | - | 91 | - | 93 | - | 3.2 | - | 6.4 |
| Alternative Configuration 3-S3 @ 97K lb. (53’) | - | 92 | 87 | 73 2 | - | 3.5 | 4.1 | 8.0 |
1 The percentages shown in the table are reported to the nearest percentage point as these values are used subsequently in the scenario analysis. The methodological assumptions and source data characteristics described in Section 3.2 should be considered when interpreting these results.
2 The sum of the tandem and tridem limits plus a 12,000 pound steering axle is greater than the GVW limit for the alternative truck configuration. This may explain why the GVW-compliant proportion of observations is less than the GVW-compliant proportion of observations for the tandem and tridem axle groups.
The foregoing results provide some indication that an increase in the single-semitrailer truck configuration GVW limit may contribute to a higher proportion of GVW-compliant observations for single-semitrailer truck configurations in certain circumstances (namely for Comparisons 1 and 2a); however, this cannot be definitively concluded from the analysis as the comparison does not enable an assessment of the proportion of GVW-compliant observations for the control vehicle in the absence of the alternative configuration.
Comparison 3 (Table 23) reveals the same proportion of weight-compliant observations for single axles on the alternative configuration (2-S1-2-2 at 105,500 pounds) as for the control vehicle (2-S1-2 at 80,000 pounds), and nearly the same proportion of compliant observations for GVW. Specifically, considering GVW, the proportion of weight-compliant observations is 96 percent for 2-S1-2-2s compared to 98 percent for 2-S1-2s. In terms of the average severity of overweight GVW observations, 2-S1-2-2s exhibited a higher level of severity than 2-S1-2s (4.7 kips overweight for 2-S1-2-2s compared to 2.2 kips overweight for 2-S1-2s).
| Weight Compliant Proportion (%)1 | Overweight Severity (kips) | |||||||
|---|---|---|---|---|---|---|---|---|
| Single | Tandem | Tridem | GVW | Single | Tandem | Tridem | GVW | |
| Control Vehicle 2-S1-2 @ 80K lb. (2 @ 28.5’) | 99 | - | - | 98 | 0.8 | - | - | 2.2 |
| Alternative Configuration 2-S1-2-2 @ 105.5K lb. (3 @ 28.5’) | 99 | - | - | 96 | 0.9 | - | - | 4.7 |
1 The percentages shown in the table are reported to the nearest percentage point as these values are used subsequently in the scenario analysis. The methodological assumptions and source data characteristics described in Section 3.2 should be considered when interpreting these results.
Comparison 4 (Table 24) reveals a similar proportion of weight-compliant observations for single axles and a higher proportion of underweight GVW observations when comparing the alternative configuration (2-S1-2-2 at 129,000 pounds) to the control vehicle (2-S1-2 at 80,000 pounds). Specifically, considering GVW, the underweight proportion of observations is nearly 100 percent for 2-S1-2-2s compared to 96 percent for 2-S1-2s. In terms of the average severity of overweight GVW observations, 2-S1-2-2s exhibited a higher level of severity than 2-S1-2s (5.0 kips overweight for 2-S1-2-2s compared to 3.3 kips overweight for 2-S1-2s).
| Weight Compliant Proportion (%)1 | Overweight Severity (kips) | |||||||
|---|---|---|---|---|---|---|---|---|
| Single | Tandem | Tridem | GVW | Single | Tandem | Tridem | GVW | |
| Control Vehicle
2-S1-2 @ 80K lb. (2 @ 28.5’) |
98 | - | - | 96 | 1.0 | - | - | 3.3 |
| Alternative Configuration
2-S1-2-2 @ 129K lb. (3 @ 28.5’) |
99 | - | - | 100 | 1.0 | - | - | 5.0 |
1The percentages shown in the table are reported to the nearest percentage point as these values are used subsequently in the scenario analysis. The methodological assumptions and source data characteristics described in Section 3.2 should be considered when interpreting these results.
The proportions of compliant GVW observations described in the foregoing comparisons also enable a system-wide consideration of enforcement effectiveness by applying these proportions to the truck travel estimates for the four applicable scenarios (i.e., Scenarios 2, 3, 5, and 6. As previously indicated, the five-axle tractor-semitrailer at 88,000 lb. GVW introduced by Scenario 1 is not analyzed because it cannot be isolated in the WIM dataset; the twin 33-foot double trailer configuration introduced by Scenario 4 is not analyzed because these configurations currently do not operate in the United States.).
Referencing Table 25, the comparisons assume that these proportions (columns 2 and 3 in the table), which were observed at locations which facilitated direct comparisons of the control and alternative truck configurations, are applicable under base case and scenario traffic conditions. To extend these results to the scenarios and apply them to the VMT estimates for the control vehicles and alternative truck configurations in these scenarios (columns 4 and 5 in the table), the analysis assumes that the compliant GVW proportions observed at the selected sites (i.e., specific points on the network) also apply across the network as a whole. In other words, this assumption considers the weight-compliant proportion of GVW observations measured at a point to be the same as the weight-compliant proportion of VMT for the control and alternative truck configurations that would be observed over the network. Following these assumptions, for each of the four scenarios the analysis calculates the total (combined) proportion of weight-compliant VMT for the control vehicle and alternative truck configuration for the base case and compares this to the total (combined) proportion of weight-compliant VMT of the same two configurations under the scenario traffic conditions (column 6 in the table). Thus, the scenario analysis reveals the system-wide impacts on enforcement effectiveness—as measured by compliance outcomes—that could result from the introduction of the alternative truck configurations into the traffic stream.
| Weight Compliant GVW Proportion (%) | 2011 VMT (Millions of miles) | Estimated Underweight Proportion of VMT (%) | |||
|---|---|---|---|---|---|
| Control Vehicle | Alternative Configuration | Control Vehicle | Alternative Configuration | ||
| Scenario 2: 3-S2 @ 80,000 lb. (control) vs. 3-S3 @ 91,000 lb. (alternative), Comparison 1 | |||||
| Base Case | 90 | 95 | 113,952 | 2,351 | 90 |
| Scenario 2 | 101,054 | 16,438 | 91 | ||
| Scenario 3 (on Interstate): 3-S2 @ 80,000 lb. (control) vs. 3-S3 @ 97,000 lb. (alternative), Comparison 2a | |||||
| Base Case | 87 | 89 | 62,105 | 810 | 87 |
| Scenario 3 | 53,250 | 9,689 | 87 | ||
| Scenario 3 (off Interstate): 3-S2 @ 80,000 lb. (control) vs. 3-S3 @ 97,000 lb. (alternative), Comparison 2b | |||||
| Base Case | 93 | 73 | 51,847 | 1,541 | 92 |
| Scenario 3 | 44,363 | 9,152 | 90 | ||
| Scenario 5: 2-S1-2 @ 80,000 lb. (control) vs. 2-S1-2-2 @ 105,500 lb. (alternative), Comparison 3 | |||||
| Base Case | 98 | 96 | 4,832 | 166 | 98 |
| Scenario 5 | 6,131 | 3,281 | 97 | ||
| Scenario 6: 2-S1-2 @ 80,000 lb. (control) vs. 2-S1-2-2 @ 129,000 lb. (alternative), Comparison 4 1 | |||||
| Base Case | 96 | 100 | 4,832 | 0 | 96 |
| Scenario 6 | 6,093 | 3,084 | 97 | ||
1 For this comparison, the seven-axle 2-S1-2-2 configuration operating at 129,000 lb. is considered a surrogate for the nine-axle 3-S2-2-2 configuration defined for Scenario 6.
Specifically, Table 25 reveals the following:
- Scenario 2: For Comparison 1 (3-S2 @ 80,000 lb (control) vs. 3-S3 @ 91,000 lb (alternative)), the VMT for the control vehicle represents approximately 98 percent of the combined 3-S2 and 3-S3 VMT in the base case and 86 percent when introducing the alternative truck configuration into the traffic stream (as per Scenario 2). Applying the compliant GVW proportions to these VMT estimates, the estimated system-wide proportion of compliant VMT is 90 percent for the base case and 91 percent for Scenario 2.
- Scenario 3 (on Interstate): For Comparison 2a (3-S2 @ 80,000 lb (control) vs. 3-S3 @ 97,000 lb (alternative) on Interstate), the VMT for the control vehicle represents approximately 99 percent of the combined 3-S2 and 3-S3 VMT in the base case and 85 percent when introducing the alternative truck configuration into the traffic stream (as per Scenario 3). Applying the compliant GVW proportions to these VMT estimates, the estimated system-wide proportion of weight-compliant VMT is 87 percent for the base case and Scenario 3.
- Scenario 3 (off Interstate): For Comparison 2b (3-S2 @ 80,000 lb (control) vs. 3-S3 @ 97,000 lb (alternative) off Interstate), the VMT for the control vehicle represents approximately 97 percent of the combined 3-S2 and 3-S3 VMT in the base case and 83 percent when introducing the alternative truck configuration into the traffic stream (as per Scenario 3). Applying the compliant GVW proportions to these VMT estimates, the estimated system-wide proportion of weight-compliant VMT is 92 percent for the base case and 90 percent for Scenario 3.
- Scenario 5: For Comparison 3 (2-S1-2 @ 80,000 lb (control) vs. 2-S1-2-2 @ 105,500 lb (alternative)), the VMT for the control vehicle represents approximately 97 percent of the combined 2-S1-2 and 2-S1-2-2 VMT in the base case and 65 percent when introducing the alternative truck configuration into the traffic stream (as per Scenario 5). Applying the compliant GVW proportions to these VMT estimates, the estimated system-wide proportion of weight-compliant VMT is 98 percent for the base case and 97 percent for Scenario 5.
- Scenario 6: For Comparison 4 (2-S1-2 @ 80,000 lb (control) vs. 2-S1-2-2 @ 129,000 lb (alternative)), the VMT for the control vehicle represents 100 percent of the combined 2-S1-2 and 2-S1-2-2 VMT in the base case and 66 percent when introducing the alternative truck configuration into the traffic stream (as per Scenario 6). (As stated earlier, for this comparison, the 2-S1-2-2 configuration operating at 129,000 lb is considered a surrogate for the actual 3-S2-2-2 configuration defined for the scenario.) Applying the compliant GVW proportions to these VMT estimates, the estimated system-wide proportion of weight-compliant VMT is 96 percent for the base case and 97 percent for Scenario 6.
Overall, considering only the portion of VMT associated with the control and alternative configurations and accounting for the VMT changes predicted in each of the four scenarios relevant for this analysis, the results reveal limited impacts on the estimated proportion of total weight-compliant VMT expected under the scenario traffic conditions when compared to the base case traffic conditions.
Table 26 summarizes the results for each scenario considered.
Identification of Statutes and Regulation
A final component of this study identifies statutes and regulations impacted by the potential allowance of alternative truck configurations on all roads and highways on which Surface Transportation Assistance Act (STAA) vehicles can now operate. The review focuses on relevant language contained in:
- 23 USC (Highways)
- 49 USC (Transportation and the corresponding regulations)
- 23 CFR Part 658 and 49 CRF Parts 390-399.
Table 2 in Chapter 1 identifies the control and alternative truck configurations included in this Study. Commercial motor vehicles currently designated as STAA vehicles serve as the control vehicles needed to conduct the comparative analysis required in the 2014 CTSW Study. The six alternative truck configurations may require changes in the U.S. Code as well as the Code of Federal Regulations.
The methodology used in this analysis identifies currently relevant statutory or regulatory language and the corresponding impacts of incorporating the alternative truck configurations into Federal law and Federal regulation. Appendix D contains the particulars of these impacts. To summarize, these impacts principally involve:
- Enactment dates for all applicable sections in 23 USC 127, 49 USC Chapter 311 and 23 CFR Part 658 pertaining to vehicle size and weight limits, as identified in the analysis;
- Length provisions replacing references to the twin 28-foot and twin 28.5-foot trailer combination vehicles as STAA vehicles with the twin 33-foot trailer combination;
- The Federal Bridge Formula to enable operation of non-compliant configurations being assessed in the study; and
- The listing of States and vehicle and route specific allowances provided in Code of Federal Regulations Title 23, Part 658 Appendix C.
3.4 References
AASHTO, Guide for Vehicle Weights and Dimensions, Washington, DC: American Association of State Highway and Transportation Officials, 2001.
ASTM International, Standard Specification for Highway Weigh-in-Motion (WIM) Systems with User Requirements and Test Methods. In Standard E1318-09 (pp. DOI: 10.1520/E1318-09), West Conshohocken, PA: 2009. www.astm.org.
Hanscom, F., Developing Measures of Effectiveness for Truck Weight Enforcement Activities, Washington, D.C.: National Cooperative Highway Research Program, 1998.
I-95 Corridor Coalition and FHWA, Results of the Year 14 Oversize/Overweight Permitting Project, Best Practices Case Studies, Draft Report, Washington, DC: 2008.
[3] The term "buses" used in this context is normally understood to mean over-the-road buses involved in the inter-city transport of passengers as opposed to municipal public transit vehicles. Return to Footnote 3
[4] These performance measures have been adapted from work by Hanscom (1998). Return to Footnote 4