Comprehensive Truck Size and Weight Limits Study - Compliance Comparative Analysis Technical Report
Chapter 2: Compliance Estimation of Enforcement Cost
2.1 Scope
This chapter documents the results from the estimation of cost of enforcement analysis performed as part of this compliance study. The purpose of this study is to assess the cost of enforcing truck size and weight (TSW) limits for trucks currently operating at or below current Federal truck weight limits as compared with a set of alternative truck configurations in six scenarios. It also estimates the enforcement cost impacts of introducing the alternative truck configurations into the traffic stream. To accomplish this, the objectives of the work are to:
- Document steps and procedures for the principal TSW enforcement methods used in North America, including the application and costs of technological components and systems;
- Gather and analyze truck enforcement program costs and resources (referred to as program inputs) at a national scale;
- Compare truck size and weight enforcement costs for States where trucks are authorized to operate above Federal limits with similar costs for States that adopt Federal truck weight limits; and
- Determine and compare the costs of weighing the alternative truck configurations and estimate the scenario cost impacts.
The scope of analysis for this work is constrained as follows:
- The base analysis year for the study is 2011. To capture annual trends in enforcement program costs, the analysis examines data reflecting program resources and activities from 2008 through 2012, inclusive, thereby using the most current, reliable data available.
- While the work focuses on TSW enforcement costs, much of the available cost data reflects the allocation of resources for both TSW and commercial vehicle safety enforcement. The costs reported by States reflect resources (e.g., personnel, facilities) directed at TSW enforcement and truck safety enforcement. No attempt has been made to disaggregate costs allocated to these separate programs.
- This work analyzes resources directed at enforcing truck size and weight. However, to support the purpose of this work, certain aspects of the analysis focus solely on truck weight.
- The work supports the comparative analysis of commercial motor vehicles that operate at or below an 80,000 lb. gross vehicle weight, a 20,000 lb. single-axle weight; a 34,000 lb. tandem axle weight ,and at or below weight limits as calculated through the Federal Bridge Formula as such limits are provided in Title 23 of the United States Code under Section 127. Per the legislation, vehicles that are exempted from the size and weight limits stated and provided in 23 USC Section 127 are to be treated as “vehicles operating in excess of federal size and weight limits.” Vehicles operating under a State-issued permit, including all divisible or non-divisible load movements, are to be treated in the same manner.
2.2 Methodology
As described in Chapter 1, enforcement program costs are considered inputs in the performance-based approach applied in this study. Within the context of this approach, this section provides specific details about the methodology and data applied for three of the four objectives. The methodology applied in this work extends the results of the previous 2000 CTSW Study in three main ways:
- It provides an updated and more comprehensive description of TSW enforcement methods and technologies. (The methodology used to achieve this objective is relatively straightforward, so no details are provided here.)
- It provides a more detailed analysis of the costs of enforcement at the national level, including an investigation of recent cost trends.
- It includes a comparative analysis of how costs may be impacted by the introduction of alternative truck configurations into the traffic stream. This type of analysis was not conducted as part of the previous 2000 CTSW Study.
National-Level Trends
The measures of input included in the analysis of national-level trends are program cost (disaggregated into costs for personnel and facilities) and the number and type of weigh scales used to enforce truck weights, including WIM sites used for screening truck weights. State Enforcement Plans (SEPs), which are submitted annually by States to the FHWA, provide the primary source data for the analysis of enforcement costs and resources. The USDOT study team analyzed tabulated summaries for key metrics from 2008 to 2012 (i.e., total costs, facilities costs, personnel costs, quantity of weigh scale equipment). The following limitations apply to the data:
- The costs reported in the SEPs reflect those costs for truck size, weight, and safety enforcement. In most States, these programs overlap considerably—both personnel and facilities resources may be used to enforce size and weight limits and conduct vehicle safety inspections—and so no attempt was made to disaggregate costs allocated to these separate programs.
- The costs reported in the SEPs reflect those costs deemed by the State to be directed at enforcement activities in that State each year. For the most part, specific States show consistent cost trends over time; however, costs for certain States exhibit anomalies when major capital expenditures (e.g., for new enforcement facilities) are undertaken in a particular year.
- The SEPs do not contain any systematically reported information about TSW enforcement costs for specific vehicle configurations, routes, networks, industries, commodities, or permitted versus non-permitted trucks.
- It appears that certain States may be reporting the actual number of portable scales in operation while others may be reporting the number of locations at which portable scales are used or even the number of weighings conducted with portable scales.
State-Level Comparative Analysis
This component of the analysis in this work compares the enforcement costs and resources (i.e., weigh scales) for States that allow vehicles in excess of Federal truck weight limits (i.e., above-limit States) and States that do not allow vehicles in excess of Federal limits (i.e., at-limit States). The comparisons aim to identify state-level differences in enforcement costs and resources, and can be understood as a surrogate way of revealing potential vehicle-specific differences. The designation of the States as “at limit” and “above limit” considers three information sources:
- Relevant TSW regulations pertaining to single-semitrailer and multiple trailer trucks operating in each State (e.g., the U.S. Code of Federal Regulations, Title 23, Part 658, Appendix C) provide one indication about whether a State may be effectively at-limit or above-limit. For example, States that routinely permit triple trailer combinations on Interstate highways may be designated as above-limit States.
- Estimated 2011 vehicle miles travelled (VMT) for the scenarios’ alternative truck configurations (e.g., six-axle tractor semitrailers, triple trailer combinations) provide an indication of the extent of operation of above-limit trucks in a State by highway network type. For example, States where six-axle semitrailers commonly operate above 80,000 lb. GVW (other than those where a single-trip permit may be required) may be designated as above-limit.
- Insights from commercial motor vehicle State enforcement officials provide an experiential indication of whether a State may be designated as at limit or above limit.
As such, these comparisons do not account for State-specific variations in enforcement program delivery and permitting activities, nor do they fully consider the extent to which each truck configuration is allowed to operate within a State. Nevertheless, the comparisons provide one pragmatic approach for identifying potential cost differences associated with enforcing different types of truck configurations.
The scope of the comparative analysis includes the 29 comparison States. States included in each of these groups are listed in Table 3: States Included in Comparative Analysis. Based on these information sources for the purpose of this comparative analysis, 13 of the 29 comparison States are designated as at-limit and 16 as above-limit. As indicated earlier, the 29 comparison States were selected because they: (1) are considered to be enforcement programming leaders in the Nation, (2) have experience in enforcing vehicles subject to grandfather provisions (e.g., longer combination vehicles), or (3) have recently undertaken research and development projects related to TSW enforcement. In addition, the selection of these States addressed the need to represent general variations in trucking operations across the Nation (e.g., configurations in use, industries served) and geographic factors.
The comparative analysis focuses on costs reported for 2011 only. To help account for differences in the relative size of the TSW enforcement task in different States, all costs are normalized using 2011 estimates of truck VMT in that State. The truck VMT estimates include all single-unit trucks, single-semitrailer trucks, and multiple-trailer trucks. To reduce the impact of outlying data points, the comparison uses ranges and median values to compare costs and resources available for TSW enforcement in at-limit and above-limit States.
Truck Weight Enforcement Cost Comparisons for the Alternative Truck Configurations
The final component of the analyses in this work compares the costs associated with enforcing truck weights for the study scenarios’ alternative truck configurations relative to the control vehicles (as specified in the scenarios). As no publicly available systematic data source exists to support such analysis, information about the time required to weigh various truck configurations was gathered from seven commercial motor vehicle State enforcement officials. This information is used as the basis for estimating truck weight enforcement costs for the scenario analysis. These officials were part of a Working Group of representatives from the Commercial Vehicle Safety Alliance; this group assisted with various aspects of the Study by providing experienced-based insights. The Working Group’s membership included people in leadership positions within the CVSA community and featured several decades of experience in conducting truck size and weight enforcement program activities. All seven weighing time estimates received from the Working Group were included in the analysis. These estimates were obtained from: Arizona, Arkansas, Maryland, Michigan, North Carolina, Oklahoma, and Texas. Appendix E contains the instructions to participants and the form used to collect these data.
The time required to conduct a weighing may vary by the truck configuration being weighed and the type of weigh scale being used. State enforcement officials provided weighing times for the six alternative truck configurations and the two control vehicles being studied. The control vehicles, commonly referred to as Surface Transportation Assistance Act (STAA) vehicles, are:
- A five-axle tractor semitrailer at 80,000 lb. GVW with a 53-ft. semitrailer; and
- A five-axle tractor semitrailer-trailer at 80,000 lb. GVW[2] with one 28.5-ft. semitrailer and one 28.5-ft. trailer.
Three alternative truck configurations are compared to the five-axle tractor semitrailer control vehicle. These are:
- The five-axle tractor semitrailer at 88,000 lb. GVW with a 53-ft. semitrailer;
- The six-axle tractor semitrailer at 91,000 lb. GVW with a 53-ft. semitrailer; and
- The six-axle tractor semitrailer at 97,000 lb. GVW with a 53-ft. semitrailer.
The remaining three alternative truck configurations are compared to the five-axle tractor semitrailer-trailer (2-S1-2) control vehicle. These are:
- The five-axle tractor semitrailer-trailer at 80,000 lb. GVW one 33-ft. semitrailer and one 33-ft. trailer;
- The seven-axle tractor semitrailer-trailer-trailer at 105,500 lb. GVW with a 28.5-ft. semitrailer and two 28.5-ft. trailers; and
- The nine-axle tractor semitrailer-trailer-trailer at 129,000 lb. GVW with a 28.5-ft. semitrailer and two 28.5-ft. trailers.
For each of these truck configurations, weighing times were provided for the four main types of weigh scales: fixed static scales (including scales that weigh axle groupings and weigh bridges that weigh the whole vehicle at once), portable scales, semi-portable scales, and WIM scales (including the use of a WIM at a virtual weigh scale).
The following nine-step procedure was developed for estimating the system-wide enforcement cost impacts for each of the six scenarios. The analysis estimates the percentage change in personnel costs that could occur nationwide as a result of the traffic conditions specified by each scenario.
- Determine the proportion of VMT by truck configuration in each State for the base case defined in this Study.
- For the base case in each State, distribute the non-WIM weighings for each scale type (i.e., weighings using fixed static scales, semi-portable scales, and portable scales) according to the VMT proportions calculated in Step 1. This calculation assumes that all static weighings are conducted using scales that weigh axle groups independently, since: (1) there is no incremental weighing time associated with the alternative truck configuration when using a static weigh bridge (as is the case for single-semitrailer trucks), or (2) incremental weighing times are irrelevant if the length of the weigh bridge cannot accommodate the length of the alternative truck configuration (as may be the case for triple trailer combinations).
- Calculate base case weighing rates (i.e., the number of weighings per VMT) by State, truck configuration, and weigh scale type. These weighing rates are held constant in this analysis.
- Determine incremental weighing time factors for each truck configuration and scale type relative to the time it takes to weigh a five-axle tractor semitrailer (control vehicle) on a fixed (axle group) weigh scale. For example, according commercial motor vehicle State enforcement officials, on average, it takes about 17 minutes to weigh a six-axle tractor semitrailer using a semi-portable scale, compared to about four minutes to weigh a five-axle tractor semitrailer using a fixed (axle group) weigh scale. Therefore, the incremental weighing time factor for this comparison is 4.25 (17 divided by 4). It is assumed that the incremental time factors calculated in this way are equal to incremental personnel cost factors.
- Using the total personnel costs for each State and the incremental personnel cost factors determined in Step 4, develop an equation that can be solved to determine the average cost of weighing a five-axle tractor semitrailer (control vehicle) on a fixed (axle group) scale. This average cost is held constant in this analysis.
- In each State, multiply the new scenario VMT estimates for each vehicle configuration by the weighing rates calculated in Step 3 to determine the number of weighings by truck configuration and scale type for the scenario.
- Multiply the number of weighings for each truck configuration and scale type by the incremental personnel cost factors (for each truck configuration and scale type) determined in Step 4. The sum of these costs is the total personnel cost in each State under the scenario traffic conditions.
- Sum up the total personnel costs in each State determined in Step 7 for the scenario and compare these totals to the base case total personnel costs to determine the system-wide impacts of the scenario on personnel costs.
- Repeat Steps 6 to 8 for each scenario.
2.3 Results
This section summarizes steps and procedures for the principal TSW enforcement methods used in North America, including the application and costs of technological components and systems used to enforce truck weights. It also summarizes national-level truck weight enforcement program costs and resources (such as weigh scales) used to accomplish the enforcement task. The analysis based on this data provides information at the national level in addition to state-specific cost and resource trends (specific State names are withheld). This section also compares the enforcement costs for States that allow vehicles in excess of Federal limits and States that effectively do not allow vehicles in excess of Federal limits. Data from the subset of 29 comparison States supports this analysis. Finally, this section compares the costs of weighing the alternative truck configurations identified for the scenario analysis. By applying the nine-step procedure described in the foregoing section, the analysis also estimates the percentage change in personnel costs that could occur nationwide as a result of the traffic conditions specified by each scenario. It also estimates the enforcement cost impacts at a system-wide level for each of the six scenarios.
Principal TSW Enforcement Methods and Technologies
Technology Components
Technologies play an important role in TSW enforcement. In light of current truck travel demand levels, the resources available for TSW enforcement, and the support of ongoing research being conducted by the FHWA and the Federal Motor Carrier Safety Administration (FMCSA), technologies designed to automate enforcement activities are becoming increasingly popular with State enforcement agencies. Some technologies work well alone while others are more effective when used as a component in a broader technology system. The technologies presented in this sub-section are the components that serve as the building blocks for enforcement technology systems.
There is a subset of technologies that solely measure vehicle or axle weights for the purpose of weight enforcement. This subset (fixed static scales, semi-portable scales, and portable scales), becomes much more effective when deployed in a system-based enforcement approach. For example, when the time required to use one of these basic weighing technologies to weigh a passing truck exceeds the arrival rate of trucks required to be weighed, a more systematic approach should be considered to increase enforcement resource efficiency.
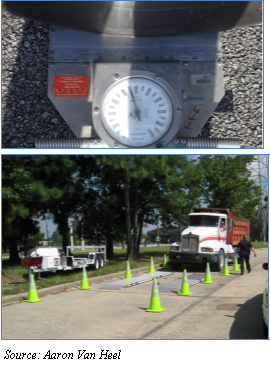
Static Scales
 A static scale is a permanently fixed mechanism that is used to weigh trucks with a precision and accuracy that is suitable for issuing overweight vehicle or axle citations. The static scales require regular calibration services for certification purposes to maintain accuracy. They are typically used at weigh stations as well as private sector locations. Weigh station applications are key for weight enforcement, while private sector static scale locations are necessary for weight certification of vehicles and cargo, and are typically used for payment verification purposes by private sector businesses.
Static scale deployment at weigh stations provides the data necessary to identify those motor carriers that may be operating illegally (overweight without a permit). Enforcement officers sometimes use static scales to weigh vehicles that were flagged by other means (as potentially overweight) at locations in the vicinity of a weigh station. The enforcement personnel accompany the vehicle in question to the weigh station to verify the vehicle (or one or more of its axle configurations) is actually overweight and can then issue a legally enforceable citation based on the data generated by the static scale. The static scale can be used to measure the weight of the entire vehicle or it can measure axle groupings independently.
Approximate Cost:
The cost of static scales includes the necessary construction to support the in-ground equipment as well as the maintenance costs and periodic Weights and Measures certifications to ensure accuracy. Prices for static scales can range from $100,000 to $200,000 (Hanson, 2014). The size of the scale varies as does the pricing. Annual maintenance costs range from $9,000 to $18,000.
Portable Scales
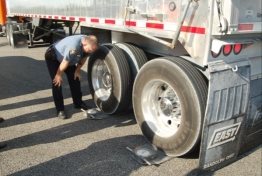
 Portable scales are pieces of equipment that can be transported in the enforcement officer’s vehicle and can be used on the roadside to weigh a truck. The accuracy level of portable scales is considered legally acceptable for issuing overweight citations. Portable scales are only used for individual vehicle axles; a scale is used for each side of the axle to obtain total axle weight (the measured weight of the right side of the axle is added to the measured weight of the left side of the axle to obtain a total axle weight). The enforcement officer typically places the portable scale in front of the tires of the axle to be weighed and then asks the commercial vehicle driver to roll forward and stop on top of the scale. This is done for each axle to obtain total vehicle weight as well as individual axle weights. While a truck’s total weight may not exceed the maximum allowable to operate on the roadway, it is possible that one particular axle on the truck may exceed the legal axle weight limit. A truck can be cited for exceeding the total weight or exceeding individual axle weight limits. In dangerous conditions the enforcement officer may request that, in lieu of using the portable scales, the driver follow the officer to the nearest weigh station where static scales can be used.
Approximate Cost:
Portable scale prices vary and can cost between $2,000 and $4,700 per device (Hanson, 2014). Enforcement personnel typically have four portable scales per patrol vehicle and each scale must be calibrated and certified at periodic intervals to ensure their accuracy and legality. Annual maintenance costs range from $180 to $425 and include scale recertification costs.
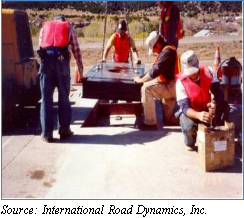
Semi-Portable Scales
Semi-portable scales (also referred to as axle scales) are larger than portable scales, and various States use them for weight enforcement details that are temporary in nature and that can benefit from this technology, which allows for much shorter weighing times than portable scales. Semi-portable scales are suitable for issuing citations – which means they satisfy legal certification requirements. While they are cumbersome to move around (relative to transporting portable scales) and require special equipment (a trailer), they are sometimes preferred for temporary enforcement sites due to their ability to measure axle weights and total vehicle weights without the need to place individual portable scales in front of each wheel and then have the driver roll forward and stop on top of them.
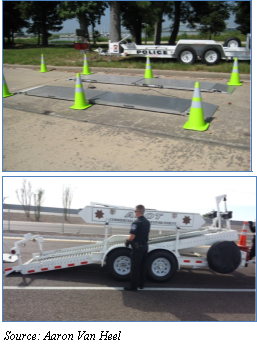
Semi-portable scales allow the enforcement officer to tell the commercial vehicle driver to drive on top of the scales and stop. The officer can then record the axle weights before allowing the driver to drive forward – to be followed by the next commercial vehicle. There is no need to move the scales during this process.
Approximate Cost:
Semi-portable scale prices vary and can cost between $10,000 and $59,000 (Arizona DOT) per set. The accompanying trailer has a typical cost of approximately $10,000 (Van Heel, 2014). Annual maintenance costs for the system range from $900 to $5,300. As with portable scales, semi-portable scales must be calibrated and certified for accuracy at periodic intervals.
Weigh-in-Motion Systems
Weigh-in-motion (WIM) systems vary in appearance, cost, and accuracy. While the different technologies have their unique characteristics, all WIM systems perform the function of weighing vehicles without requiring them to stop. Some of the most popular WIM systems can be classified as:
- Piezoelectric
- Piezoquartz (Kistler)
- Bending Plate
- Single Load Cell
These systems can be placed on mainline roadways, entrance and exit ramps, city streets, and even in parking lots. Their primary value is to allow vehicles to be weighed without requiring commercial vehicle traffic to come to a complete stop. Different systems have different operating characteristics. Some WIM systems are effective at highway speeds while others are more accurate at lower speeds (0-12 MPH/0-20 KPH).
Typically, WIM systems are used as screening or sorting devices to eliminate the need to stop and weigh every truck while in transit. While WIM systems have proven to be valuable screening tools when working properly, they are not yet approved by U.S. Courts as legally acceptable for directly issuing overweight citations in the United States. When a WIM system identifies a commercial vehicle as being overweight, the enforcement officer must conduct a follow-up weighing using portable, semi-portable scales or a static scale as these are the only legal weighing systems that can be used as the basis for issuing a citation.
In addition to their use as a screening tool, WIM systems are able to store the data collected at unmanned sites for later analysis to determine commercial vehicle violation patterns and employ intelligent enforcement details. This type of data can also be used for planning purposes to determine pavement loadings experienced on roadways throughout the network. In the United States, quite often locations where WIM is installed was decided by non-truck weight enforcement purposes. Pavement engineers have used WIM for many years supporting their research programs. WIM is also installed by the states for traffic monitoring purposes that support planning activities and, hence, do not always coincide with the strategic locations required for truck weight enforcement purposes.
In terms of data availability, depending upon the system configuration, some WIM data is retrievable over the Internet and can be viewed in the home office or in manned field stations (PBS&J, 2008, pp. 4-11).
Piezoelectric Weigh-in-Motion
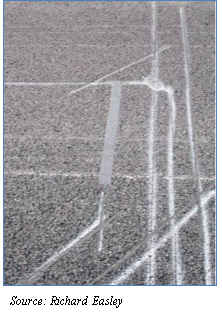
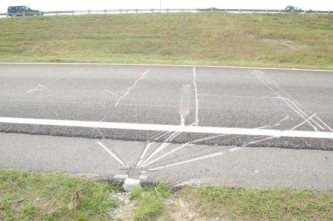
The basic construction of the typical piezoelectric WIM sensor consists of a copper strand surrounded by piezoelectric material, which is covered by a copper sheath. When pressure is applied to the piezoelectric material, an electrical charge is produced. The sensor is actually embedded in the pavement and the load is transferred through the pavement. The characteristics of the pavement (level approach, temperature, etc.) will therefore affect the output signal. By measuring and analyzing the charge produced, the sensor can be used to measure the weight of a passing tire or axle group.
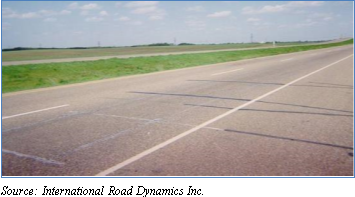 For a complete data collection system, it is common to install two inductive loops and two piezoelectric sensors in each lane that is being monitored. Installation begins with making a relatively small saw cut in the road into which the sensor is installed. The size of the cut varies depending on the sensor being installed, but is generally 1” to 2” deep and 1” to 2” wide. The sensor is placed in the cut and secured in place by a fast-curing grout. A complete lane installation consisting of two sensors and two loops can be accomplished in less than a full day, including curing time.
When properly installed and calibrated, a piezoelectric WIM system should be expected to provide gross vehicle weights that are within 15 percent of the actual vehicle weight for 95 percent of the trucks measured.
Two of the advantages of this technology are that the costs are low and the technology is accepted and widely utilized. Another advantage is the minimal traffic disruption during installation.
The disadvantages, however, include inadequate precision for vehicle weight accuracy (loads can vary by as much as ±15 percent). While this technology can be used for distinguishing between loaded or empty trucks, it is not precise enough to be used for accurate screening of loaded trucks to determine which ones are overweight. In addition, this technology is highly susceptible to pavement perturbations. Equipment lifespans are shorter than some of the more expensive WIM technologies, with the piezoelectric system having a lifespan of approximately 4 years; further, pavement life affects the technology’s longevity.
Approximate Cost:
The piezoelectric system offers the lowest capital cost, the lowest cost to install and is suitable for data collection applications (low accuracy) (PBS&J, 2008, pp. 4-11).
While the initial costs for this technology are low, the necessary maintenance and calibration expenses can be considerable. The equipment cost, including electronics, for one lane is approximately $10,000 - $15,000. The total installed cost for one lane is between $25,000 and $30,000 excluding communications or traffic control costs. Tieing in additional installations within lanes at the same site cost approximately $3,500. Annual maintenance costs range from $2,250 to $2,700.
Piezoquartz (Kistler) Weigh-in-Motion System
The piezoquarts or Kistler WIM system consists of a light metal profile in the middle of which quartz disks are fitted under preload. When force is applied to the sensor surface the quartz disks yield an electric charge proportional to the applied force through the piezoelectric effect. A charge amplifier converts this electric charge into a proportional voltage, which can then be further processed as required.
 The sensors can be installed in combination with other traffic detectors like induction loops, switching cables, etc. Compared to other weight enforcement technologies, Kistler WIM sensors are relatively easy to install both individually and in groups for comprehensive recording over a wide roadway.
 Installation begins by making a relatively small saw-cut in the road into which the sensor will be installed. The size of the cut varies depending on the sensor being installed, but is generally 2.25” deep and 3” wide. The sensor is placed in the cut and secured by a fast-curing grout. A complete lane installation consisting of eight sensors and two loops can be completed in less than a day, including curing time. When properly installed and calibrated, the Kistler WIM system should be expected to provide gross vehicle weights that are within 10 percent of the actual vehicle weight for 95 percent of the trucks measured.
Kistler WIM is a relatively new technology that provides suitable screening accuracy. The cost, while slightly more expensive than piezoelectric, still requires relatively little disruption of traffic for installation. Kistler WIM, as with many other WIM technologies, is not precise enough to issue a citation. This technology’s accuracy is also susceptible to pavement conditions (weather, rutting, plow damage, etc.) Additionally, an equipment lifespan of approximately 6 years is shorter than some of the more expensive WIM technologies (PBS&J, 2008, pp. 4-11).
Approximate Cost:
While the initial costs for this technology are low, the necessary maintenance and calibration expenses can be considerable. Equipment cost including electronics for one lane is approximately $25,000 to $30,000. The total installed cost for one lane is between $45,000 and $60,000 and does not include communications costs or traffic control costs. Installations in additional lanes at the same site cost between $15,000 and $18,000 (Hanson, 2014). Annual maintenance costs range from $4,100 to $5,400.
Bending Plate Weigh-in-Motion
The Bending Plate scale consists of two steel platforms, which are each 2’ by 6’, placed adjacent to each other to cover a 12’ lane. The steel plate is instrumented with strain gauges at critical points to measure the pressure in the plate as a tire or axle passes over. The measured strain is analyzed to determine the axle load. The Bending Plate scale is typically installed in a lane with two inductive loops and an axle sensor to provide vehicle length and axle spacing information.
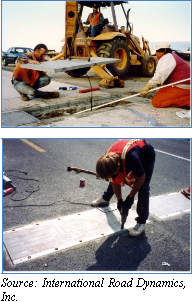 There are two basic installation methods for a Bending Plate scale. In concrete roadways of sufficient depth, a shallow excavation is made in the surface of the road (Quick Installation). The scale frame is anchored into place using anchoring bars and epoxy. In asphalt roads or thin concrete roads, it is necessary to install a concrete foundation for support of the frame (Vault Installation). The roadway is cut and excavated to form a pit of 30” deep by 4’10” wide by 13’10” long. Then, the frame is positioned in place and cast into concrete to form a secure and durable foundation for the scale.
Installing a complete lane of scales, loops and an axle sensor can be accomplished in less than a day using the shallow excavation method and in 3 days using the concrete vault.
When properly installed and calibrated, the Bending Plate WIM system should be expected to provide gross vehicle weights that are within 10 percent of the actual vehicle weight for 95 percent of the trucks measured.
Bending Plate WIM is a much more robust WIM technology than the piezo systems described earlier. This system is capable of withstanding weather extremes, but if incorrectly installed it can create substantially more severe consequences to the traveling public. The labor and the traffic disruption necessary to install this system are slightly greater than the piezo approaches, and the accuracy is not much better considering the additional costs. The Bending Plate system has a lifespan up to twice as long as the piezoelectric-based approaches (PBS&J, 2008, pp. 4-11).
Approximate Cost:
The costs for this technology are ‘moderate’ and the necessary maintenance and calibration expenses can be considerable. Equipment cost including electronics for one lane is approximately $25,000 - $32,500. The total installed cost for one lane is between $55,000 and $65,000 excluding communications or traffic control costs (Hanson, 2014). Installations at additional lanes at the same site cost between $15,000 and $20,000. Annual maintenance costs range from $5,000 to $5,900.
Single Load Cell Weigh-in-Motion
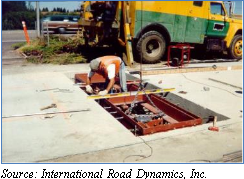 The Single Load Cell Scale consists of two weighing platforms with a surface size of 6’ by 3’2” placed adjacent to each other to fully cover a normal 12’ traffic lane. A single hydraulic load cell is installed at the center of each platform to measure the force applied to the scales. The load measurements are recorded and analyzed by the system electronics to determine the axle loads.
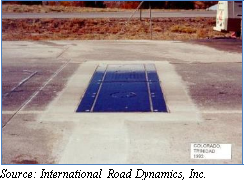 The installation of a single load cell scale requires the use of a concrete vault. The roadway is cut and excavated to form a pit. The frame is positioned in place and then cast into the concrete to form a secure and durable foundation for the scale. The size of the vault required measures 165” by 58” by 38”. The Single Load Cell scale is typically installed in a lane with two inductive loops and an axle sensor to provide vehicle length and axle spacing information. A complete installation of of scales, loops, and axle sensor in a single lane can be accomplished in 3 to 4 days.
When properly installed and calibrated, the Single Load Cell WIM system should be expected to provide gross vehicle weights that are within 6 percent of the actual vehicle weight for 95 percent of the trucks measured.
Single Load Cell WIM is a more accurate WIM technology than the WIM systems described earlier. This system is capable of withstanding weather extremes, but incorrect installation consequences are substantially more severe to the traveling public. According to a FHWA study result (USDOT, FHWA, 2014a, p. 5), the Single Load Cell WIM has an accuracy level of ± 6 percent and with proper calibration and maintenance, is considered the highest among the WIM systems investigated (PBS&J, 2008, pp. 4-11).
 Approximate Cost:
The costs for this technology and the necessary maintenance and calibration expenses can be considerable; however, these are offset by the extended lifespan of the system. The equipment cost including electronics for one lane is approximately $70,000 to $90,000. The total installed cost for one lane is between $100,000 and $150,000 excluding communications or traffic control costs (Hanson, 2014). Annual maintenance costs range between $12,600 and $16,200.
It is important to note that the useful lifespan of the single load cell WIM is considerably longer than some other WIM systems, making total lifecycle costs and increased accuracy a consideration. The actual service life of a properly installed and maintained load cell site has not been estimated since load cell technology usefulness is impacted by the condition of adjacent pavement. Well-maintained surrounding pavement can yield a considerable load cell service life. Conversely, poorly maintained pavement can reduce the load cell service life due to damage caused by a non-smooth interface between the load cell and surrounding pavement.
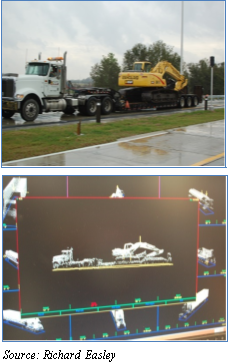
Thermal Imaging
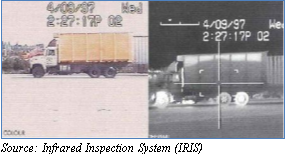 Thermal imaging technology is a highly innovative screening tool. Many States are using this technology, which qualifies for Motor Carrier Safety Assistance Program (MCSAP) funding. What makes thermal imaging unique is that it can screen trucks, cars and even buses while they travel at normal speeds. The primary purpose for this technology is to check brakes – the single most frequent form of equipment failure responsible for placing commercial vehicles out of service. An ancillary benefit of thermal imaging is its ability to detect overloaded vehicles through the heat signature of the tires. Experienced enforcement officers have long known that overloaded tires produce large amounts of heat, which is visible to thermal imaging technology.
 Because an infrared scanner is able to measure heat, when vehicles drive along a flat grade and the brakes are not in use, the technology can detect possible brake problems. If any of the wheels measure “hot” or appear bright on the enforcement official’s display, then there is a strong possibility that this particular brake is malfunctioning. Conversely, if a truck is coming to a stop and is using the brakes, all the wheels should measure “hot” or bright on the infrared monitor. If any of the wheels are “cool” or appear dark, then those particular wheels do not have properly functioning brakes. In either case, the thermal imaging serves as a good screening tool to select vehicles for more in-depth brake inspection.
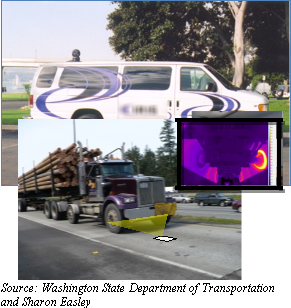
Thermal imaging technology is deployed in multiple ways:
- Hand-held devices require an enforcement officer to merely point the device at the tires as the vehicle drives by or is stopped.
- Van-mounted devices allow the enforcement officer to sit inside the van and remotely aim the infrared device at trucks to view heat signatures.
- Devices installed at roadside (at wheel level) capture heat signatures for each truck passing the equipment.
- Devices installed beneath the pavement in the middle of a lane captures a heat signature for each wheel/brake/axle as the truck rolls over the device.
Enforcement personnel can use this thermal imaging data to select potentially unsafe (or overweight) trucks to intercept, inspect, and, if warranted, remove the unsafe or overweight vehicles from the roadway.
Approximate Cost:
The costs for thermal imaging technologies can vary.
- Hand-held units can cost between $6,000 and $10,000, depending upon the unit.
- Roving vans fully equipped with thermal imaging systems can cost approximately $300,000.
- Roadside-mounted thermal imaging technology can cost approximately $150,000.
- Subsurface thermal imaging technology can cost approximately $250,000 and has the added cost of roadway construction (Taylor, 2014).
Maintenance costs for these technologies vary depending upon the type of system used. Handheld maintenance costs can range from $540 to $900, and mobile van systems maintenance costs are approximately $27,000 per year. Roadside fixed system maintenance costs are $13,500 and subsurface mounted system maintenance costs can reach $22,500 per year.
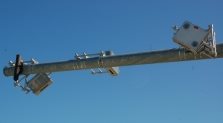
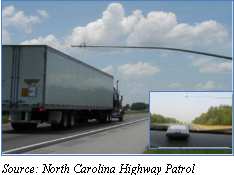
Height Detection System
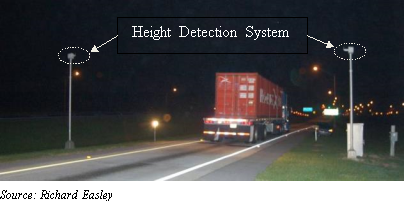
A height detection system will consist of a laser detector or optical sensor which points across the roadway at a certain height and includes a method of communication to alert the driver, or enforcement personnel, when a vehicle exceeding an pre-determined height drives past. When a vehicle breaks the laser beam, it can trigger a series of safety measures including warning the driver, providing the driver with an alternate and safe diversion, or alerting motor carrier enforcement that a triggering event has occurred. While there are no height restrictions in Federal law or regulation, most States impose enforceable State height limits ranging from 13.6 feet to 14.6 feet (USDOT, FHWA, 2014b).
Height detection systems can be valuable in areas with low overpasses or where tunnels are present. In addition, these systems can prove valuable in areas where accidents related to high winds regularly occur, such as on bridges. With respect to size and weight enforcement, when this technology is deployed near a weigh station, any triggered events can alert enforcement personnel to check for the proper permits or issue citations if the proper permits have not been purchased (i.e., the oversized vehicle is not operating legally).
Approximate Cost:
The cost to furnish and install the two poles, light source, optical sensor and associated equipment is approximately $30,000 (Hanson, 2014). Yearly maintenance costs are approximately $2,700.
Three Dimensional Measuring Systems
 Three dimensioning (3D) technology is one of the tools used to measure a vehicle’s width, height, and length. By scanning the vehicle as it passes the reader, an image is processed and analyzed. This data is then converted into the vehicle’s dimensions.
 There are several approaches to obtaining 3D imaging, which can include side readers as well as overhead readers, as image accuracy is sensitive to laser reader installation angle. While this technology cannot determine a vehicle’s weight for enforcement purposes, it can identify those commercial vehicles that exceed legal width restrictions. As noted previously, while there are no Federal height restrictions, most States impose enforceable State height limits ranging from 13.6 feet to 14.6 feet (USDOT, FHWA, 2014b).
To date this technology is not approved for citation issuance purposes, but is an efficient screening and data collection tool.
Approximate Cost:
Costs for 3D systems vary; the furnish and install price is estimated at $235,000 (Hanson, 2014). Annual maintenance costs for these systems are estimated at $21,200.
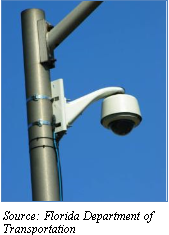 Closed Circuit Television (CCTV) Systems
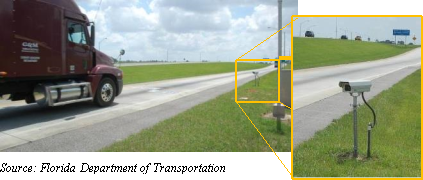
Closed Circuit Television (CCTV) cameras and more advanced video image detection systems are relatively inexpensive technologies that can monitor truck activity on weigh station bypass routes. Video image detection systems use machine vision technology to compile and analyze traffic data collected with CCTV systems. Video image detection can automatically monitor freeway conditions, capture speeds, and count and classify vehicles.
There are many benefits to CCTV deployment including the ability to “see” commercial vehicle traffic on remote roadways, on major thoroughfares, or any location that can be viewed from the public right-of-way. These traffic images can be viewed in real-time or the images can be stored and viewed at a later date. An added benefit is that the CCTV data can be viewed from anywhere with Internet access and by any enforcement personnel with the appropriate access permissions.
Using CCTV Cameras to monitor bypass routes can provide true counts of commercial vehicles, and limited truck body type information (e.g., logging trucks, car carriers, tanker trucks, etc.) can be collected. Today there are many cameras in use that capture images of vehicles as they are detected (by various types of sensor technologies) when certain sensor criteria are met. For example, sensors can activate CCTV cameras when a specific classification of vehicle is detected, a weight threshold is exceeded, speeds are exceeded, etc. This is helpful for enforcement when a vehicle is determined to be overloaded, over-height, or over-length. The CCTV image can be used to identify the vehicle by an enforcement officer in the immediate vicinity or for analysis at a later date.
Approximate Cost:
The cost for this technology ranges from $10,000 to $50,000 for a color CCTV camera, and annual maintenance costs range from $200 to $1,000 (Hanson, 2014). This assumes an existing communications link and does not include the software systems and algorithms for automated surveillance.
License Plate Recognition
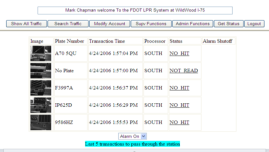 License plate reader (LPR) technology is the application of a camera and sophisticated software (optical character recognition (OCR)) which takes the image of a license plate and converts that image to alpha-numeric characters. This license plate information can be stored in a database or the software can perform a “look up” for a matching license plate in a database that may contain stolen tags, Amber Alert information associated with a tag or other information.
Applications can include such simple “look ups” as identifying truck license plates that regularly use a bypass route.
 LPR technology can be used in daylight as well as nighttime using various lighting techniques including infrared lighting, Xenon lighting, light-emitting diode (LED) lighting, etc.
LPR technology can be used on virtually any truck with a license plate—in other words, all of them, since every commercial vehicle has to mount a license plate in order to operate legally on US roadways. In addition, the technology does not require any additional equipment to be installed on the truck – such as a transponder. The camera captures a license plate image for each truck bypassing the sensors. Using OCR software, the system attaches data to the image that indicates whether or not the plate was successfully read and the time, date and location of the read; and it also indicates whether or not the license plate number is in either a State or Federal crime database.
 While LPR can be used to capture vehicle identification and conduct license plate “look ups,” it cannot capture the weight of the vehicle. LPR technology is generally used in conjunction with WIM technology. While LPR is used in various applications around the world including toll enforcement, parking operations, and speed enforcement, it is still rather limited in its accuracy for trucking enforcement operations. Due to the large number of license plate designs, finishes (reflective), colors, and various states of disrepair (paint chipped off, dirty, bent, swinging from a hinge, odd location on the front of the truck, etc.) the technology has a limited “read” capability. However, vendors for such equipment continue to improve LPR technology performance.
Approximate Cost:
Costs for LPR systems will vary; installed costs range from $90,000 to $150,000 including OCR (Hanson, 2014). This includes the necessary software required to analyze the images and produce the digital numbers and text suitable for recordkeeping and running database queries. Annual maintenance costs can range from $8,100 to $13,500.
Optical Character Recognition (USDOT Readers)
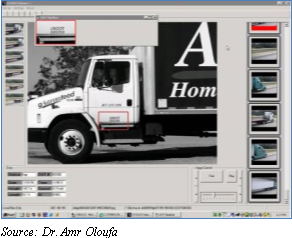
Similar to LPR technology, optical character recognition technology in its simplest form is the application of a side-fired digital camera and sophisticated OCR software that takes the image of a USDOT number and converts that image to alpha-numeric characters. This USDOT information can be stored in a database or the software can “look up” the matching DOT number in a database that may contain DOT numbers of motor carriers with poor safety records, motor carriers that are delinquent on payment of International Registration Plan (IRP) or International Fuel Tax Agreement (IFTA) fees, or other violation information. This technology can be used in daylight as well as nighttime. The system employs various lighting techniques to illuminate the USDOT number, including infrared lighting, Xenon lighting, LED lighting, etc.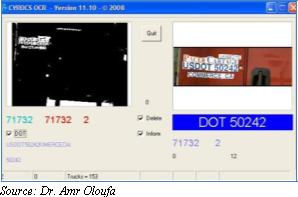
OCR systems can be used to identify motor carriers that consistently bypass weigh stations or that consistently operate when weigh stations are closed. Using this type of motor carrier-specific operations data—in conjunction with WIM scale data—enforcement officials can identify violators and respond with appropriate legal actions.
OCR, while becoming more popular, is still not close to 100 percent accuracy, and errors are not uncommon. Experience has shown that OCR performance has not matched that of LPR because of the technical challenges of interpreting the non-standard presentation of the USDOT numbers (varying size, color, location and background color).
Approximate Cost:
Costs for USDOT reader systems will vary; installed costs range from $90,000 to $150,000 including OCR. This includes the necessary software required to analyze the images and produce the digital numbers and text suitable for recordkeeping and running database queries. Annual maintenance costs can range from $8,100 to $13,500.
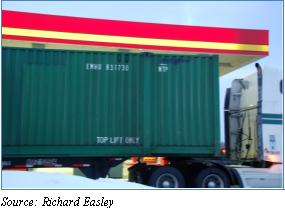
Container Character Recognition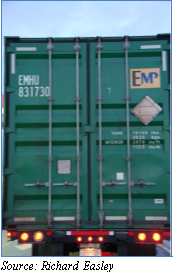
Similar to LPR technology, container character recognition (CCR) technology is the application of a camera and sophisticated OCR software that takes the image of a container number and converts that image to text and numbers. This container ID information can be stored in a database or the software can search for a matching container number in a database that may contain stolen container information, Homeland Security information, or other information.
This technology can be used in daylight as well as nighttime. The system employs various lighting techniques, including infrared lighting, Xenon lighting, LED lighting, etc. Especially relevant for overweight violation detection and citation is the ability to identify the container separate from the chassis. Each chassis has a license plate, but if the container is transferred to a different chassis, the overloaded container could not be traced without the container’s unique ID. Because chassis are an interchangeable component of all intermodal freight movements, a technology that specifically identifies the container, regardless of the chassis underneath, becomes valuable for locating overweight containers.
 CCR systems can be used in the vicinity of marine and rail intermodal operations. This technology allows enforcement officials to track containers from the time they are unloaded from a ship or train until the container crosses jurisdictional boundaries. This information could be helpful in achieving the U.S. Department of Homeland Security’s desire for cargo visibility, which could prove useful to State and local agencies as well as the Federal government.
CCR camera placement is not the same as LPR placement in that CCR cameras must capture the container number on the rear or side of the container whereas LPR must find and read the license plate on the front of the truck.
Approximate Cost:
Costs for these systems vary; the installed price is estimated between $90,000 and $150,000 including OCR. This includes the necessary software required to analyze the images and produce the digital numbers and text suitable for recordkeeping and running database queries. Annual maintenance costs can range from $8,100 to $13,500.
Transponder Technology (DSRC)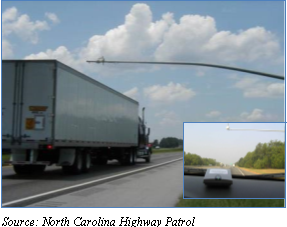
Transponder Technology is synonymous with Radio Frequency Identification (RFID) Tags or dedicated short range communications (DSRC) and uses radio frequency to communicate between a truck-mounted tag and a roadside tag reader. This two way communication link is primarily utilized on the Interstate system to identify a specific truck (or company) or run a quick database check to determine if the truck is in compliance (paid taxes, etc.). It can also alert the driver to pull into the weigh station or port-of-entry to be inspected. Transponder readers need to be compatible with transponders used for any particular DSRC system.
One of the advantages of using RFID technology is that it can identify the motor carrier as the truck travels down the highway without decreasing speed. As long as the jurisdiction has a database link to the truck, a great deal of information can be obtained – especially when married with a WIM system. When combined with a WIM system, commercial vehicle enforcement officers can stop the truck and issue an overweight citation (using a portable or static scale) or the data can be analyzed at a later date and warnings can be issued to the offending motor carriers. The disadvantage of DSRC in this application is that it can only identify the carrier and the truck; without combining DSRC with WIM, there is no weight information. The other challenge with relying solely on using DSRC for vehicle identification is that only a very small percentage of trucks actually carry these DSRC tags and participate in the electronic screening programs. To compound this, the various DSRC programs are not interoperable, so a transponder that can be identified in one State may not be recognized in another State.
Approximate Cost:
The costs for DSRC screening technology is approximately $25-$75 per tag. Depending upon the program the carrier enrolls with, the carrier may or may not have to purchase the tag. Additional costs are necessary to purchase transponder readers, deploy the requisite communications technology, and install/support the software programming necessary to operate the system.
CVIEW and Automated Permitting Systems
 The Commercial Vehicle Information Exchange Window (CVIEW) is a system that allows enforcement personnel to collect the pertinent data for a commercial vehicle from several disparate databases. Rather than stopping a commercial vehicle and then checking multiple databases for information pertaining to operating authority, possession of appropriate permits, etc., the CVIEW software system searches all relevant databases and compiles the information on one screen so the enforcement officer can run all necessary checks and the commercial vehicle driver is not delayed any longer than necessary.
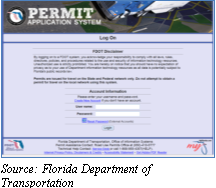
Automated Permitting Systems allow the motor carrier to apply for, pay for, and receive oversize and overweight permits online in an automated fashion. This method is much quicker for the motor carrier and allows permit office personnel to concentrate on more complex duties while the simple permit requests are handled through an automated process. An automated permitting benefits both the motor carrier and permit office staff in terms of efficiency, but it also benefits enforcement personnel at the roadside because the overweight or oversized vehicles’ permits can quickly be verified through a CVIEW link to the automated permit database.
Approximate Cost:
CVIEW technology costs vary from jurisdiction to jurisdiction and depend upon the legacy system interfaces as well as development of any new databases. A CVIEW (or CVIEW equivalent) can cost as little as $30,000 or as much as $600,000. Annual maintenance costs for these systems can range between $2,700 and $54,000 depending upon the complexity of the system.
Automated Permitting Systems can vary greatly in price as well. An important factor is the required system functionality. The complexity of the programming greatly increases the cost. Also, some jurisdictions have the ability to develop their own systems while other jurisdictions choose to hire an outside vendor to create their program. Still other systems are created and operated by a third party vendor that charges service fees to the jurisdiction, thereby reducing the initial programming and hardware procurement cost.
Technology Systems
Technologies serve a specific purpose and most are designed to fulfill that purpose efficiently and effectively. It is often advantageous to deploy combinations of technologies to satisfy multiple and varying enforcement objectives. Such strategic enforcement systems utilize the technologies discussed previously.
The following technology system descriptions will vary from agency to agency depending upon capital budgets, locations, traffic conditions, weather, availability of space, type of freight movements, and availability of weight enforcement personnel.
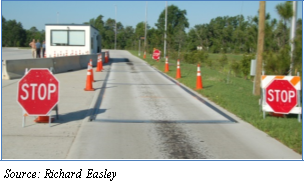
Non-Fixed Weigh Sites
Non-fixed weigh sites are those locations that are used for inspections or weighing vehicles. Unlike weigh stations which are typically staffed and fully configured for commercial vehicle enforcement activities, non-fixed weigh sites are locations that are not staffed, may or may not have any commercial vehicle enforcement equipment, and are only utilized on a temporary basis. For purposes of this report, only the following two types of non-fixed weigh sites will be discussed.
- Plug and Play Sites
- Roving Sites
 Both Plug and Play Sites, and the Roving Sites have a variety of configurations. They are used for conducting short term enforcement activities with a relatively low budget. However, once the commercial vehicle industry members that are operating illegally learn where a non-fixed weigh site is in operation, they may either reroute their trips or park and wait for the non-fixed weigh site to shut down – typically, just a matter of hours.
Plug and Play Sites
Plug and Play sites are those locations where some level of infrastructure exists but it is not used for enforcement if enforcement officers are not onsite. There are many configurations for this type of site, and any number of combinations of infrastructure may accommodate the types of technology used in such sites, including: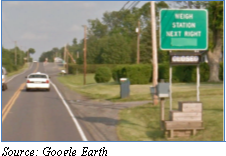
- Weigh-in-Motion Technology
- License Plate Reader Technology
- Closed Circuit Television Cameras
- Optical Character Recognition (for USDOT number reads)
- Container Character Recognition (for container number reads)
- Variable Message Signs (to alert trucks to stop)
- Height Detection Technology
- A small building structure to house or plug in computer equipment to operate any of the onsite technology
Plug and Play sites can also have any combination of equipment brought along with the enforcement personnel to complement the existing equipment already onsite. This can include:
- Portable Scales
- Thermal Imaging Technology
Approximate Cost:
The cost for a Plug and Play site is dependent upon the technologies used at the particular location. Some Plug and Play sites may be configured differently depending upon geographic limitations or the targeted violator group (e.g., logging trucks, containers, etc.).
Roving Sites
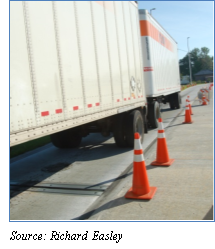
Roving Sites are those locations chosen for commercial vehicle enforcement activities that contain no enforcement facilities or technologies but simply have enough space to perform weighings and inspections safely. These sites are typically chosen based on a calculated enforcement strategy.
A roving site could be located at:
- A rest area parking lot,
- A paved or gravel pullout along the roadway, or
- Any site deemed safe for weighing and inspection that is utilized by commercial vehicle traffic.
Roving sites require the commercial vehicle enforcement personnel to bring all of the equipment they would need to conduct their weighings and inspections. The combination of equipment used at a Roving Site depends upon the objectives of the inspections. A roving site could be a random location to pull over one truck based on a suspected safety violation, or it could be a pre-determined location where all trucks are stopped along that particular route. Inspections could be for any combination of the following objectives:
- Checking weight of the vehicles,
- Conducting an equipment check (brakes, cargo securement, tires, lights, etc.),
- Driver credentials or operating credentials (IRP, IFTA, permits, etc.), or
- Other reasons.
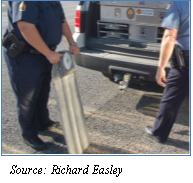
Equipment utilized at a Roving Site could include:
- Portable Scales
- Semi-Portable Scales (larger scales that require a hauling trailer and assembly is required)
- Portable Transponder Reader
- Thermal Imaging Device
- Brake Testing Device
Some enforcement agencies use vans that are adequately equipped to set up inspection or weigh sites at any location deemed appropriate.
Approximate Cost:
The cost for a Roving Site is dependent upon what technologies would be used at the particular location. Some Roving Sites may require different equipment depending upon the geographic limitations, objective of the mission, etc.
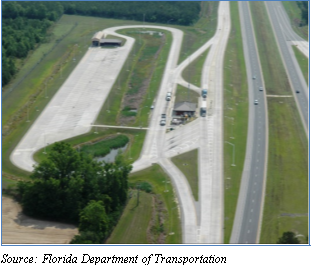
Fixed Weigh Sites
Fixed weigh sites are those locations that are permanent and have staff assigned to operate them. Commercial vehicle enforcement personnel operate the facility on a regularly scheduled basis. Some sites operate 24 hours per day while others may shut down every evening. Fixed weigh sites typically require a large amount of land and can be very expensive to build. Space requirements vary by jurisdiction. Some jurisdictions require office space for multiple agencies (e.g., weight enforcement and law enforcement). In some areas of the country all weigh station activities are conducted under a single agency while in others States share duties between various agencies. Fixed sites are usually located on high-volume roadways (Interstate System, National Highway System routes, etc.) and several activities are conducted onsite. These activities can include:
- Weighing the trucks (issuing citations if warranted),
- Conducting safety inspections,
- Issuing permits,
- Checking for proper operating credentials,
- Examining Bills of Lading to ensure taxes are paid and cargo is not prohibited,
- Providing restroom facilities for drivers, and
- Providing a parking area for trucks that are placed out of service or for drivers that need rest (some include WiFi).
 The fixed weigh sites can use many technologies to perform commercial vehicle enforcement duties more efficiently. The technologies that can be found at a fixed weigh site can include:
- Static Scales
- Weigh-in-Motion
- License Plate Readers
- Optical Character Readers (USDOT Readers)
- Container Character Reader
- CCTV
- Thermal Imaging
- Height Detectors
- Three Dimensional Imaging
- Brake Testing Technologies
- Vehicle and Cargo Inspection Systems (VACIS)
- Transponder Readers
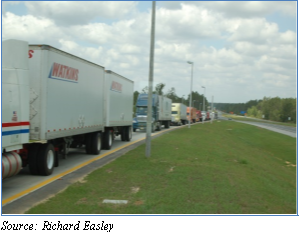 Fixed weigh sites are costly and most jurisdictions have found that while the need for more sites is increasing, the costs for additional sites makes building the number of facilities needed cost prohibitive. Because there are relatively few fixed weigh sites and many route alternatives, some motor carriers that may be overweight or unable to pass a safety inspection find bypass routes to avoid being stopped at a fixed weigh site. Also, some carriers find that they lose valuable time when they have to undergo inspections or other time consuming requirements at fixed weigh sites and attempt to find bypass routes. The technologies operating at fixed weigh sites help to minimize commercial vehicle delays by automating time consuming activities, but these technological advancements have minimal value if overweight and unsafe carriers choose to find bypass routes and never enter a fixed weigh site.
Approximate Cost:
Fixed weigh sites can cost upwards of $15 to $35 million dollars depending upon the weigh site configuration, the various environmental studies, construction costs, land acquisition costs, etc. The VACIS technology by itself can cost more than $1.5 million dollars. The VACIS utilizes gamma ray technology to produce images revealing cargo content without the need to open trailers or containers. Annual maintenance costs for technologies associated with a fixed weigh site can average $80,000, depending upon the configuration (Taylor, 2014).
Unmanned Fixed Weigh Sites
The unmanned fixed weigh site is similar in concept to the fixed weigh site, but it is operated remotely. This concept is one that allows enforcement personnel to use technology to weigh vehicles, check vehicle dimensions, determine if a vehicle is current on taxes, registrations, permits, etc. This concept also allows for thermal imaging brake checks as well as visual inspections. While unmanned fixed weigh sites cannot match the full services that a fixed weigh site can with onsite enforcement personnel, it utilizes technology to the fullest extent to perform some basic weigh site functions.
One of the models of an unmanned fixed weigh site is to use channelized lane flows that direct trucks to a window-height kiosk with a camera. The driver is then asked questions, if warranted, and required to places any needed paperwork on the scanner located in the kiosk. This information is relayed to the weigh station operator that may be at the manned fixed weigh station on the opposite side of the highway, or the operator may be in a central location where multiple unmanned fixed weigh sites across the jurisdiction are managed.
The configurations for an unmanned fixed weigh site can vary greatly, but typically will have CCTV visibility, static scales, WIM technology, and perhaps restroom facilities. Most will have ample parking space for vehicles to wait until enforcement personnel arrive to provide assistance or issue citations if warranted. This space can also be used when vehicles are placed out of service for oversize or overweight violations, incomplete paperwork, or visual safety inspection irregularities.
Approximate Cost:
Costs for unmanned weigh sites vary depending upon the size and cost of real estate and needed improvements (pavement, utilities, construction, etc.), the technologies deployed, and the facilities included (restrooms, small office, etc.). Costs range from $10 – $20 million. Annual maintenance costs for technologies associated with an unmanned fixed weigh site can average $80,000, depending upon the configuration (Taylor, 2014).
Electronic Screening Systems
Electronic screening systems originated in the early 1990’s to demonstrate the concept that trucks could travel from Texas to California and north to British Columbia without being required to stop at weigh stations. This electronic screening demonstration would enable those carriers that are operating safely and legally to bypass crowded weigh stations so long as they continue to operate safely and legally. The concept for electronic screening systems is based on an electronic check of a truck or motor carrier’s information, which is located in a database and accessed when the truck comes into the vicinity of a weigh station. If, based on the information in the jurisdiction’s database, the truck is deemed to have a satisfactory safety record and is operating with all legally required credentials, the driver is electronically notified that he/she may bypass the weigh station.
Electronic screening programs exist in most States today, but not all systems are interoperable. There are variations in communication methods, variations in technology system requirements, variations in database ownership (State-owned or third-party-provider owned database for checking motor carrier records to determine eligibility for weigh station bypass), and variations in cost structures for electronic screening systems (State funded, motor carrier funded, or combination).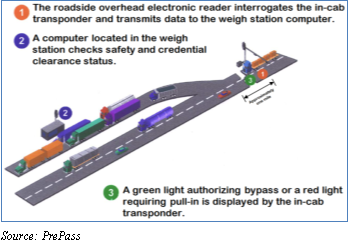
Electronic screening systems use a combination of technologies including:
- Transponders and Transponder Readers
- Weigh-in-Motion
- Cellular Communications (smart phones, e-tablets, laptops, etc.)
Industry representatives have expressed a desire to have a single communication protocol that works for every jurisdiction and is interoperable for all vehicle-to-roadside communication links. The 5.9 GHz communications spectrum has specifically been researched to become the standard transportation link that can support electronic screening nationwide as well as allow enforcement-vehicle-to-commercial-vehicle system interrogations (for safety and weights) while both vehicles are in motion, minimizing the need to stop commercial vehicles. A nationwide interoperable communication system may provide the basis of the North American Vehicle to Infrastructure (V2I) and the Vehicle to Vehicle (V2V) wireless communication network developed for rapid transmission of critical, life-saving information.
Approximate Cost:
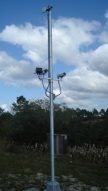
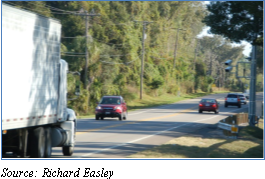 Costs for electronic screening systems vary greatly and can be borne by any or all of the following stakeholders – the jurisdiction, a third party provider, and the motor carrier community. Cost items could include transponders, transponder readers, smart phones, e-tablets, cell phone service, weigh-in-motion, hardware/software systems, construction costs, plus software and system integration costs. A typical electronic screening site equipped with one to three transponder readers and the associated technology (not including the transponders) can cost between $200,000 and $600,000 ($200,000 for one transponder reader configuration and $600,000 for a three reader configuration) (Taylor, 2014). These costs do not include the addition of WIM technology. Annual maintenance costs can range between $18,000 and $54,000.
Virtual Weigh Sites
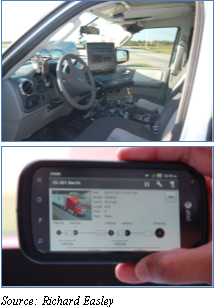
Virtual weigh sites are a cost-effective substitute for placing permanent weigh stations on every road in a particular jurisdiction. There is a high probability that if a truck is deliberately running overweight, the driver may choose to take routes that avoid weigh stations. Due to the existence of primary and secondary roads, there is usually at least one alternate route around every fixed weigh station. While it might seem logical to build weigh stations on several of the alternate routes, this solution is not feasible. The cost for such facilities, including purchasing the right of way and construction, can easily exceed $15 million. By comparison, the average virtual weigh sites can cost as little as $300,000 depending upon the configuration. A significant difference between the virtual weigh site and the fixed or unmanned weigh site is that the virtual weigh site has a nearly invisible footprint. That is to say that there is no exit ramp, there is no building, there is very little evidence that a virtual weigh site exists unless someone notices a loop detector in the roadway or a license plate camera mounted on a pole on the side of the roadway. Virtual weigh sites do not require commercial vehicles to stop, slow down, change lanes or any other behavior inconsistent with "regular driving."
The typical virtual weigh site system is designed to detect possible overweight vehicles on roadways that bypass a fixed weigh site. The system is designed to screen all commercial vehicles using the roadway and to categorize them as either potential violators or non-violators. Law enforcement personnel can then focus their attention on potential violators. Potential violators will be any vehicles that appear to either violate the jurisdiction’s weight or dimension requirements or avoid the WIM scale purposefully.
Virtual weigh systems are automated. WIM technology determines vehicle weights. Each truck traversing the outfitted roadway will trigger cameras to take an image of the truck’s license plate. Optical character recognition (OCR) software will convert the license plate image into numbers which can be stored as data. Additionally, if the WIM sensor indicates the truck is overweight, an appropriately configured virtual weigh site can trigger a side view camera to capture a digital image of the overweight vehicle. The system will then marry these three pieces of data and send an image, via wireless communication, to the motor carrier enforcement computer located in a central office where it can be stored and can be accessed (via secure internet access) by an enforcement officer’s laptop computer (or smartphone) at a roadside location. The image may consist of the digital photo of the vehicle superimposed with WIM data and the license plate number. Those trucks that are overweight can also trigger an alert to the weigh station personnel at the closest facility.
It is important to note that it is not a crime to avoid a weigh station by circumventing it with an alternate route; however, this system captures data on non-violators and allows enforcement personnel to identify the trends of various carriers. This can lead to targeted inquiries as to why a motor carrier consistently bypasses the weigh station.
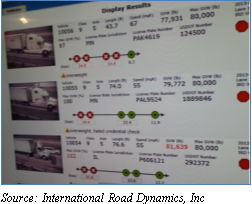 Virtual weigh systems can have many configurations and also employ various types of technologies depending upon the needs and budget of the jurisdiction’s commercial vehicle enforcement program. Technologies can include:
- Weigh-in-Motion
- License Plate Readers
- Transponder Readers
- Optical Character Recognition (USDOT Number Reader)
- Container Character Recognition
- CCTV
- Height Detection System
- Three Dimensional Imaging
- Thermal Imaging
The data collected by these systems can provide speeds, weights, time of day, vehicle identification, motor carrier identification, vehicle height, vehicle length, indication of brake malfunction, status of motor carrier operating credentials, determination of stolen vehicle (license plates), and support Amber Alerts, Silver Alerts, or criminal BOLO (be on the lookout) alerts.
Approximate Cost:
The costs to deploy virtual weigh sites are entirely dependent upon each system’s purpose, technological configuration, and available communications network. Some of the more basic systems can cost less than $100,000 (with basic WIM and an onsite data collection device) or can approach $700,000 for a sophisticated, fully equipped site (Taylor, 2014). Annual maintenance costs range between $9,000 and $63,000.
Alternative Technology Approaches
There are several technology-related alternatives in existence to support commercial vehicle size and weight compliance and enforcement. Some of these technologies are used solely for data collection, some for preserving infrastructure elements, and others for helping the motor carrier community achieve compliance without enforcement intervention.
Bridge Weigh-in-Motion
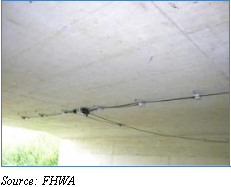 A 2007 FHWA scanning report (USDOT, FHWA, 2007, p.5) discusses what can best be described as “Bridge WIM.” According to the report, Slovenia has emerged as a leader in the development of this bridge WIM system technology.
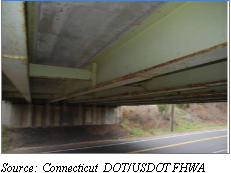 With this system, weight detection equipment is applied to the bottom of a bridge slab. This location eliminates the need to disrupt traffic on the bridge during installation. Multiple sensors are installed, and it is reported that axle weights, gross vehicle weights, axle spacing, vehicle speeds, and vehicle classification can be captured if the technology is correctly installed. The vehicle weights are reportedly accurate enough to use for enforcement screening. The Slovenia Bridge WIM system typically uses 16 sensors to measure the weights over two lanes of traffic. These sensors are a series of strain transducers mounted under the bridge deck that “measure” the weight of vehicles passing over the bridge. The system can also be configured with a camera to capture video images of the vehicles being weighed. These images, along with the weights of the trucks, can be electronically stored or transmitted to a downstream enforcement site.
A similar Bridge WIM project was undertaken by Connecticut DOT (ConnDOT). This system also used sensors to measure bridge strain from a steel girder bridge. ConnDOT and the University of Connecticut determined that Bridge WIM, as tested, provided gross vehicle weight accuracy levels that were ±16 percent. While this level of accuracy is not sufficient for enforcement purposes, it is a good sorting mechanism (loaded vs. empty trucks) and could be useful for planning applications. A study of the Connecticut project recommends further research to improve and refine this concept (Wall et al., 2009, p 41).
Roadway-Driver Interface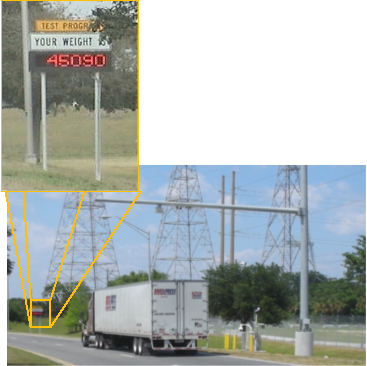
The Florida Department of Transportation, with support from the Florida Atlantic University and the University of Central Florida, conducted a pilot test at the Port of Jacksonville. This initiative proved the feasibility of utilizing WIM, Three Dimensional Imaging, CCTV, License Plate Reading Technology, Container Character Recognition, Optical Character Recognition (USDOT reader), and a mini weather station combined with a dynamic message sign to inform commercial vehicle drivers of their truck weights and give them the opportunity to operate legally if an overweight permit is required.
The system was set up at a Port of Jacksonville container terminal exit (in the right lane of two lanes) and each truck had the opportunity to drive over the WIM and see their weights posted in real-time on the dynamic message sign strategically located where they could see it. This information allowed those motor carriers operating overweight to contact their dispatcher to obtain a permit so they could operate legally.
The system recorded multiple instances where drivers deliberately moved into the lane with the WIM to view the weight of their vehicle upon exiting the terminal, illustrating the drivers’ desire to know the operating weight of their vehicles.
On-Board Weighing
Another approach that is in use today, but could be expanded in the near future, is the use of On-board scales. While primarily used by industry in the United States as a self-check enhancement, Australia routinely requires operational on-board weighing systems as an approval condition for an overweight load to receive a permit under Australia’s Intelligent Access Program. Compliance with permitted vehicle weight limits is monitored by enforcement through a commercial mobile radio connection to the vehicle while it is in transit. This technology uses equipment on board the truck and trailer to determine the weight of the vehicle as it is loaded. This data can be used by the commercial motor vehicle industry for invoicing purposes when picking up and delivering loads. With the emerging Vehicle to Vehicle (V2V) and Vehicle to Infrastructure (V2I) systems that are in early stages of deployment, the on-board scales can be utilized by properly equipped enforcement vehicles to determine the weights of trucks while in motion and potentially eliminate any need to stop at weigh sites.
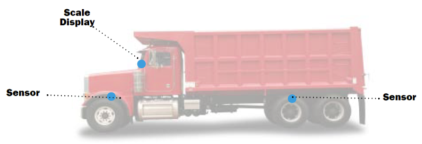

Alternative Programmatic Approaches
In addition to the alternative enforcement technologies mentioned above, there are also alternative programmatic approaches to weight enforcement. These may or may not involve the use of one or more technology components previously mentioned. There are a variety of complex considerations and challenges for each of these enforcement approaches; for a detailed summary of these, plus detailed information on specific international and US. State-specific programs, see Appendix A. The following are short descriptions of three alternative approaches which were documented during the literature review conducted as part of the 2014 CTSW Study. During the literature review the majority of the “alternative approaches” could be categorized into the following three types of programmatic enforcement approaches: chain of responsibility, accreditation schemes or incentive programs, and relevant evidence.
In a chain of responsibility enforcement program, all entities in the supply chain—consigning, loading, carrying, driving, and receiving—are held responsible for assuring that the commercial vehicle which is transporting the load operates legally (Leyden et al., 2004, p. 6). If weight enforcement laws are broken, under this type of program, penalties can be applied to any or all of the entities in the supply chain. In Australia, their chain of responsibility program also aims to integrate responsive regulation, which provides a range of penalties tied to each company’s relative risk in assuring compliance and past performance (Jones, 2012, pp. 9-10).
Accreditation schemes and incentive programs can be voluntary or mandated. In these types of programs, operators certify their compliance through an audit process. In some instances, operators that achieve regulatory compliance are rewarded with productivity incentives, such as allowance to operate above the basic truck size and weight limits or less frequent site visits for company audits and vehicle inspections (OECD 2011, pp. 284-287).
Civil weight enforcement or “relevant evidence” programs (such as in Minnesota) allow enforcement officers to review bills of lading or other forms of truck weight records at a shipper or motor carrier office to be used as legal evidence that an overweight violation has occurred (Thooft, 2013). Other relevant evidence that may be used in this type of program is WIM data that identifies habitual offenders. This information can be used by enforcement personnel to target these companies for site visits or civil citations. (URS, 2005, p. 51). New York State also uses an administrative law process to review inspection reports and traffic information “after the fact” to place additional fines on egregious violators (McDonough, 2013).
Summary and Potential Technology Implications
Table 4 provides a summary of this description of enforcement technologies, focusing on the costs for equipment, installation, and annual maintenance for these technologies.
A concern associated with allowing heavier and longer trucks into the traffic stream is the potential for these vehicles to escalate enforcement costs because the enforcement task becomes more onerous or the trucks exceed the capacity of existing enforcement technologies. Based on the review of enforcement technologies provided in this sub-section, this potential concern appears valid only for fixed static scales, portable scales, and semi-portable scales, as the operation and performance of the other technologies and systems will continue to be just as effective.
Truck configurations with more axles or axle groups will require additional weighing time if weighed using static scales designed to weigh axle groups, semi-portable scales, or portable scales. Longer trucks may exceed the length capacity of fixed static scales designed to weigh the entire truck at once. The costs for replacement of new and longer scales would not be insignificant.
According to the National Institute of Standards and Technology (NIST) Handbook 44 (NIST 2011, p. 2-50), any weighings of traded commodities must be weighed by single draft method (see excerpt below).
UR.3.3. Single-Draft Vehicle Weighing. – A vehicle or a coupled-vehicle combination shall be commercially weighed on a vehicle scale only as a single draft. That is, the total weight of such a vehicle or combination shall not be determined by adding together the results obtained by separately and not simultaneously weighing each end of such vehicle or individual elements of such coupled combination.
However, the weight of a:
(a) Coupled combination may be determined by uncoupling the various elements (tractor, semitrailer, trailer), weighing each unit separately as a single draft, and adding together the results; or
(b) Vehicle or coupled-vehicle combination may be determined by adding together the weights obtained while all individual elements are resting simultaneously on more than one scale platform.
Note: This paragraph does not apply to highway-law-enforcement scales and scales used for the collection of statistical data. (Added 1992)
The Note in the excerpt above states that the NIST requirement does not apply to highway law enforcement. With respect to the static scales currently in use for law enforcement, many States have developed procedures, polices, and statutes that permit truck weighings on static scales that are smaller than the actual length of the tractor and trailer. If there allowable truck lengths on the Nation’s highways were to increase, the same State-developed procedures, policies and statutes in use today could be utilized with no additional equipment replacements or costs.
National-Level Trends
This sub-section describes enforcement program costs and resources at the national level, including an analysis of the available enforcement program funding reported annually in each State’s State Enforcement Plan (SEP) as enforcement program costs. In addition, the SEPs indicate the quantity and type of weigh scales used for truck weight enforcement on an annual basis. The analyses identifies characteristics and trends in program costs and weigh scale usage for 2008 through 2012 for all reporting States.
Enforcement Program Costs
Nationwide, the total cost of delivering truck size and weight enforcement programs as reported in the SEPs increased between 2008 and 2012 from approximately $489 million in 2008 to $613 million in 2012 (in 2011 US Dollars (USD)). Table 4 shows the total cost (in 2011 USD) for each of these years and the number of States for which cost data were available in each year. The table also reports program costs as they are reported in each of the 5 years without adjusting for inflation; these costs are shown in italics. The increase in total costs—particularly between 2009 and 2010—is partly due to the increase in the number of reporting States (from 41 to 48). The only evident year-to-year cost decrease (in 2011 USD) during this five-year period occurred between 2010 and 2011, when the same 48 States reported total costs in each year. The reported cost data are obtained from SEPs submitted by a total of 50 States, including the 49 jurisdictions in the contiguous United States and Alaska. For two States, cost data were unavailable in each of the 5 years.
As shown in Table 5, the total TSW enforcement costs do not account for enforcement activity in all States. Adjusting for the two States where cost data were unavailable, the total nationwide 2011 TSW enforcement cost could be approximately $635 million. Thus, when estimating total costs for all States, the total is about 6 percent higher than the sum of the reported 2011 costs (in 2011 USD). This estimate is calculated by first normalizing each State’s total enforcement cost by dividing it by the total truck VMT in that State. Then, using the median value of cost per truck VMT for the reporting States, the total costs in the two non-reporting States are estimated by applying this median value to the truck VMT in those States.
| Enforcement Program Costs (in millions of 2011 USD)1 | |||||
|---|---|---|---|---|---|
| Enforcement Program Costs (in millions of reported year USD) | |||||
| 2008 | 2009 | 2010 | 2011 | 2012 | |
| Total | $ 489 | 546 | $ 612 | $ 600 | $ 613 |
| $ 468 | $ 520 | $ 593 | $ 600 | $ 626 | |
| # of States | 41 | 41 | 48 | 48 | 47 |
1 All costs are normalized to 2011 USD using the Consumer Price Index published in December 2013 by the Bureau of Labor Statistics. Return to Footnote 1 in Table 5
The inconsistencies in the cost data submitted by States over the 5-year period inhibit a reliable analysis of annual trends in TSW enforcement program costs. Therefore, the trend analyses include only the 32 States that provided data about total enforcement program costs and the allocation of costs to facilities and personnel in each of the 5 years (2008 to 2012, inclusive). As shown in Table 6, for these 32 States, total enforcement program costs (in 2011 USD) increased from $432 million in 2008 to $489 million in 2010, then decreased to $475 million in 2011 before rising to $487 million in 2012. The table also reports program costs as they are reported in each of the 5 years without adjusting for inflation; these costs are shown in italics.
Table 6 also shows annual costs for personnel and facilities for the 32 reporting States. Personnel costs (in 2011 USD) exhibit a similar pattern as total costs, increasing from $348 million in 2008 to $419 million in 2010 before decreasing to approximately $411 million in 2011 and 2012. Proportionally, when aggregating costs for all 32 States, personnel costs represent approximately 85 percent of total costs in 2010, 2011, and 2012. The proportions of personnel costs to total costs in 2008 and 2009 are influenced by anomalies in the reported facilities and other costs for a single state.
Reported facilities costs (in 2011 USD) are highest in 2008 at nearly $80 million, then decrease to less than $65 million annually from 2009 to 2011 before increasing back to $74 million in 2012. The inclusion of both capital and operating expenditures as part of the facilities costs gives rise to year-to-year fluctuations in certain States. In particular, the relatively high facilities costs in 2008 results from an unusually high cost reported in a single State. The other costs shown in Table 6 represent the difference between the total cost and the sum of the personnel and facilities costs. These costs are relatively small, except for in 2009 when the total costs reported in a single State were substantially higher than the sum of the personnel and facilities costs in that State. The reason for this discrepancy is not apparent in that State’s SEP.
| Enforcement Program Costs (in millions of 2011 USD) 1 | |||||
|---|---|---|---|---|---|
| Enforcement Program Costs (in millions of reported year USD) | |||||
| 2008 | 2009 | 2010 | 2011 | 2012 | |
| Total | $ 432 | $ 480 | $ 489 | $ 475 | $ 487 |
| $ 414 | $ 458 | $ 474 | $ 475 | $ 497 | |
| Personnel | $ 348 | $ 363 | $ 419 | $ 411 | $ 412 |
| $ 333 | $ 346 | $ 406 | $ 411 | $ 420 | |
| Facilities | $ 80 2 | $ 62 | $ 65 | $ 61 | $ 74 |
| $ 76 | $ 59 | $ 63 | $ 61 | $ 75 | |
| Other 3 | $ 4 | $ 55 | $ 5 | $ 4 | $ 2 |
| $ 4 | $ 53 | $ 5 | $ 4 | $ 2 | |
1 The costs shown in the table are summed for the 32 States that reported total (non-zero) costs for each year from 2008 to 2012, inclusive, in the total, personnel, and facilities cost categories. All costs are normalized to 2011 USD using the Consumer Price Index published in December 2013 by the Bureau of Labor Statistics. Return to Footnote 1 in Table 6
2 The relatively high facilities costs in 2008 results from an unusually high cost reported in a single State. Return to Footnote 2 in Table 6
3 Other costs represent the difference between total costs and the sum of personnel and facilities funding. These costs are relatively small, except for in 2009 when the total costs reported in a single State were substantially higher than the sum of the personnel and facilities costs in that State. The reason for this discrepancy is not apparent in the State’s SEP. Return to Footnote 3 in Table 6
The characteristics and trends evident in Table 6 provide a national perspective on TSW enforcement program costs; however, this perspective masks the variation and trends in program costs for individual States. Figure 1 depicts the difference between 2008 and 2012 reported total TSW enforcement costs by state. Of the 32 reporting States, 19 reported an increase in total costs and 13 reported a decrease. In terms of the magnitude of these changes, nine States reported a cost increase of over 20 percent, whereas one State reported a cost decrease of over 20 percent. Of these nine States, six experienced increases in both personnel and facilities costs while the remaining three experienced increases in personnel costs only. Cost reductions for both personnel and facilities contributed to the cost decrease in the State reporting a cost decrease of over 20 percent.
Figure 1: Difference Between 2008 and 2012 Total TSW Enforcement Costs by State
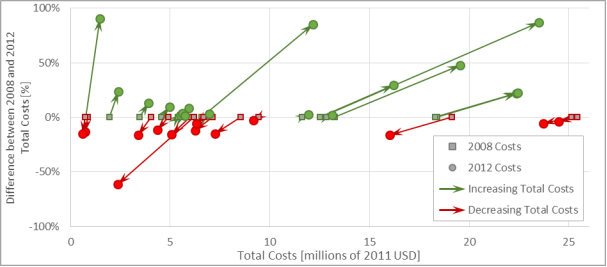
Notes: The costs plotted in the figure are for 2008 and 2012 only and do not reflect costs reported in 2009 through 2011, inclusive. The figure depicts 30 of the 32 reporting States; two States have not been plotted because their total costs exceed the scale of the figure. One State had a total cost of $107 million (2011 USD) in 2008 that increased 28 percent by 2012; the other State had a total cost of $55 million (2011 USD) in 2008 that increased 3 percent by 2012.
The variability evident in State-specific enforcement costs when disaggregating them into personnel and facilities costs constrains a meaningful analysis of trends. Figure 2 and Figure 3 depict this variability for personnel costs and facilities costs, respectively, in the 32 reporting States for 2008 through 2012. The figures plot the mean annual cost and the variability of these costs (in terms of the standard deviation evident from the data) over the 5 years. Comparing costs reported for 2008 and 2012 specifically, 20 of the 32 reporting States experienced an increase in personnel costs while 12 experienced a decrease. Similarly, for facilities costs, 14 of the 32 reporting States experienced a cost increase and 18 reported a cost decrease.
Figure 2: Mean Annual Personnel Costs and Variability by State: 2008 to 2012
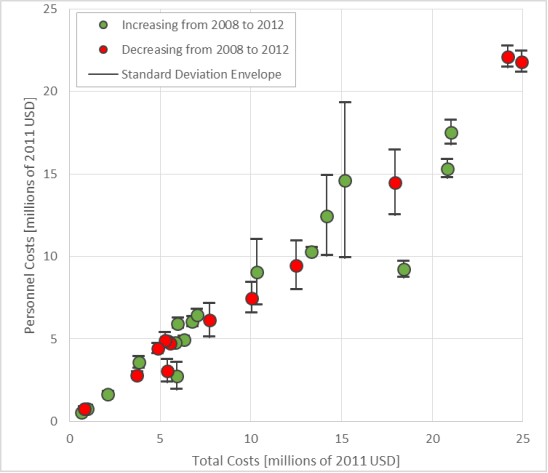
Notes: The cost increases (depicted as green dots) and cost decreases (depicted as red dots) reflect cost changes between 2008 and 2012 only, and do not account for costs reported in 2009 through 2011. The costs plotted in the figure are for 30 of the 32 reporting States; two States have not been plotted because their costs exceed the scale of the figure. These two States reported an increase in personnel funding. One State had a mean total cost of $131 million and a mean personnel cost of $107 million with a standard deviation in personnel costs of $28.8 million over the 5 years. The other State had a mean total cost of $55 million and a mean personnel cost of $50 million with a standard deviation in personnel costs of $1.5 million over the 5 years. All cost figures are in 2011 USD.
Figure 3: Mean Annual Facilities Costs and Variability by State: 2008 to 2012
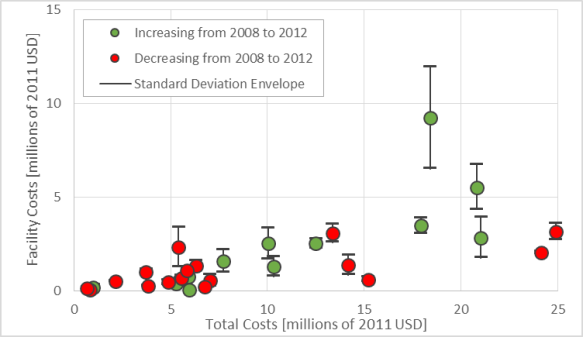
Notes: The cost increases (depicted as green dots) and cost decreases (depicted as red dots) reflect cost changes between 2008 and 2012 only, and do not account for costs reported in 2009 through 2011. The costs plotted in the figure are for 30 of the 32 reporting States; two States have not been plotted because their costs exceeded the scale of the figure. One of these States reported an increase in facility funding, a mean total cost of $131 million, and a mean facility cost of $14 million with a standard deviation in facility costs of $12.3 million over the 5 years. The other State reported a decrease in facility funding, a mean total cost of $55 million, and a mean facility cost of $5 million with a standard deviation in facility costs of $0.1 million over the 5 years. All cost figures are in 2011 USD.
Figure 4 shows the data that are plotted separately in Figure 2 and Figure 3 in one graph to simultaneously reveal mean annual costs and cost variability for both personnel and facilities for the reporting States. Over the 5-year period, half of the States reported only minor changes (standard deviation less than $0.5 million) in personnel or facilities costs and most of these States have relatively low enforcement budgets. In contrast, higher variability tends to exist for those States with higher mean annual personnel or facilities costs. In these States, this variability is typically due to 1 or more years of markedly higher investments in the enforcement program.
Figure 4: Mean Annual Personnel and Facilities Costs and Cost Variability by State: 2008 to 2012
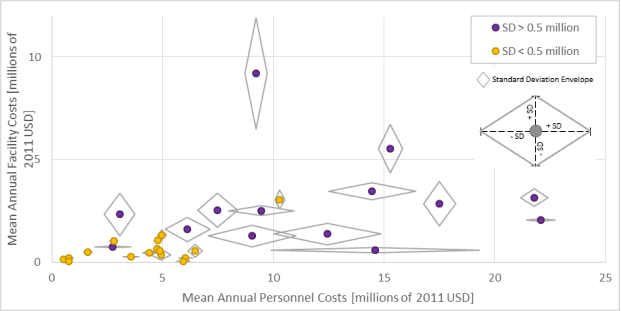
Notes: The costs plotted in the figure are for 30 of the 32 reporting States; two States have not been plotted because their costs exceeded the scale of the figure. One State has a mean annual facility cost of $14 million with a standard deviation of $12 million and a mean annual personnel cost of $107 million with a standard deviation of $28.8 million. The other State has a mean annual facility cost of $5 million with a standard deviation of $0.1 million and a mean annual personnel cost of $50 million with a standard deviation of $1.5 million. All cost figures are in 2011 USD.
Truck Weight Enforcement Scales
Beyond cost data, the quantity of weigh scales used in a State is another way of understanding the resource inputs for TSW enforcement programs. Nationwide, annual trends in the total reported number of weigh scales vary by weigh scale type. The SEPs contain statistics about four types of weigh scales, namely: fixed platform (static scales), portable scales, semi-portable scales, and weigh-in-motion (WIM) scales. A total of 50 States reported statistics about weigh scale usage each year, from 2008 to 2012, inclusive. Table 7reveals the following:
- The number of fixed platform scales increased from 726 in 2008 to 822 in 2010 before leveling off and decreasing slightly to 817 in 2012.
- The number of portable scales increased each year from 2008 through 2012, rising from a total of 13,230 to 15,012. However, it appears that certain States may be reporting the actual number of portable scales in operation while others may be reporting the number of locations at which portable scales are used or even the number of weighings conducted with portable scales.
- The number semi-portable scales decreased from 238 in 2008 to 221 in 2012.
- The number of WIM scales used for TSW enforcement has increased each year from 2008 through 2012, rising from a total of 625 in 2008 to 793 in 2012. Within this period, the largest increase occurred from 2009 to 2010, when the number of WIMs increased by 10 percent.
State-level differences in the number of scales (by scale type) reported in 2008 and 2012 follow:
- Sixteen States reported an increase in the number of fixed platform scales, 13 reported a decrease, and 21 reported no change.
- Twenty-nine States reported an increase in the number of portable scales, 11 reported a decrease, and 10 reported no change.
- Nine States reported an increase in the number of semi-portable scales, 11 reported a decrease, and 30 reported no change.
- Twenty-six States reported an increase in the number of WIM scales, 5 reported a decrease, and 19 reported no change.
A State’s investment in various types of weigh scales relates to the proportion of its total costs allocated to enforcement personnel. As shown in Figure 5, the quantity of portable scales used by a State is positively correlated with the State’s personnel costs. This reflects the fact that weighings by portable scales require higher levels of personnel hours compared to weighings using the other types of weigh scales. Conversely, the quantity of fixed, semi-portable, and WIM scales in a State is relatively independent of the State’s personnel costs.
Figure 5: Number of Weigh Scales by Scale Type as a Function of Personnel Costs: 2011
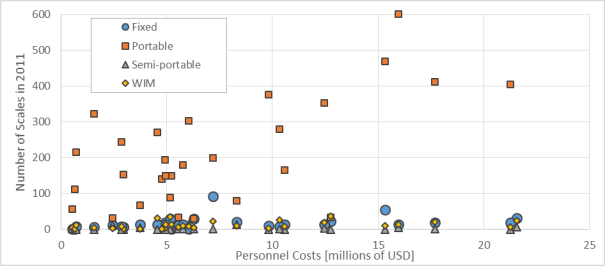
Nearly all (49 of 50) States report using a combination of weigh scales for truck weight enforcement. In the State where this is not the case, the strategy has been to move away from sites featuring traditional fixed infrastructure. Most fixed scales are located on Interstate highways near State and international border crossings. WIM scales are most often used for sorting or pre-screening at fixed scale locations, monitoring truck weights on scale bypass routes, and identifying potential violators for mobile operations where trucks detected as overweight by WIM scales are pulled over at pull-outs, safety rest areas, or other locations where portable scales can be safely used to conduct a static weighing. Although there is a movement to virtual weigh stations or virtual weighing technology in nearly all States, the definition of equipment and practices that define virtual weight enforcement varies.
State-Level Comparative Analysis
Building on the foregoing analysis of enforcement program costs (inputs) at the national level, the State-level comparative analysis considers how enforcement costs and resources may differ between States that allow vehicles in excess of Federal truck weight limits (i.e., above-limit States) and States that do not allow vehicles in excess of Federal limits (i.e., at-limit States).
Figure 6 shows the total cost per VMT for the 29 analysis states in 2011 disaggregated into at-limit and above-limit categories (see Table 3; page 16). Cost differences between the at-limit and above-limit States are not readily apparent from the data. For the at-limit States, the total enforcement program cost ranges from $0.40 to $8.70 per thousand truck VMT, with a median cost of $1.80 per thousand truck VMT. Comparatively, for the above-limit States (excluding one outlying State), the total enforcement program cost ranges from $0.50 to $3.60 per thousand truck VMT, with a median cost of $2.00 per thousand truck VMT.
Based on this comparison, differences in enforcement costs normalized by VMT are not readily attributable to whether or not a State allows trucks to operate above Federal limits. Rather, differences in how States deliver enforcement programs (e.g., methods of enforcement used, intensity of enforcement) may be more influential on total costs. In addition, normalizing costs using VMT may elevate costs per VMT in States that have enforcement responsibilities for extensive highway networks with relatively low truck volume.
Figure 6: Total Enforcement Program Costs per Million Truck VMT: 2011
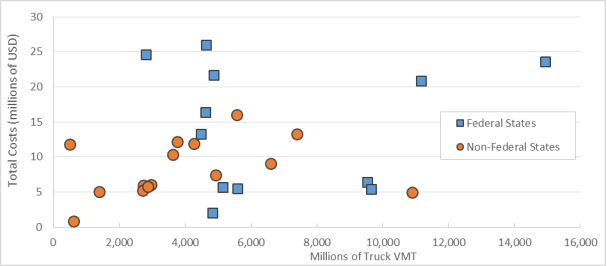
Notes: “Federal States” refers to States with maximum weight limits consistent with the 80,000 lb. Federal maximum GVW; these are also referred to as “at-limit States.” “Non-Federal States” refers to States with maximum legal weight limits that exceed the Federal limits, also referred to as “above-limit States.” The figure depicts enforcement program costs for 27 of the 29 analysis States. One at-limit State is not depicted in the figure due to scaling; this State has a truck VMT of 31,173 million and a total cost of $54.7 million. Cost data were unavailable for one above-limit State.
Figure 7 shows the total number of scales (for fixed, portable, and WIM scales) normalized by VMT for the 29 analysis States in 2011, disaggregated into the at-limit and above-limit categories. Figure 7 does not include the quantity of semi-portable scales because the majority of States operated two or fewer semi-portable scales in 2011, and about 40 percent did not operate any.
Figure 7: Number of Weigh Scales per Million Truck VMT
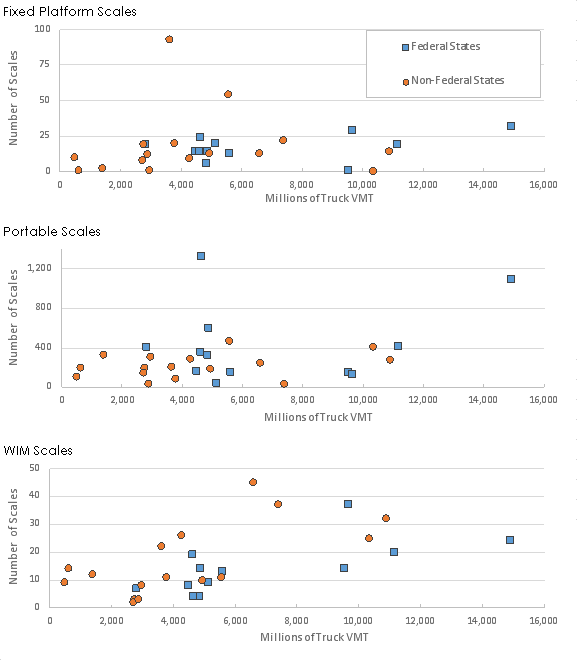
Notes: “Federal States” refers to States with maximum weight limits consistent with the 80,000 lb. Federal maximum GVW; these are also referred to as “at-limit States.” “Non-Federal States” refers to States with maximum legal weight limits that exceed the Federal limits, also referred to as “above-limit States.” The figure depicts the number of scales for 28 of the 29 analysis States. One above-limit State is not depicted due to scaling; this State has a truck VMT of 31,173 million and 57 fixed platform, 1,800 portable, and 10 WIM scales.
The data plotted in the figure reveals the following:
- For fixed scales, there is effectively no difference in the median number of scales per truck VMT between at-limit and above-limit States. The median number of fixed scales per billion truck VMT for both the at-limit and above-limit categories is about three.
- For portable scales, there is effectively no difference in the median number of scales per truck VMT between at-limit and above-limit States. The median number of portable scales per billion truck VMT for at-limit States is about 58, compared to about 53 for above-limit States.
- For WIM scales, there is effectively no difference in the median number of scales per truck VMT between at-limit and above-limit States. The median number of WIM scales per billion truck VMT for at-limit States is about two, compared to about three for above-limit States.
Overall, the State-level comparative analysis of the number of weigh scales in use revealed no effective differences between at-limit and above-limit States. In other words, States which allow trucks to operate in excess of Federal limits did not exhibit a different weigh scale investment strategy than States that adopt Federal limits.
Truck Weight Enforcement Cost Comparisons for the Alternative Truck Configurations Introduced in the Scenario Analysis
The vehicle-specific comparative analysis provides a second way of revealing potential cost differences associated with enforcing truck weights for trucks that operate within Federal limits and trucks that operate beyond those limits. Specifically, this comparative analysis examines the time required to weigh the six alternative truck configurations and the two control vehicles being studied as a function of the type of weigh scale.
Table 8 provides the estimated weighing times for single-semitrailer trucks by scale type based on data gathered from commercial motor vehicle State enforcement officials. The following points summarize the key results from weighing single-semitrailer trucks:
- Five-axle tractor semitrailer at 80,000 lb. (control vehicle): Officials indicate that it takes between 20 seconds and 15 minutes to weigh a five-axle tractor semitrailer (control vehicle) using a fixed weigh scale (where axles groups are weighed independently), up to about 1 minute using a fixed weigh bridge (which measures the whole vehicle), between 2 and 30 minutes using a portable scale, and between 3 and 30 minutes using a semi-portable scale. Mean weighing times for this vehicle are 4 minutes for a fixed (axle group) weigh scale (about 15 vehicles per hour), 1 minute for a fixed weigh bridge (about 60 vehicles per hour), 14 minutes for a portable scale (about 4 vehicles per hour), and 10 minutes for a semi-portable scale (about 6 vehicles per hour). Median weighing times for this vehicle are 2 minutes for a fixed (axle group) weigh scale, 1 minute for a fixed weigh bridge, 15 minutes for a portable scale, and 4 minutes for a semi-portable scale.
- Five-axle tractor semitrailer at 88,000 lbs.: There is no incremental impact on weighing times for a five-axle tractor semitrailer at 88,000 lb. GVW relative to a five-axle tractor semitrailer at 80,000 lb. GVW (control vehicle) on any type of weigh scale.
- Six-axle tractor semitrailers at 91,000 lb. or 97,000 lbs.: The incremental differences in weighing times between the five-axle tractor semitrailer (control vehicle) and the six-axle tractor semitrailer are independent of the GVW on the six-axle tractor semitrailer (either 91,000 lb. or 97,000 lb.). In other words, the incremental differences are evident because of the extra axle, not the change in GVW. Officials indicate that it takes between 20 seconds and 15 minutes to weigh a six-axle tractor semitrailer using a fixed (axle group) weigh scale, up to about 1 minute using a fixed weigh bridge, between two and 40 minutes using a portable scale, and between 3 and 35 minutes using a semi-portable scale. There is no difference in the mean or median weighing times between the six-axle tractor semitrailer and the control vehicle for the fixed (axle group) weigh scale and fixed weigh bridge. This implies that the officials providing the data assumed that the length of the fixed (axle group) weigh scales is sufficient to accommodate a tridem axle group. For portable scales, the mean time to weigh a six-axle tractor semitrailer is 17 minutes, compared to 15 minutes for the control vehicle (there is no change in median time). For semi-portable scales, the mean time to weigh a six-axle tractor semitrailer is 11 minutes, compared to 10 minutes for the control vehicle (there is no change in median time).
| Alternative Configuration | Estimated Weighing Time (minutes) by Scale Type1 | |||||||||||
|---|---|---|---|---|---|---|---|---|---|---|---|---|
| Fixed weigh scale (weighs axle groups) | Fixed weigh bridge (weighs vehicle) | Portable scale | Semi-portable scale | |||||||||
| Range | Mean | Median | Range | Mean | Median | Range | Mean | Median | Range | Mean | Median | |
| Control Vehicle 3-S2 @ 80K lb. (53') |
<1-15 | 4 | 2 | <1-1 | 1 | 1 | 2-30 | 14 | 15 | 3-30 | 10 | 4 |
| 3-S2 @ 88K lb. (53’) | – | – | – | – | – | – | – | – | – | – | – | – |
| 3-S3 @ 91K lb. (53’) | – | – | – | – | – | – | 2-40 | 17 | 15 | 3-35 | 11 | 4 |
| 3-S3 @ 97K lb. (53’) | – | – | – | – | – | – | 2-40 | 17 | 15 | 3-35 | 11 | 4 |
- The weighing time(s) are identical to those given for the control vehicle.
1 Estimates are obtained from commercial motor vehicle State enforcement officials. Return to Footnote 1 in Table 8
Table 9 provides the estimated weighing times for multiple-trailer trucks by scale type. The following points summarize the key findings about weighing multiple-trailer trucks:
- Five-axle tractor semitrailer with two 28.5-ft.trailers at 80,000 lbs. (control vehicle): Officials indicate that it takes between 20 seconds and 15 minutes to weigh a five-axle tractor semitrailer-trailer (control vehicle) using a fixed weigh scale (where axles groups are weighed independently), up to about 1 minute using a fixed weigh bridge (which measures the whole vehicle), between 3 and 40 minutes using a portable scale, and between 4 and 30 minutes using a semi-portable scale. Mean weighing times for this vehicle are 4 minutes for a fixed (axle group) weigh scale (about 15 vehicles per hour), 1 minute for a fixed weigh bridge (about 60 vehicles per hour), 17 minutes for a portable scale (about four vehicles per hour), and 10 minutes for a semi-portable scale (about six vehicles per hour). Median weighing times for this vehicle are 3 minutes for a fixed (axle group) weigh scale, 1 minute for a fixed weigh bridge, 15 minutes for a portable scale, and 5 minutes for a semi-portable scale.
- Five-axle tractor semitrailer with two 33-ft trailers at 80,000 lbs.: Officials indicate that it takes between 20 seconds and 15 minutes to weigh a five-axle tractor semitrailer-trailer (2 @ 33 ft.) using a fixed (axle group) weigh scale, up to about 2 minutes using a fixed weigh bridge, between 4 and 40 minutes using a portable scale, and between 4 and 35 minutes using a semi-portable scale. There is no difference in the mean or median weighing times between the five-axle tractor semitrailer-trailer (2 @ 33 ft.) and the control vehicle for the fixed weigh bridge and the portable scale. For fixed (axle group) scales, the mean time to weigh a five-axle tractor semitrailer-trailer (2 @ 33 ft.) is 5 minutes, compared to 4 minutes for the control vehicle (there is no change in median time). For semi-portable scales, the mean time to weigh a five-axle tractor semitrailer-trailer (2 @ 33 ft.) is 12 minutes, compared to 10 minutes for the control vehicle (there is no change in median time).
- Seven- and nine-axle triple trailer combinations: Three of the seven officials provided estimates of weighing times for the two triple trailer combinations; thus, the table does not provide the reported range in weighing times or the mean and median weighing times. Rather, the table provides an estimated mean weighing time based on the responses provided and an understanding of how the various weigh scales operate. For fixed (axle group) scales, it takes about 6 minutes to weigh either triple trailer combination, compared to 4 minutes for the control vehicle. This estimated mean is calculated by assuming that the time to weigh an axle group on the control vehicle is the same as the time to weigh an axle group on the triple trailer combinations. For portable scales, it takes about 23 minutes to weigh the seven-axle triple trailer combination and about 30 minutes to weigh the nine-axle triple trailer combination, compared to 17 minutes for the control vehicle. These estimated means are calculated by assuming that the time to weigh an axle on the control vehicle is the same as the time to weigh an axle on the triple trailer combinations. For semi-portable scales, it takes about 14 minutes to weigh the seven-axle triple trailer combination and about 19 minutes to weigh the nine-axle triple trailer combination, compared to 10 minutes for the control vehicle. These estimated means are calculated by assuming that the time to weigh an axle on the control vehicle is the same as the time to weigh an axle on the triple trailer combinations.
| Alternative Configuration | Estimated Weighing Time (minutes) by Scale Type 1 | |||||||||||
|---|---|---|---|---|---|---|---|---|---|---|---|---|
| Fixed weigh scale (weighs axle groups) | Fixed weigh bridge (weighs vehicle) | Portable scale | Semi-portable scale | |||||||||
| Range | Mean | Median | Range | Mean | Median | Range | Mean | Median | Range | Mean | Median | |
| Control Vehicle 2-S1-2 @ 80K lb. (2 @ 28.5’) |
<1-15 | 4 | 3 | <1-1 | 1 | 1 | 3-40 | 17 | 15 | 4-30 | 10 | 5 |
| 2-S1-2 @ 80K lb. (2 @33’) | – | 5 | – | <1-2 | – | – | 4-40 | – | – | 4-35 | 12 | – |
| 2-S1-2-2 @ 105K lb. (3 @ 28.5’) | * | 62 | * | * | *3 | * | * | 234 | * | * | 144 | * |
| 3-S2-2-2 @ 129K lb. (3 @ 28.5’) | * | 62 | * | * | *3 | * | * | 304 | * | * | 194 | * |
- Weighing time(s) are identical to those given for the control vehicle.
* No data were provided.
1 Estimates (except for triple trailer combinations) are obtained from commercial motor vehicle State enforcement officials. Return to Footnote 1 in Table 9
2 The estimated mean is calculated by assuming that the time to weigh an axle group on the control vehicle is the same as the time to weigh an axle group on the triple trailer combinations. Return to Footnote 2 in Table 9
3 For fixed weigh bridges, assuming that the weigh bridge is long enough to weigh the entire vehicle, there would be no incremental weighing time required to weigh a triple trailer combination compared to the control vehicle. However, since weigh bridges may not have adequate length capacity, there may be a need to retrofit these sites to accommodate longer vehicles. Alternatively, there may be opportunities for States to measure GVW by summing individually measured axle group weights. This method of measuring GVW has been adopted in certain States, but is not currently accepted universally. Return to Footnote 3 in Table 9
4 The estimated mean is calculated by assuming that the time to weigh an axle on the control vehicle is the same as the time to weigh an axle on the triple trailer combinations. Return to Footnote 4 in Table 9
Based on the nine-step procedure and assumptions described in Section 2.2, the mean incremental weighing times reported in the foregoing tables were used to estimate the system-wide impacts on enforcement personnel costs caused by the introduction of the alternative truck configurations defined by the six scenarios. Table 10 summarizes the results of the scenario analysis. The table shows decreases in personnel costs for all six scenarios relative to the base case personnel costs. The magnitudes of these decreases range from 0.3 percent (Scenario 1) to 1.1 percent (Scenario 4). Experiential data from State TSW enforcement officials support these results, as no indication was given that a change in the types of trucks in the traffic stream would impact system-wide enforcement costs. In all scenarios, personnel costs decrease because the reduction in VMT (particularly for the five-axle truck configurations) predicted by the scenarios outweighs the increased costs associated with weighing the alternative truck configurations. Viewed another way, the rate at which weighings occur (per VMT) or the time spent conducting a weighing could be increased under the scenario conditions for the same level of expenditures on enforcement personnel.
| Scenario | Personnel Costs1 [2011 USD] | Absolute Difference [2011 USD] | Percent Change [%] | |
|---|---|---|---|---|
| Base Case | Scenario | |||
| Scenario 1 | $ 490,002,480 | $ 488,523,723 | -$ 1,478,757 | -0.3 |
| Scenario 2 | $ 490,002,480 | $ 487,870,549 | -$ 2,131,931 | -0.4 |
| Scenario 3 | $ 490,002,480 | $ 484,999,852 | -$ 5,002,628 | -1.0 |
| Scenario 4 | $ 490,002,480 | $ 484,776,197 | -$ 5,226,283 | -1.1 |
| Scenario 5 | $ 490,002,480 | $ 486,382,715 | -$ 3,619,766 | -0.7 |
| Scenario 6 | $ 490,002,480 | $ 486,431,910 | -$ 3,570,571 | -0.7 |
1 The personnel costs shown in the table are summed for the 44 States that reported personnel (non-zero) costs in 2011. Return to Footnote 1 in Table 10
If enforcement personnel expenditures were to remain constant under the scenario conditions, the reduction of truck VMT may enable an increase in the number of non-WIM weighings that could be conducted. (Chapter 3 provides a detailed discussion of national-level truck weighing trends). Table 11 shows the number of non-WIM weighings for base case and scenario traffic conditions and the additional number of non-WIM weighings that could be performed for each scenario given the personnel cost savings estimated for the scenarios. These estimates assume that the proportion of weighings by weighing method remains constant for all relevant truck configurations within each scenario. Depending on the scenario, the number of additional non-WIM weighings that could be conducted nationwide ranges from nearly 200,000 (Scenario 1) to over 600,000 (Scenarios 3 and 4).
| Scenario | 2011 Non-WIM Weighings1 | Additional Non-WIM Weighings | |
|---|---|---|---|
| Base Case | Scenario | ||
| Scenario 1 | 28,310,492 | 28,122,926 | 187,566 |
| Scenario 2 | 28,887,786 | 28,625,608 | 262,178 |
| Scenario 3 | 28,887,786 | 28,256,956 | 630,830 |
| Scenario 4 | 29,274,235 | 28,653,878 | 620,356 |
| Scenario 5 | 29,370,253 | 28,982,788 | 387,466 |
| Scenario 6 | 29,274,239 | 28,872,395 | 401,843 |
1 Non-WIM weighings are trucks weighed on portable, semi-portable and static scales. Return to Footnote 1 in Table 11.
Translating enforcement personnel cost savings into additional weighings is one option that may impact enforcement program effectiveness. However, other alternatives and issues also warrant consideration.
- Technologies: This report documents numerous technologies designed to automate truck weighing and inspection procedures. Many of these technologies offer opportunities to increase the number of weighings without relying on traditional on-road enforcement methods.
- Current enforcement program status: The option of weighing additional trucks may not be equally appropriate for all States, depending on the current status of a State’s enforcement program. As will be discussed in Chapter 3, States that already achieve a certain level of enforcement intensity (i.e., weighings per truck VMT) may be unlikely to gain additional benefit by further intensifying enforcement. The opposite may be true for States with relatively low enforcement intensity. However, it is not only the quantity of weighings that impacts enforcement effectiveness but also the method used to conduct the weighing (i.e., fixed, portable, semi-portable). Thus, both the number of weighings and the method by which these weighing occur influence enforcement resource allocation strategies.
- Local conditions: Existing and future weighing strategies used by an enforcement agency depend on a host of local conditions, including the extent and nature of the road network, the types of industries operating in a region, the types of commodities being hauled, and the types of truck configurations being used.
The State commercial motor vehicle enforcement officials also provided estimates of weighing times for WIM devices, including those used as a component of a virtual weigh scale. These estimates show that the weighing time for a WIM scale is on the order of a few seconds and does not vary appreciably for different vehicle configurations. The weighing capacity of a WIM effectively varies only by the vehicle speed, which is influenced by the location of the WIM (i.e., on a pre-screening ramp or on the mainline) and factors associated with traffic operations.
In addition to the impacts on weighing times, the introduction of the alternative truck configurations may necessitate costs associated with equipment, information technology, and human resources. Equipment costs that may be incurred include the potential need to upgrade fixed facilities to enable weighing of longer truck configurations. There may also be requirements to purchase additional equipment for officers using portable weigh scales. From an information technology perspective, there may be a need to re-program existing screening algorithms. The level of effort associated with this activity can range from minimal (less than a half-hour) to several hours, depending on whether a site is accessible remotely or requires staff to be onsite to update the equipment. Automated permitting systems may also require reconfiguring. Finally, there may be incremental costs associated with re-training of both the enforcement community and the industry as well as costs associated with concomitant revisions to training and educational materials.
2.4 References
You may need the Adobe® Reader® to view the PDFs on this page.
Hanson, R., of International Road Dynamics Inc. Telephone Interview. February 23, 2014.
Jones, S., “Compliance and Enforcement in Australia’s Brave New Heavy Vehicle World.” International Symposium on Heavy Vehicle Transport Technology – HVTT12. Stockholm, Sweden: International Forum for Road Transport Technology, 2012.
Leyden, P., McIntyre, K., & Moore, B., “Current Australian Approaches to Heavy Vehicle Accreditation and Compliance for Mass Limits.” 8th International Symposium on Heavy Vehicle Weights and Dimensions. Johannesburg, South Africa: Document Transformation Technologies, 2004.
McDonough, R., of New York State DOT. Telephone Discussion. August 2, 2013.
National Institute of Standards and Technology, Specifications, Tolerances, and Other Technical Requirements for Weighing and Measuring Devices, NIST Handbook 44. Washington DC: National Institute of Standards and Technology, 2011.
Organization for Economic Co-operation and Development and the International Transport Forum, Moving Freight with Better Trucks. Paris: Organisation for Economic Co-operation and Development, 2011.
PBS&J, & E-Squared Consulting Corporation, Virtual Weigh Station Feasibility Study. Raleigh, NC: North Carolina Highway Patrol. August 6, 2008.
Taylor, B. of Intelligent Imaging Systems, Inc., Telephone Interview. February 24, 2014.
Thooft, D. of the Minnesota State Patrol, Commercial Vehicle Section, Telephone Discussion. October 8, 2013.
URS, Minnesota Statewide Commercial Vehicle Weight Compliance Strategic Plan. Minneapolis, MN: Minnesota Department of Transportation, 2005.
U.S. Department of Transportation (USDOT), Federal Highway Administration (FHWA), “Weigh-in-Motion Technology - Economics and Performance.” NATMEC ’98. Charlotte, North Carolina: Available at https://www.fhwa.dot.gov/ohim/tvtw/natmec/00024.pdf as of February 24, 2014(a).
U.S. Department of Transportation (USDOT), Federal Highway Administration (FHWA), Commercial Vehicle Size and Weight Program, Freight Management and Operations. Available at https://ops.fhwa.dot.gov/freight/sw/overview/index.htm as of February 24, 2014(b).
U.S. Department of Transportation (USDOT), Federal Highway Administration (FHWA). . Commercial Motor Vehicle Size and Weight Enforcement in Europe. July 2007- International Technology Scanning Program. Washington, D.C.: Federal Highway Administration, 2007.
Van Heel, A. of Intercomp, Telephone Interview. February 24, 2014.
Wall, C., Christenson, R., McDonnell, A., & Jamalipour, A., A Non-Intrusive Bridge Weigh-in-Motion System for a Single Span Steel Girder Bridge Using Only Strain Measurements. Rocky Hill, CT.: Connecticut Department of Transportation Bureau of Engineering and Construction, Office of Research and Materials, 2009.
[2] The 80,000 pound weight reflects the applicable Federal gross vehicle weight limit; a 71,700 gross vehicle weight was used in this study based on empirical findings generated through an inspection of actual weigh-in-motion data. Return to Footnote 2