Freight Facts and Figures 2012
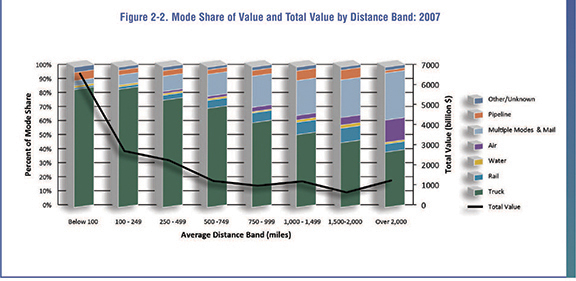
Figure 2-2. Mode Share of Value and Total Value by Distance Band: 2007
By value, trucks move the largest percentage of goods across all distance bands, with the largest share, 84 percent, occurring for the shortest distances. With increasing distance, the multiple modes and mail category's share increases from 4 percent for local travel to a high of 34 percent for the longest distance band.
Figure 2-2
[PDF 3.09MB]
Data represented in the figure.
Billions of Dollars
| Mileage range | Truck | Rail | Water | Air | Multiple Modes and Mail | Pipeline | Other/Unknown | Total | Total Value |
|---|---|---|---|---|---|---|---|---|---|
| Below 100 | 84% | 1% | 1% | 0% | 4% | 6% | 4% | 100% | 6,535 |
| 100-249 | 84% | 2% | 1% | 0% | 7% | 3% | 2% | 100% | 2,670 |
| 250-499 | 76% | 4% | 1% | 2% | 11% | 4% | 2% | 100% | 2,220 |
| 500-749 | 71% | 6% | 1% | 2% | 16% | 3% | 2% | 100% | 1,180 |
| 750-999 | 60% | 7% | 1% | 3% | 22% | 4% | 2% | 100% | 938 |
| 1,000-1,499 | 52% | 9% | 2% | 3% | 25% | 7% | 3% | 100% | 1,163 |
| 1,500-2,000 | 46% | 10% | 2% | 5% | 27% | 7% | 2% | 100% | 609 |
| Over 2,000 | 39% | 6% | 1% | 16% | 34% | 2% | 2% | 100% | 1,204 |
| Total | 74% | 3% | 1% | 2% | 12% | 5% | 3% | 100% |
Sources:
U.S. Department of Transportation, Federal Highway Administration, Office of Freight Management and Operations, Freight Analysis Framework, version 3.4, 2012.
You may need the Microsoft Excel Viewer to view Excel files on this page.
You may need the Adobe® Reader® to view the PDFs on this page.