Freight Facts and Figures 2012
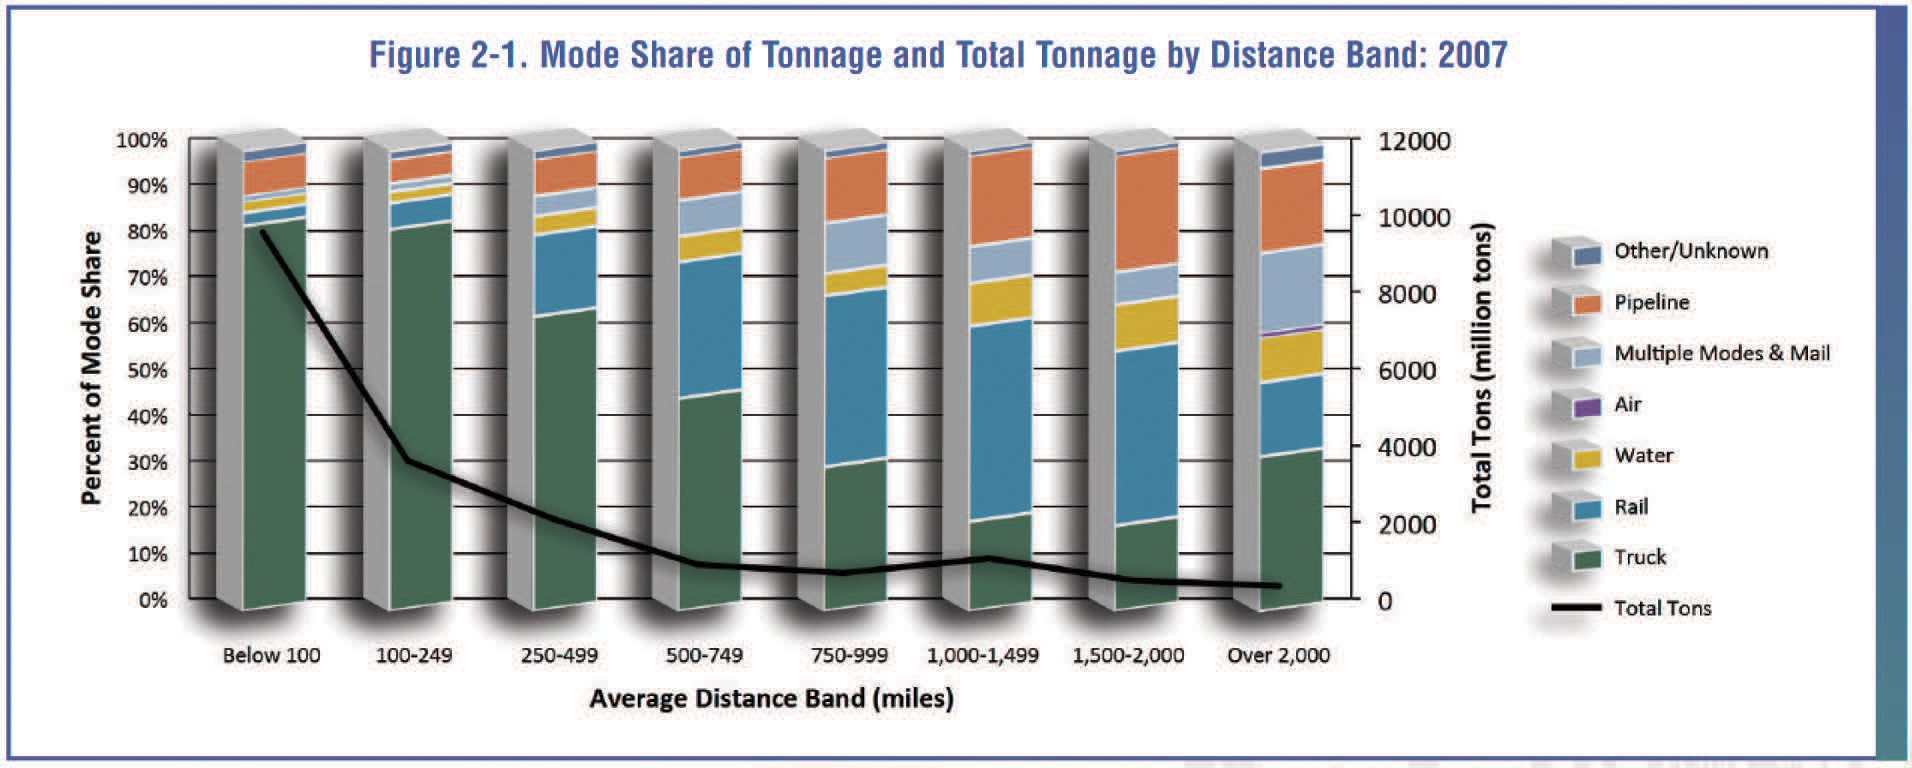
Figure 2-1. Mode Share of Tonnage by Distance Band: 2007
Trucks carry the largest share of goods by weight for distances less than 750 miles and more than 2,000 miles. Rail is the dominant mode for goods moved over distances greater than 750 miles and less than 2,000 miles, accounting for 37 percent of total freight moved.
Figure 2-1
[PDF 2.98MB]
Data represented in the figure.
Millions of tons
| Mileage range | Truck | Rail | Water | Air | Multiple Modes and Mail | Pipeline | Other/Unknown | Total | Total Value |
|---|---|---|---|---|---|---|---|---|---|
| Below 100 | 84% | 3% | 2% | 0% | 1% | 8% | 2% | 100% | 9,540 |
| 100-249 | 83% | 6% | 2% | 0% | 2% | 5% | 2% | 100% | 3,589 |
| 250-499 | 64% | 18% | 4% | 0% | 4% | 8% | 1% | 100% | 2,084 |
| 500-749 | 46% | 30% | 6% | 0% | 8% | 9% | 1% | 100% | 877 |
| 750-999 | 31% | 37% | 5% | 0% | 11% | 14% | 1% | 100% | 658 |
| 1,000-1,499 | 20% | 43% | 9% | 0% | 8% | 20% | 1% | 100% | 1,039 |
| 1,500-2,000 | 19% | 38% | 10% | 0% | 7% | 25% | 1% | 100% | 463 |
| Over 2,000 | 34% | 16% | 10% | 1% | 18% | 18% | 4% | 100% | 326 |
| Total | 72% | 11% | 4% | 0% | 3% | 9% | 2% | 100% |
Source:
U.S. Department of Transportation, Federal Highway Administration, Office of Freight Management and Operations, Freight Analysis Framework, version 3.4, 2012.
You may need the Microsoft Excel Viewer to view Excel files on this page.
You may need the Adobe® Reader® to view the PDFs on this page.