Freight Facts and Figures 2012
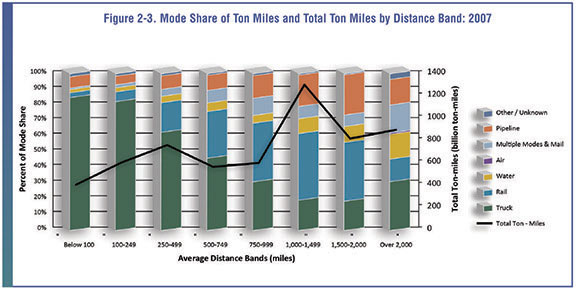
Figure 2-3. Mode Share of Ton Miles by Distance Band: 2007
The modal distribution for ton miles is similar to that for tons, with the exception of long-distance water moves.
Figure 2-3
[PDF 3.03MB]
Data represented in the figure.
Billions of ton-miles
| Mileage range | Truck | Rail | Water | Air | Multiple Modes and Mail | Pipeline | Other/Unknown | Total | Total Value |
|---|---|---|---|---|---|---|---|---|---|
| Below 100 | 85% | 3% | 2% | 0% | 1% | 7% | 2% | 100% | 378 |
| 100-249 | 82% | 6% | 3% | 0% | 2% | 5% | 2% | 100% | 578 |
| 250-499 | 63% | 19% | 4% | 0% | 5% | 8% | 1% | 100% | 734 |
| 500-749 | 46% | 30% | 5% | 0% | 8% | 10% | 1% | 100% | 539 |
| 750-999 | 31% | 37% | 5% | 0% | 11% | 14% | 1% | 100% | 573 |
| 1,000-1,499 | 19% | 42% | 9% | 0% | 8% | 20% | 1% | 100% | 1,274 |
| 1,500-2,000 | 19% | 38% | 10% | 0% | 7% | 26% | 1% | 100% | 791 |
| Over 2,000 | 31% | 14% | 16% | 1% | 18% | 16% | 4% | 100% | 871 |
| Total | 41% | 27% | 8% | 0% | 8% | 15% | 1% | 100% |
Sources:
U.S. Department of Transportation, Federal Highway Administration, Office of Freight Management and Operations, Freight Analysis Framework, version 3.4, 2012.
You may need the Microsoft Excel Viewer to view Excel files on this page.
You may need the Adobe® Reader® to view the PDFs on this page.