|
|
|
final report
Traffic Congestion and Reliability:
Trends and Advanced Strategies for Congestion Mitigation
5.0 Building the Foundation for Effective Transportation Operations
5.1 USING DATA EFFECTIVELY: ARCHIVED OPERATIONS DATA FOR IMPROVED OPERATIONS
5.1.1 Marking Progress Through Performance Measurement
In the last few years, transportation operators have increasingly embraced the concepts of performance measurement—tracking the trends of key indicators of how the transportation system is performing. Performance measurement has been widely used in the private sector as a way to improve delivery of goods and services to customers and ultimately, the success of the enterprise. Fundamentally, this is no different from providing improved transportation services to the public—public agencies are businesses "selling" transportation service and travelers are the consumers "buying" them.
Perhaps the most significant lesson from the review of performance measurement activities over the last two decades is that all performance measures and measurement systems have evolved. The changes have been the result of legislative interests, accountability efforts, new data sources, estimation procedures, changes in knowledge about traffic conditions and perhaps most importantly, growth in demand for the information once reports and data are used. Transportation staff and leaders should experiment with measures, data, and presentation techniques.
5.1.2 Reusing Operations Data for Performance Measurement
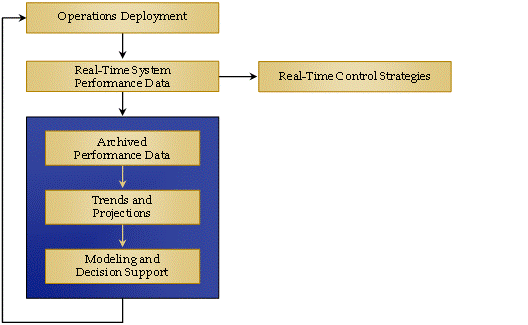
Most major metropolitan areas have advanced technologies deployed to monitor traffic conditions. (See the Appendix for a description of the technologies.) The data are used in real-time to identify traffic back-ups, re-time traffic signals and ramp meters, and for estimating travel times along highway segments. These data are also extremely valuable when stored and used to develop historic trends (Figure 5.1). In fact, the highly detailed nature of these data (typically collected every 20 to 30 seconds at one-half-mile intervals on freeways) allows transportation analysts to conduct many types of analyses previously unavailable to the profession. Foremost among these is the estimation of reliability, which requires continuously collected data in order to build a sufficient history of how travel conditions vary over time.35
Figure 5.1 Reusing Real-Time Operations Data, Used Initially in Control Strategies, Is an Effective Way of Monitoring Performance and Providing Data for Future Assessments

Data sharing may take several forms. For example, operations data could be archived for analysis and used in a number of transportation planning applications, such as calibration of systems planning models, use in micro-simulation models, or for performance monitoring of the transportation system. Effective data sharing can occur in several ways:
- Develop a regional data clearinghouse;
- Coordinate data resources with transit agencies;
- Use special events to initiate new data partnerships;
- Use operations data to develop more effective performance measures and improve planning analysis tools; and
- Use archived data to inform management and operations planning.
Some current examples of what state DOTs are doing with these data to produce performance statistics follows.
Maryland DOT Annual Attainment Report on Transportation System Performance
The Maryland Department of Transportation (MDOT) is required to submit to the state legislature an annual performance measures report (called the "Attainment Report") to evaluate the Department's progress in meeting the goals and objectives of the Maryland Transportation Plan (MTP). Each modal administration identifies performance measures and targets (where feasible) related to one of the four MTP goals: Efficiency, Mobility, Safety, and Productivity/ Quality. All four goals are impacted by congestion making it a key concern in Maryland. Therefore, several performance measures convey information about congestion in Maryland including:
Reduction in Incident Congestion Delay: the number of driving hours saved due to the Coordinated Highway Action Response Team (CHART) traffic incident management system. The State Highway Administration (SHA) developed this measure to track improvements in the operation of Maryland's existing transportation system. CHART traffic incident management program resulted in 26.8 million vehicle hours saved in 2003. SHA's short-term performance target is to save 30.0 million vehicle hours per year.
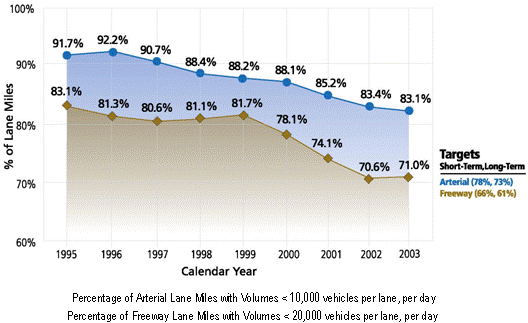
Percentage of lane-miles with average annual volumes below congested levels: the percentage of freeway lane-miles with an average annual density less than 20,000 vehicles per lane per day (vplpd) and percentage of arterials with an average annual density less than 10,000 vplpd. Facilities with densities greater than these vplpd levels will generally result in congested conditions. Figure 5.2 shows that from 1995-2003 the percentage of "congestion-free" miles has decreased. Although the vplpd measure provides useful information, it does not directly address the traveling experience of the system user. MDOT is working with SHA to identify metrics based on travel time for future attainment reports.
In the most recent Attainment Report, the modal administrations were also asked to identify the programs and projects that contributed to changes in performance and describe future performance strategies. For example, to reach the traffic incident congestion reduction target, SHA proposed to expand the number of service patrols. MDOT seeks to control or reverse the growth of lane-miles with high vplpd through capacity expansion, express toll lanes, and using technology to expand the capacity of existing infrastructure.36 Although the performance measures are not directly used in decision-making, the report demonstrates MDOT efforts to implement performance-based planning. In addition, the Annual Attainment Report serves as an important communication tool with the public and elected officials.
Figure 5.2 Percentage of Maryland Lane-Miles with Average Annual Volumes Below Congested Levels

Washington Department of Transportation
The Washington Department of Transportation (WSDOT) quarterly performance report, the Gray Notebook, is one of the nation's leading examples of effective statewide performance monitoring. WSDOT continually improves the Gray Notebook to better communicate how it is addressing state transportation issues. In 2002, WSDOT introduced the concept of travel time reliability and recent efforts to distinguish between recurring and nonrecurring congestion. WSDOT acknowledges that travel time reliability is one of the traveling public's most important concerns.37 WSDOT uses archived freeway operations data to develop several congestion measures (including reliability) for the Seattle region. Examples of the metrics reported by WSDOT include the following, reported as current conditions and changes in annual trends.
- For specific commuter route segments (7 to 24 miles in length):
- The time of day (e.g., 5:20 p.m.) that experiences the worst congestion;
- Travel time on the segment during the peak time;
- "95 percent Reliable Time" (the 95th percentile of travel time);
- Number of days when travel time exceeded twice the free flow travel time; and
- Percent of days where average route speed was less than 35 mph.
- For entire named freeways in the region:
- Vehicle-hours of delay per day;
- Vehicle-hours of delay per highway mile; and
- Vehicle-miles traveled.
- Case studies documenting before/after congestion conditions.
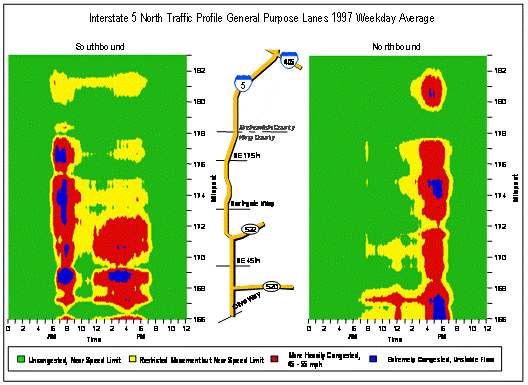
WSDOT also uses geo-isometric graphs to visually locate and express the severity of delay on Washington freeways (Figure 5.3).
Figure 5.3 Example of Seattle's Portrayal of Historic Congestion Patterns

Minnesota DOT Dashboards
Operations data plays a key role in Minnesota DOT (Mn/DOT) performance-based planning approach. Mn/DOT's 2003-2023 Statewide Transportation Plan established 41 performance measures and 6-, 10- and 20- year targets to guide the agency towards its 10 policy goals. The performance measures from the Plan are translated into shorter-term business plans with 2-year targets. One of the operations-based measures, "percent of Interregional Transportation Corridors (IRC) miles meeting target speeds," is used to assess Mn/DOT's attainment of its policy goal "enhance mobility in IRCs linking regional trade centers." Performance data is internally reported using a red-yellow-green dashboards for weekly, monthly, or quarterly monitoring (Figure 5.4). The information the measures, targets and dashboard reports provide guide budget and operational decisions.38
Figure 5.4 Example Minnesota Dashboard
Projects on Schedule (Status Report: November 2002)

5.2 LINKING PLANNING AND OPERATIONS
5.2.1 "Planning for Operations"
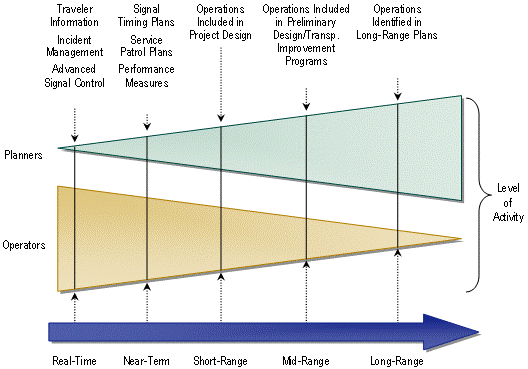
Transportation planning is a long-established tradition in state and local transportation agencies. Its aim is to identify near-term and long-term deficiencies in the transportation system and to identify projects that can be implemented to alleviate them. Regional transportation planning and investment decision-making require a great deal of inter-jurisdictional coordination. Similarly, effective regional transportation systems management and operations require collaboration and coordination among operating agencies across jurisdictions and between transportation and public safety agencies. The focus of linking planning and operations is to provide stronger connections between these two processes and activities as shown in Figure 5.5. The major point is that while each group has its own priorities, both planners and operators need to be involved in all phases of the project development timeline.
Figure 5.5 Planning for Operations
Roles and Activities for Planners and Operators

Note: Operations and planning need to be integrated in order to provide a seamless transition from real-time strategies up to long-range identification of future investments. While the roles shift according to the timeline, both planners and operators need to be involved to some degree at all points of the project development horizon.
Specifically:
- Planners need to have a greater understanding of the role of operations projects and programs in the context of meeting regional goals and objectives, and a greater understanding of to advance these activities.
- Operators need to have a greater understanding of how the long-range planning process can support management and operations activities, and how these activities fit into the context of regional goals and objectives in the planning process.
5.2.2 Developing Regional Collaborations to Foster Operations
Implementing operations strategies cannot be done in isolation—multiple agencies and entire regions are affected. To be more successful at solving regional transportation problems, FHWA is promoting the concept of regional transportation operations collaboration and coordination: a deliberate, continuous, and sustained activity that takes place when transportation agency managers and officials responsible for day-to-day operations work together at a regional level to solve operational problems, improve system performance, and communicate better with one another. To achieve this, agencies within a region can cooperatively develop a Regional Transportation Concept of Operations (RTCO) for how regional operations collaborations should work. Examples of what can be achieved by regional collaboration—and documented in an RTCO—include:
- During traffic incidents and emergencies, transportation system operators and public safety officials improve response times and decision-making by effectively coordinating and communicating with each other;
- During a major highway reconstruction project, public transit services and traffic operations successfully work together to manage demand;
- For special events, public transit services, traffic operations, and public safety services move goods and people and minimize negative effects on the community by coordinating transportation operations and travel demand management;
- Freeway ramp meters work together with arterial signal systems to balance demand throughout the regional network;
- Traffic signals coordinated across multiple jurisdictions manage mobility and demand to meet community needs;
- Road users hear reliable, timely, and relevant news about weather conditions and traffic situations thanks to a regional traveler information service that seamlessly delivers information across jurisdictions, agencies, and modes;
- Customers move easily between travel modes and across jurisdictions because of a multijurisdictional and multi-agency electronic payment service strategy for transit, parking, and tolls;
- Hazardous materials moving through an urban area are electronically identified, monitored, tracked, and coordinated by regional traffic management and public safety agencies to ensure safe, secure, and efficient intermodal movement; and
- Regionally accepted system performance standards and performance measures drive transportation resource investment decisions.
Nationally, we are just beginning to see formation of regional collaborations. However, several regions have already taken the initiative and formed regional collaborations. Examples of products that have emerged from regional collaboration and coordination are:
- In the New York City Metro Area, TRANSCOM's Concept of Operations is important to governing how the member agencies, as well as other agencies involved, interact with each other and share information. TRANSCOM maintains planning documents such as a multiyear strategic plan, an annual business plan and budget, an information and communication systems plan, and a technology programs development plan.
- The Southern California ITS Priority Corridor management Concept of Operations calls for decentralized information sharing and an open system architecture that supports technical information sharing and the integration of different systems. This concept lies behind the strategy to "develop once, deploy many times," thus allowing for cost sharing among the agencies.
- Maricopa Association of Governments (Phoenix, AZ) developed a Regional Concept of Transportation Operations to provide the "big picture" of the region's desired state of transportation operations and management and the institutional commitment to get there.
- Metropolitan Transportation Commission (MTC) in the San Francisco Bay Area's Regional Concept of Operation focuses on freeway management in this multijurisdictional region where congestion and long daily commute trips through multiple jurisdictions are common and freeway expansion is unlikely.
Ultimately, greater coordination and collaboration among planners and operators improves transportation decision-making and benefits the traveling public, businesses, and communities in several ways:
- Improved Ability to Address Short- and Long-Term Transportation Needs – Improved traffic operations information and understanding can help planners better predict future conditions and system improvements. It can also bring attention to operational improvements that can be implemented in a shorter timeframe than traditional infrastructure investments. This will lead to a more effective mix of operational, capital, safety, maintenance, and preservation investments.
- Improved Reliability – Stronger connections between planners and operators help planners consider programs and strategies to improve reliability, such as deployment of technologies to rapidly detect incidents; variable message signs and other approaches for providing quick, reliable traffic information to the public and media outlets; and use of roving incident response teams to quickly clear accidents to open up a roadways for full operation.
- Improved Emergency Preparedness – Regional operations planning and flexibility is a critical element of a secure transportation system. Coordination between planning and operations reinforces efforts to ensure emergency preparedness and transportation security. States and regions that advance operational flexibility in their planning and investment prioritization are building their capacity to address the myriad of emergency and security situations that could arise.
- Most of the analyses presented in Section 2.0 (and some in Section 3.0) use archived operations data.
- Maryland Department of Transportation (2005). Annual Attainment Report of Transportation System Performance.
- Bremmer, Daniela, Keith Cotton, Dan Cotey, Charles Prestrud, and Gary Westby (2004). Measuring Congestion: Learning from Operational Data. Presented at the Transportation Research Board Annual Meeting, January 2004.
- http://www.dot.state.mn.us/dashboards/.
Previous | Table of Contents | Next