Comprehensive Truck Size and Weight Limits Study - Modal Shift Comparative Analysis Technical Report
Executive Summary
Background
This report documents analyses conducted as part of the U.S. Department of Transportation (USDOT) 2014 Comprehensive Truck Size and Weight Limits Study (2014 CTSW Study). As required by Section 32801 of MAP-21 [Moving Ahead for Progress in the 21st Century Act (P.L. 112-141)], Volumes I and II of the 2014 CTSW Study have been designed to meet the following legislative requirements:
- Subsection 32801 (a)(1): Analyze accident frequency and evaluate factors related to accident risk of vehicles to conduct a crash-based analyses, using data from states and limited data from fleets;
- Subsection 32801 (a)(2): Evaluate the impacts to the infrastructure in each State including the cost and benefits of the impacts in dollars; the percentage of trucks operating in excess of the Federal size and weight limits; and the ability of each state to recover impact costs;
- Subsection 32801 (a)(3): Evaluate the frequency of violations in excess of the Federal size and weight law and regulations, the cost of the enforcement of the law and regulations, and the effectiveness of the enforcement methods; Delivery of effective enforcement programs;
- Subsection 32801 (a)(4): Assess the impacts that vehicles have on bridges, including the impacts resulting from the number of bridge loadings; and
- Subsections 32801 (a)(5) and (6): Compare and contrast the potential safety and infrastructure impacts of the current Federal law and regulations regarding truck size and weight limits in relation to six-axle and other alternative configurations of tractor-trailers; and where available, safety records of foreign nations with truck size and weight limits and tractor-trailer configurations that differ from the Federal law and regulations. As part of this component of the study, estimate:
- (A) the extent to which freight would likely be diverted from other surface transportation modes to principal arterial routes and National Highway System intermodal connectors if alternative truck configuration is allowed to operate and the effect that any such diversion would have on other modes of transportation;
- (B) the effect that any such diversion would have on public safety, infrastructure, cost responsibilities, fuel efficiency, freight transportation costs, and the environment;
- (C) the effect on the transportation network of the United States that allowing alternative truck configuration to operate would have; and
- (D) the extent to which allowing alternative truck configuration to operate would result in an increase or decrease in the total number of trucks operating on principal arterial routes and National Highway System intermodal connectors.
To conduct the study, the USDOT, in conjunction with a group of independent stakeholders, identified six different vehicle configurations involving six-axle and other alternative configurations of tractor-trailer as specified in Subsection 32801 (a)(5), to assess the likely results of allowing widespread alternative truck configurations to operate on different highway networks. The six vehicle configurations were then used to develop the analytical scenarios for each of the five comparative analyses mandated by MAP-21. The use of these scenarios for each of the analyses in turn enabled the consistent comparison of analytical results for each of the six vehicle configurations identified for the overall study.
The results of this 2014 Comprehensive Truck Size and Weight Limits Study (2014 CTSW Study) are presented in a series of technical reports. These include:
- Volume I: Comprehensive Truck Size and Weight Limits Study – Technical Summary Report. This document gives an overview of the legislation and the study project itself, provides background on the scenarios selected, explains the scope and general methodology used to obtain the results, and gives a summary of the findings.
- Volume II: Comprehensive Truck Size and Weight Limits Study. This volume comprises a set of the five comparative assessment documents that meet the technical requirements of the legislation as noted:
- Modal Shift Comparative Analysis (Subsections 32801 (a)(5) and (6)).
- Pavement Comparative Analysis (Section 32801 (a)(2)).
- Highway Safety and Truck Crash Comparative Analysis (Subsection 32801 (a)(1)).
- Compliance Comparative Analysis (Subsection 32801 (a)3)).
- Bridge Structure Comparative Analysis (Subsection 32801 (a)(4)).
Purpose of the Modal Shift Analysis
The purpose of this Volume II: Modal Shift Comparative Analysis is to present the analysis of six truck size and weight policy options (scenarios) and to describe in detail the approach, data, models, limitations, and assumptions underlying estimates of potential modal shifts associated with the six scenarios analyzed in the US Department of Transportation (USDOT) Comprehensive Truck Size and Weight Limits Study (2014 CTSW Study). For this study, the term modal shift includes both shifts between truck and rail modes and shifts between vehicles and operating weights within the truck mode.
This Volume II: Modal Shift Comparative Analysis provides the foundation for assessing the full range of potential impacts associated with the truck size and weight scenarios analyzed in the 2014 CTSW Study. Changes in allowable vehicle weights and dimensions will influence the payloads that can be carried on different truck configurations, which in turn will affect:
- The total number of trips and miles of travel required to haul a given quantity of freight,
- The transportation mode chosen to haul different types of freight between different origins and destinations,
- The truck configurations and weights used to haul different types of commodities,
- The axle loadings to which pavements and bridges are subjected,
- Potential highway safety risks,
- The costs of enforcing Federal truck size and weight limits,
- Energy requirements to haul the Nation’s freight,
- Emissions harmful to the environment and to public health,
- Traffic operations on different parts of the highway system,
- Total transportation and logistics costs to move freight by surface transportation modes,
- The productivity of different industries, and
- The competitiveness of different segments of the surface transportation industry.
Impacts are quantified to the greatest extent possible, but where data are unavailable to reliably quantify potential nationwide impacts, qualitative assessments of the impacts of changes in truck size and weight limits are discussed.
Approach
The USDOT study team began this modal shift analysis effort by conducting a desk scan to identify and evaluate potential analytical tools and data sources. A copy of the desk scan is included in Appendix A of this report. Researchers then developed a detailed project plan describing how the analysis would be conducted using analytical tools and data identified in the desk scan. This included estimating truck traffic currently operating within and above existing Federal truck size and weight regulations and specifying truck size and weight scenarios for analysis in the 2014 CTSW Study. USDOT, with stakeholder input, identified the basic vehicle configurations to be analyzed and developed the specifications for those vehicles and how they would operate. The team then developed a set of assumptions necessary for the modal shift analysis, including identifying limitations in the data and analytical methods that might affect the analysis. Finally, researchers estimated the modal shifts associated with each scenario using the analytical tools and data chosen for the analysis.
Current Truck Operations Within and Above Federal Weight Limits
Table ES-1 summarizes current truck traffic operating at weights within and above the 80,000 pound Federal gross vehicle weight (GVW) limit on the Interstate System, other National Highway System (NHS) routes, and highways off the NHS. For purposes of this 2014 CTSW Study, truck configurations are defined in terms of the number of trailers and the number of axles on the vehicle.
There clearly is significant travel above the 80,000 pound Federal GVW limit that applies to Interstate Highways. Much of this travel is off the Interstate System, where State weight limits apply, but much also is on the Interstate System. Some such overweight Interstate System travel occurs in States with “grandfathered” weight limits over 80,000 pounds,[1] some is under non-divisible load permits, and some reflects illegal overloads.
Truck Size and Weight Scenarios
This report analyzes the potential modal shifts associated with six different truck size and weight policy options (scenarios). Each scenario involved estimating the impacts of variations in vehicle configurations and GVWs above the current 80,000 pound Federal weight limit. Table ES-2 shows the vehicles assessed under each scenario as well as the current vehicle configuration from which most freight traffic would likely shift (the control vehicle).
The first three scenarios assess tractor semitrailers that are heavier than generally allowed under currently Federal law. Scenario 1 assesses a five-axle (3-S2) tractor-semitrailer operating at a GVW of 88,000 pound, while Scenarios 2 and 3 assess six-axle (3-S3) tractor semitrailers operating at GVWs of 91,000 and 97,000 pounds, respectively. The control vehicle for these scenario vehicles is the five-axle tractor-semitrailer with a maximum GVW of 80,000 pounds. This is the most common vehicle configuration used in long-haul over-the-road operations and carries the same kinds of commodities expected to be carried in the scenario vehicles.
Scenarios 4, 5, and 6 examine vehicles that would serve primarily less-than-truckload (LTL) traffic that currently is carried predominantly in five-axle (3-S2) tractor-semitrailers and five -axle (2-S1-2) twin trailer combinations with 28 or 28.5-foot trailers and a maximum GVW of 80,000 pounds. Scenario 4 examines a five-axle (2-S1-2) double trailer combination with 33-foot trailers with a maximum GVW of 80,000 pounds. Scenarios 5 and 6 examine triple trailer combinations with 28.5-foot trailer lengths and maximum GVWs of 105,500 (2-S1-2-2) and 129,000 (3-S2-2-2) pounds, respectively. The five-axle twin trailer with 28.5-foot trailers (2-S1-2) is the control vehicle for Scenarios 4, 5, and 6 since it operates in much the same way as the scenario vehicles are expected to operate.
At this point it is important to note that while the control double has an approved GVW of 80,000 pounds, the GVW used for the control double in the study is 71,700 pounds based on data collected from weigh-in motion (WIM)-equipped weight and inspection facilities and is a more accurate representation of actual vehicle weights than the STAA authorized GVW. Using the WIM-derived GVW also allows for a more accurate representation of the impacts generated through the six scenarios.
| Scenario | Configuration | Depiction of Vehicle | # Trailers or Semi-trailers | # Axles | Gross Vehicle Weight (pounds) |
Roadway Networks |
|---|---|---|---|---|---|---|
| Control Single | 5-axle vehicle tractor,53 foot semitrailer (3-S2) | 1 | 5 | 80,000 | STAA 1 vehicle; has broad mobility rights on entire Interstate System and National Network including a significant portion of the NHS | |
| 1 | 5-axle vehicle tractor, 53 foot semitrailer (3-S2) | 1 | 5 | 88,000 | Same as Above | |
| 2 | 6-axle vehicle tractor, 53 foot semitrailer (3-S3) | 1 | 6 | 91,000 | Same as Above | |
| 3 | 6-axle vehicle tractor, 53 foot semitrailer (3-S3) | 1 | 6 | 97,000 | Same as Above | |
| Control Double | Tractor plus two 28 or 28 ½ foot trailers (2-S1-2) | 2 | 5 | 80,000 maximum allowable weight 71,700 actual weight used for analysis 2 | Same as Above | |
| 4 | Tractor plus twin 33 foot trailers (2-S1-2) | 2 | 5 | 80,000 | Same as Above | |
| 5 | Tractor plus three 28 or 28 ½ foot trailers (2-S1-2-2) | 3 | 7 | 105,500 | 74,500 mile roadway system made up of the Interstate System, approved routes in 17 western states allowing triples under ISTEA Freeze and certain four-lane PAS roads on east coast 3 | |
| 6 | Tractor plus three 28 or 28 ½ foot trailers (3-S2-2-2) | 3 | 9 | 129,000 | Same as Scenario 5 3 |
1 The network is the 1982 Surface Transportation Assistance Act (STAA) Network (National Network or NN) for the 3-S2, semitrailer (53’), 80,000 pound gross vehicle weight (GVW) and the 2-S1-2, semitrailer/trailer (28.5’), 80,000 pound. GVW vehicles. The alternative truck configurations have the same access off the network as its control vehicle. Return to Footnote 1
2 The 80,000 pound weight reflects the applicable Federal gross vehicle weight limit; a 71,700 gross vehicle weight was used in the study based on empirical findings generated through an inspection of the weigh-in-motion data used in the study. Return to Footnote 2
3 The triple network starts with the network used in the 2000 Comprehensive Truck Size and Weight (CTSW) Study and overlays the 2004 Western Uniformity Scenario Analysis. The LCV frozen network for triples in the Western States was then added to the network. The triple configurations would not have the same off network access as its control vehicle, the 2-S1-2, semitrailer/trailer (28.5’), 80,000 pound GVW. Use of the triple configurations beyond the triple network would be limited to that necessary to reach terminals that are immediately adjacent to the triple network. It is assumed that the triple configurations would be used in Less-Than-Truck Load (LTL) line-haul operations (terminal to terminal). As a result, the 74,454 mile triple network used in this Study includes: 23,993 mile network in the Western States (per the 2004 Western Uniformity Scenario Analysis, Triple Network), 34,802 miles in the Eastern States, and 15,659 miles in Western States that were not on the 2004 Western Uniformity Scenario Analysis, and the Triple Network used in the 2000 Comprehensive Truck Size and Weight Study (2000 CTSW Study). Return to Footnote 3
With the exception of the triple trailer combinations, the study parameters assume the scenario vehicles are able to travel wherever their control vehicles could operate. For analytical purposes triple trailer combinations are assumed to be restricted to a 74,500 mile network of Interstate and other principal arterial highways. Access off this network to terminals and facilities for food, fuel, rest, and repairs is assumed to be restricted to a maximum of 2 miles. These restrictions recognize that the length and stability and control properties of triples may not make them suitable for travel on roads with narrow lanes or restrictive geometry.
Summary of Modal Shift Methodology
Figure ES-1 on the following page summarizes data and methods used in the modal shift analysis. The analysis begins with an estimation of current (base case) truck traffic by vehicle configuration (number of trailers, number and types of axles, etc.), operating weight, and highway functional class. Data sources for base case traffic estimates include the volumes of truck traffic by highway functional class from the Federal Highway Administration’s (FHWA) Highway Performance Monitoring System (HPMS), the distribution of trucks by vehicle configuration from vehicle classification data collected by the States, and the distribution of vehicle operating weights from weigh-in-motion (WIM) data reported by the States. Data are primarily from 2011, the analysis year for the 2014 CTSW Study, although in some cases weigh-in-motion data were supplemented by data from 2010 and 2012 to provide a more robust distribution of operating weights on different highway functional classes. A summary of base case traffic is presented in the body of this technical report.
Following a review of available commodity flow databases, the FHWA's Freight Analysis Framework (FAF) was selected as the commodity flow database for this 2014 CTSW Study. As discussed in the body of this report, the FAF is an amalgamation of data from several different sources. One limitation of the FAF for the modal shift analysis is the fact that origins and destinations in the database are reported for only 123 regions generally representing the largest markets in the country. This level of detail was too coarse for purposes of the modal shift analysis since it would not allow a detailed assessment of the potential impacts of restricting the highway networks available for certain scenario vehicles. The Oak Ridge National Laboratory, FHWA’s developer of the FAF origin and destination matrix, disaggregated the FAF and provided commodity flows for origins and destinations at the county level.
Figure ES-1: Mode Shift Methodology
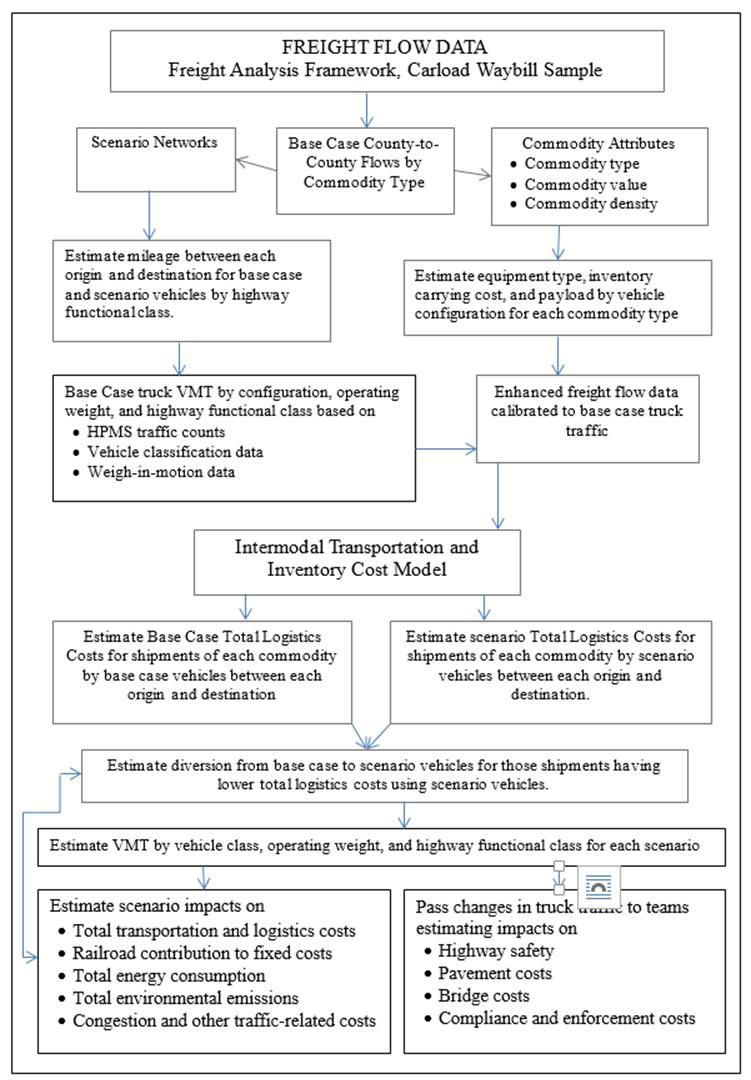
The analytical tool used for the modal shift analysis itself was the Intermodal Transportation and Inventory Cost Model (ITIC). This model was developed by USDOT during the course of and immediately following the USDOT’s Comprehensive Truck Size and Weight Study 2000 (2000 CTSW Study) and was used for subsequent studies by both FHWA and the Federal Railroad Administration (FRA). The ITIC model is described in detail in Appendix C.
In general the model estimates transportation and non-transportation logistics costs for shipments of different commodities by different vehicle configurations and transportation modes between various origins and destinations.
Specific costs considered in the ITIC model include vehicle operating costs, shipping rates that vary by market, and inventory carrying costs such as safety stock, cycle costs, and in-transit costs. If costs for moves by scenario vehicles at scenario size and weight limits are lower than costs for the same move in existing vehicle configurations at current size and weight limits, the move would be assumed to shift to the heavier scenario vehicle. Likewise if shipments by scenario vehicles cost less than shipments by rail, freight traffic would be assumed to shift from rail to truck.
In the ITIC model, railroads are assumed to respond to increased competition from more productive trucks by lowering their rates to the point where rates equal variable cost. If lowering the rates reduces total transportation and logistics costs for rail below rates for the scenario vehicles, freight traffic will remain on the railroads, but the contribution of those shipments to covering railroad fixed costs will be reduced.
Analytical Assumptions and Limitations
In conducting the modal shift analysis, data and methodological limitations required that a number of assumptions be made. Those assumptions include:
- Cargo weighing less than 75,000 pounds GVW will not divert to six-axle (3-S3) semitrailers.
- Traffic currently moving in five-axle semitrailers that cannot benefit from the added weight allowed on a six-axle tractor-semitrailer will not shift to the six-axle vehicle. Carriers would not shift their entire fleets over to six-axle vehicles simply to increase the flexibility of their fleets.
- All scenario vehicles except triples have the same access to cargo origins and destinations as base case vehicles. In the short run, bridge or other highway improvements would need to be made before scenario vehicles could use the same routes as base case vehicles, but in the long run it is assumed that such improvements would be made. The modal shift analysis is based on this long-run state.
- Triple configurations operate in LTL line haul (terminal to terminal) operations. In actuality there may be a few markets where heavy triples could be used for truckload shipments under the network and access restrictions placed on triples operations, but based on discussions with industry experts those are believed to be localized and would have very little impact nationally.
- Equipment currently being hauled in specialized configurations such as truck-trailer combinations will not shift to scenario vehicles. Specialized configurations are used because of unique commodity characteristics that would not be met by the scenario vehicles.
- Some 90 percent of short line carloads interline with Class 1 railroads and thus are reflected in the Surface Transportation Board’s Carload Waybill Sample.
- The analysis year for the 2014 CTSW Study is 2011. To the maximum extent possible, all data used for the study are from 2011 or have been adjusted to reflect 2011 values.
- The analysis assumes Federal and State highway user fees on the scenario vehicles are unchanged.
In addition to these assumptions, several other data limitations affect the analysis, including:
- The precise origins and destinations of shipments are unknown from the FAF. Origins and destinations are assumed to be county centroids [2] for inter-county shipments.
- The precise routes used to ship commodities between origin and destination are not known. Shortest path routes between each origin and destination pair are calculated for purposes of estimating transportation costs.
- Characteristics of specific commodities within broad commodity groups may vary significantly.
- Shipment sizes and annual usage rates for freight flows between individual origins and destinations cannot be discerned from the FAF and must be estimated from the Vehicle Inventory and Use Survey (VIUS) and other sources. This affects non-transportation logistics costs.
- Rail carload and truck/rail intermodal origins and destinations are unavailable from the Carload Waybill Sample and have been estimated using the same assumptions as were used in the 2000 CTSW Study.
- Multi-stop truck moves to accumulate and/or distribute freight from/to multiple establishments are not captured in the FAF.
These limitations are unavoidable in a nationwide study such as this. They were also confronted in USDOT’s 2000 CTSW Study and in other national studies. They are not believed to affect overall study conclusions, but they must be borne in mind when considering study implications.
Summary of Scenario Impacts on Modal Shifts
Table ES-3 summarizes impacts of each scenario on total truck vehicle miles traveled (VMT) required to haul freight included in the 2011 FAF, the cost of moving that freight, and the impact of shifts from rail to truck on railroad profitability. As would be expected, impacts on VMT generally vary with the allowable GVW assumed in each scenario. Percentage changes in VMT reflect changes in VMT from the base case to the scenario size and weight limits for those vehicle configurations affected by each scenario. They do not reflect percentage changes in total VMT or total truck VMT, both of which would be much smaller than the percentage changes in VMT for just those truck configurations affected by the scenario size and weight limits.
In terms of the tons of cargo that shifts from base case configurations to the scenario configurations, the vast majority shifts from truck rather than rail. Scenarios 1-3 affect more tonnage than Scenarios 4-6 because they primarily affect movements of bulk commodities whereas Scenarios 4-6 only affect LTL shipments.
Changes in total logistics costs and railroad contribution were much higher for Scenarios 1-3 than for Scenarios 4-6. Transportation costs are relatively higher for the bulk commodities most affected by Scenarios 1-3 and there are few if any savings in non-transport logistics costs associated with changes in the sizes of vehicles used to haul less-than-truckload freight. The greatest reduction in total logistics costs was associated with Scenario 3 where costs decreased by over $13 billion. The percentage change in total logistics costs (transportation and non-transport logistics costs) for Scenarios 1-3 is based on a comparison of total logistics costs associated with moving all freight traffic in the configurations affected by each scenario to total transportation and non-transport logistics costs associated with hauling the same traffic at the size and weight limits for each scenario. Changes in total logistics costs for Scenarios 4-6 are calculated differently because those scenarios are assumed to apply only to LTL traffic. Total logistics costs associated with moving all LTL traffic both by truck and by rail in the base case are compared with total logistics costs associated with moving the same freight traffic under the size and weight limits assumed for each scenario. For all scenarios, the percentage change in railroad contribution reflects changes in total net operating revenues compared to total net operating expenses for the railroads. The negative values indicate that net revenues fell more than net expenses.
Variations in truck size and weight limits under the study scenarios may also have an impact on short line railroads. Short lines provide regional/intrastate rail service, 90 percent of which connects to the larger Class 1 railroads. Data on short line operations in the Carload Waybill Sample are limited, but most commodities hauled by short lines are moved in carload quantities that would only be affected by the truck size and weight changes analyzed in Scenarios 1, 2, and 3. Using the same general methods as were used to analyze rail impacts for Class 1 railroads, short line railroads were estimated to lose from 1 to 4 percent of total revenue under each of Scenarios 1, 2, and 3. Revenue losses under Scenario 3 would be somewhat greater than losses under Scenarios 1 and 2. Losses for some individual short line railroads could be greater.
In Table ES-4, changes in fuel consumption and emissions reflect the reduced VMT shown in Table ES-3. Percentage changes in fuel consumption, CO2, and NOx are calculated the same way that changes in VMT were calculated – changes in base case fuel consumption and emissions for the vehicle configurations affected by each scenario compared to fuel consumption and emissions for those same vehicles under the assumed size and weight limits for each scenario. Congestion costs went down in all scenarios reflecting changes in the relative VMT for each scenario. Congestion cost savings ranged from $256 million in Scenario 1 to $875 million for Scenario 4. The percentage change in congestion cost is estimated by comparing congestion costs for all vehicles operating on the highway under base case size and weight limits to congestion costs for all vehicles assuming the scenario size and weight limits. Impacts on congestion are not limited just to the vehicles whose VMT is affected by each scenario, but accrue to all vehicles in the traffic stream.
1 The Federal government began regulating truck size and weight in 1956 when the National Interstate and Defense Highways Act (Public Law 84-627), establishing the Interstate Highway System, was enacted. A state wishing to allow trucks with sizes and weights greater than the Federal limits was permitted to establish “grandfather” rights by submitting requests for exemption to the FHWA. During the 1960s and 1970s, most grandfather issues related to interpreting State laws in effect in 1956 were addressed, and so most grandfather rights have been in place for many decades. See USDOT Comprehensive Truck Size and Weight Study, Volume 2, "Chapter 2: Truck Size and Weight Limits – Evolution and Context," FHWA-PL-00-029 (Washington, DC: FHWA, 2000), p. II-9. Return to Footnote 1
2 A county centroid is the latitudinal and longitudinal (i.e., geographic) center of a county. See http://opengeocode.org/tutorials/USCensus.php for more information. Return to Footnote 2