Comprehensive Truck Size and Weight Limits Study - Modal Shift Comparative Analysis Technical Report
Appendix A: Modal Shift Desk Scan
CHAPTER 1 - Introduction
1.1 Purpose
This report presents a revised version of the Desk Scan (Subtask V.E.2) developed to support the Modal Shift Comparative Analysis (Task V.E.) of the 2014 Comprehensive Truck Size and Weight Limits Study (2014 CTSW Study). This revised Desk Scan addresses the recommendations made by the National Academy of Science (NAS) Peer Review Panel concerning the originally submitted version of this scan.
The purpose of the revised Desk Scan is to:
- Reorganize and enhance the original Desk Scan; and
- Add any additional, relevant content that may have been identified since the submission of the original Desk Scan.
Specifically the desk scan has addresses the following four topics:
- Survey of analysis methods and a synthesis of the state of the art in modeling impacts
- Identification of data needs and a critique of available data sources
- Assessment of the current state of understanding of the impacts and needs for future research, data collection and evaluation
- Synthesis of quantitative results of past studies including reasonable ranges of values for impact estimates.
This desk scan includes a review of key literature related to estimates of modal shifts and related impacts associated with changes in truck size and weight limits as well as more general literature on mode choice. This desk scan is organized into three primary sections: 1) modal shift diversion studies, 2) travel fuel consumption studies, and 3) heavy truck impact on highway traffic operations. The literature review will address the NAS four issues for each of the three areas.
The purpose of this task is to estimate the extent to which changes in Federal truck size and weight limits might cause shifts in how freight is shipped including shifts between modes (e.g., some traffic shifting from rail to truck) and shifts from one truck configuration to another (e.g., shifts from configurations that were legal under current truck size and weight limits to configurations that would become legal under new size and weight limits). These shifts could affect the volume of truck traffic that would be required to carry a given amount of freight and the weights of trucks traveling on different parts of the highway system. These changes in turn will affect safety, infrastructure preservation costs, productivity, energy consumption, environmental emissions and other factors. Detailed estimates of changes in the characteristics of freight transportation associated with changes in truck size and weight limits will be required to assess the various potential impacts of those changes.
This report provides a scan of the literature on data and methods used in previous studies of freight modal diversion, and assesses how the data and methods used in previous studies meet requirements for nationwide modal diversion estimates in the current 2014 CTSW Study.
This section sets the context and requirements for the study and provides an overview of freight trends for the last 12 years using data from the Bureau of Transportation Statistics (BTS). The next section discusses the data available for analysis of modal diversion and discusses findings from other studies obtained from the desk scan. This is followed by a discussion of the methods used in the various studies. The report concludes with recommendations for the data and models to be used to estimate modal shifts for the 2014 CTSW Study and the challenges in developing those data and methods.
1.2 Study Requirements Related to Modal Diversion
Several different vehicle configurations will be examined in the 2014 CTSW Study, each with unique operating characteristics that will influence the types of highways that could be suitable for their use. Characteristics that would affect the suitability of different vehicle configurations to operate on different parts of the highway network include the vehicle's ability to negotiate curves of various widths; the ability to maintain speeds on grades; the rearward amplification of turning maneuvers in multi-trailer combinations; and the vehicle's overall dimensions. Potential impacts of allowing these different vehicle configurations to operate on different highway networks throughout the U.S. will be assessed including the potential diversion of freight from vehicles that are legal under existing federal truck size and weight limits to trucks that would become legal under higher federal weight limits. The modal shift analysis will also estimate potential diversion from other modes of transportation to vehicle configurations that could be allowed under higher federal truck size and weight limits. Limitations on the highway networks suitable for different vehicle configurations will affect the extent to which each configuration might be an economical alternative for transporting different types of commodities between different origins and destinations.
A highly disaggregated set of commodity flows will be required to assess feasibility and costs of moving different types of cargo between different origins and destinations by various vehicle configurations on different parts of the highway network. The USDOT, Comprehensive Truck Size and Weight Study, 2000 (2000 CTSW Study), used county-to-county flows, which allowed a detailed analysis of the effects of limiting certain Longer Combination Vehicles (LCV) to the Interstate System. Larger aggregations of origin-destination data, at the BEA or FAF-region level for instance, would make this type of analysis much more difficult since Interstate System Highways likely would pass through most if not all of those larger regions. The 2000 CTSW Study found that limiting networks on which certain vehicle configurations were allowed to operate could significantly affect the costs and utilization rates of using different vehicle configurations, particularly between origins and destinations not directly served by highways available to all truck configurations. When LCVs were not allowed to travel off networks designated for their use, they had to be assembled and disassembled at staging areas to travel to destinations that were not immediately adjacent to the designated network, just as they currently have to do on certain eastern turnpikes. Depending on the shipment distance and commodity value, this requirement that LCVs be broken down to travel off the designated network made the difference between whether the LCV was used or whether the commodity was shipped by vehicles that did not have to be broken down to travel from origin to destination. Such impacts of having restricted networks available to certain vehicle configurations cannot be adequately assessed with highly aggregated commodity flow data.
1.3 Freight Trends
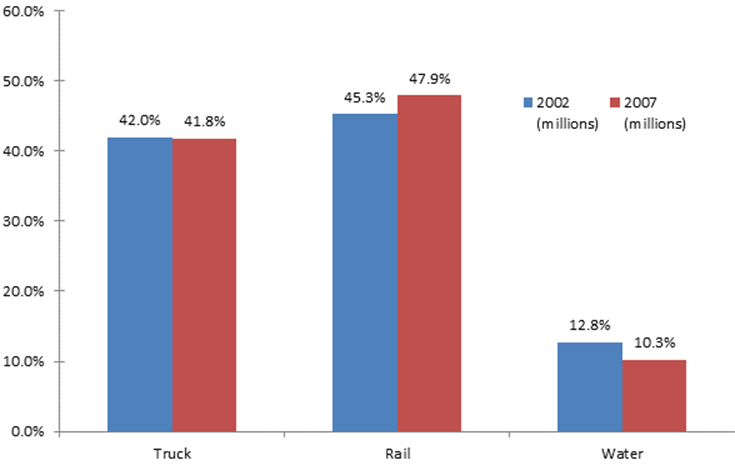
Between 2002 and 2007 the railroads' share of total freight ton-miles increased from 45 to 48 percent while trucking's share of ton-miles remained at about 42 percent over this period. The share of freight ton-miles shipped on navigable waterways (including shallow and deep draft and Great Lakes) fell from 13 to 10 percent (Figure 1). Trucking's share of vehicle-miles of freight transportation increased from 86 to 89 percent over this period while rail car-miles decreased from 14 to 11 percent.
Rail is efficient at moving heavy freight over long distances, as are water and pipeline freight services. Railroads also are important for intermodal moves of long-haul containerized freight, and in certain markets, short-line railroads successfully compete with trucks to haul large volumes of dense commodities relatively short distances. Trucks excel in providing time-sensitive delivery services for high-value goods being transported over medium and short-haul distances. Raw materials and heavy freight going long distances are likely to continue their journey by rail, or some combination of truck, rail, and water. With the future growth in freight, it is anticipated that freight rail will continue to make investments in the capacity required to move heavy and long-distance shipments. Railroads also are making investments to allow them to compete more vigorously with trucks for medium-distance freight traffic. It is in this area where potential impacts of changes in truck size and weight limits could have the greatest impact on the railroads. The US Department of Transportation's (USDOT) Federal Railroad Administration (FRA). Table 1 shows the modal comparative advantage by market (USDOT FRA 2010, p. 17).
Figure 1. Shipment Characteristics by Total Modal Activity (Ton-Miles) for the United States: 2007 and 2002 (2007 Commodity Flow Survey)
The Federal Railroad Administration, in its 2010 National Rail Plan (FRA 2009), identifies a future need for more freight capacity. Particularly in the next 25 years it estimates there will be 2.8 billion more tons of freight and in the next 40 years - 4 billion more tons of freight. Two goals identified in the National Rail Plan are to support the current freight rail market share and growth and to develop strategies to attract 50 percent of all shipments 500 miles or greater to intermodal rail. As is identified in the study, some diversion to rail is a national goal.
The National Rail Plan notes that the U.S. leads the world in terms of freight rail tonnage. Passengers and freight often travel along the same rail corridors making both reliability and safety a challenge. Two goals for freight rail identified in the report are as follows:
- Support the current freight rail market share and growth.
- Develop strategies to attract 50 percent of all shipments 500 miles or greater to intermodal rail.
The Plan notes that improving freight rail's intermodal market share and connections to ports will improve international trade opportunities and supports the President's National Export Initiative. In relation to rail intermodal, the report mentions that replacing 300 trucks with one long-distance, double stack train between Chicago and Los Angeles has the potential to save 75,000 gallons of fuel. Benefits of freight rail as compared to truck include enhanced safety, fuel efficiency, congestion mitigation, reduction of logistics cost, and reduction of greenhouse gases. These various impact areas are all considered in the 2014 CTSW Study, although in the context of changes in truck size and weight policy rather than in the context of investment strategies designed to support goals enunciated in the National Rail Plan. As shown in Table 1, rail currently carries about 47 percent of all ton-miles of freight moved by surface modes.
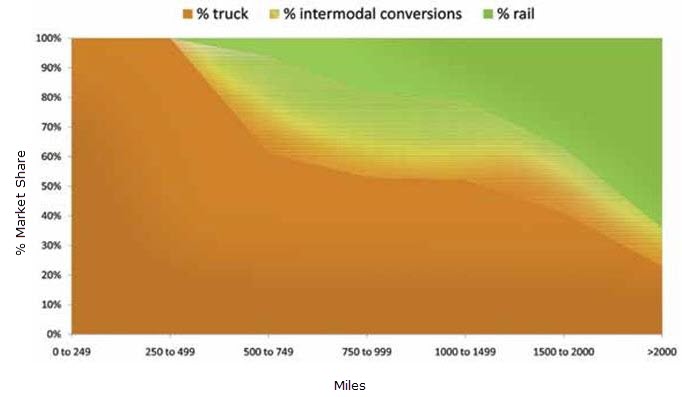
Figure 2 shows the additional market share needed for rail to move 50 percent of the 500-mile or greater market by 2035, one of the goals identified in the National Rail Plan.
Figure 2. Modal Shift Projection (USDOT Federal Rail Administration,
National Rail Plan Progress Report 2010, p. 20
CHAPTER 2 - Summary of Key Modal Shift Studies and Related Databases
Studies related to Federal truck size and weight policy date back 75 years. Major national studies include:
- U. S. Department of Transportation Studies
- The Western Uniformity Scenario Analysis 2004
- The Comprehensive Truck Size and Weight Study 2000 (2000 CTSW Study)
- Longer Combination Vehicle Operations in Western States 1986
- The Feasibility of a Nationwide Network of LCVs 1985
- Maximum Desirable Dimensions and Weights of Vehicles Operated on the Federal-Aid System 1964
- Federal Regulation of the Sizes and Weight of Motor Vehicles 1941
- Transportation Research Board Studies
- Special Report 267: Regulation of Weights, Lengths, and Widths of Commercial Motor Vehicles 2002
- Special Report 227: New Trucks for Greater Productivity and Less Road Wear,
An Evaluation of the Turner Proposal 1990 - Special Report 225: Truck Weight Limits: Issues and Options 1990
- The Government Accountability Office Studies
- Longer Combination Trucks: Potential Infrastructure Impacts, Productivity Benefits, and Safety Concerns 1994
- Longer Combination Trucks: Driver Controls and Equipment Inspection Should be Improved
- Truck Safety: The Safety of Longer Combination Vehicles is Unknown
The most recent studies that include estimates of potential modal shifts associated with truck size and weight policy changes are summarized in this desk scan.
A summary of recent truck size and weight research was published in 2011 under National Cooperative Highway Research Program (NCHRP) 20-07, Task 303 (Carson 2011). The scope of that study is very broad with modal shift being only one of many subject areas covered. This NCHRP study includes individual State studies as well as nationwide studies, but there is little discussion of analytical methods or data used to analyze potential modal shifts associated with various truck size and weight policy options. Detailed findings from the various nationwide studies are presented along with a number of general findings as follows:
- The proportion of freight transported between rail and truck is determined by complex economic relationships intended to maximize profit for each respective mode. Rail industry revenues are directly related to transport rates established by the trucking industry-and vice versa-for all commodities that can be practicably carried by either mode.
- Increases in maximum allowable truck sizes and weights will predictably lead to lower truck transport costs; industry competition and regulatory pressure will translate these lower costs into lower transport rates. The rail industry has to either match the lower rates or lose traffic to the competing mode-in either instance, rail revenues will decline.
- The magnitude of revenue loss depends on the extent of trucking industry cost/rate reductions brought about by the increase in capacity, and by the proportion of existing rail traffic that will shift to truck if the relative transport rates of the two modes change.
- Estimates of rail to truck traffic diversion and subsequent losses in rail revenue are highly variable suggesting sensitivity to: (1) regional commodity movement/transportation infrastructure conditions, (2) the extent of truck payload capacity increases, and (3) evaluation assumptions.
- Shippers choosing between truck and rail often consider a trade-off between price and service. In terms of price-per-ton-mile, rail service is almost always less expensive than truck service. In terms of service quality, truck service offers door-to-door delivery and typically faster deliveries.
- For low-value commodities-such as coal, grain, or chemicals-the price of shipping is often a priority over the convenience of door-to-door service, providing rail a formidable advantage over highway movement.
- Intermodal operations that rely upon combined truck and rail transport for different segments of the trip experience the highest level of competition between truck and rail modes. Carload operations that utilize boxcars also experience a high level of competition between these modes.
Other freight modal diversion studies have been conducted that are not cited in the NCHRP summary. Major studies uncovered in the desk scan are included in this report.
In the context of truck size and weight studies, modal diversion includes not just diversion of freight traffic from rail to truck as the result of changes in truck size and weight limits, but also shifts of traffic from truck configurations that are legal under existing truck size and weight limits to configurations that would become legal if size and weight limits were increased. Freight traffic is generally characterized as either "weigh out" or "cube out." Weigh out traffic reaches the gross vehicle weight (GVW) limit at or before the cubic capacity of the cargo-carrying unit is filled. Weigh out traffic can benefit from increasing the maximum GVW of trucks. Some benefit would be realized by increasing the GVW limit of trucks that are the same length as existing configurations, but even greater more cargo could be hauled in each trip if both the cubic capacity and GVW of the vehicle were increased. Cube out traffic on the other hand fills the cargo-carrying unit before reaching the gross vehicle weight limit. Additional cubic capacity is required to carry more cube-out traffic, and this usually requires adding one or more trailers to the vehicle.
Mode choice involves consideration of more than just the relative cost of transporting cargo by various modes and vehicle configurations. Total logistics costs associated with each transport alternative must also be considered. The principal logistics costs related to alternative transportation modes are transit time, warehousing and inventory costs, and safety stock requirements. In general the higher the value of the good the more important are non-transportation logistics costs to the choice of mode. While differences between non-transportation logistics costs typically are greater between truck and rail, there are differences between truck configurations as well that must be considered in mode choice analyses.
2.1 Summary of Previous Modal Shift Studies
2.1.1 National Diversion Studies
2.1.1.1 Comprehensive Truck Size and Weight Study, 2000
The USDOT's Comprehensive Truck Size and Weight Study, 2000 (2000 CTSW Study) (USDOT 2000b) used a total logistics cost model and highly disaggregated commodity flow data to estimate mode choice decisions for shipments of different commodities to different origins and destinations. County-to-county flows of different types of commodities were evaluated to determine the lowest total logistics cost for each mode, taking into consideration among other things route restrictions that were assumed to be placed on various longer combination vehicle (LCV) configurations. County-level origins and destinations were necessary to reflect differences in the highway networks assumed to be available to different LCVs.
The 2000 CTSW Study estimated both diversions from one truck configuration to another and rail-to-truck diversion. The logistics cost model used in the 2000 CTSW Study was called the Intermodal Transportation and Inventory Cost(ITIC) Model and was based on the Association of American Railroads' (AAR) Intermodal Competition Model that had been used in the Transportation Research Board's Special Report 225, Truck Weight Limits Study (TRB 1990). The development and analytical framework of the ITIC model are described in greater detail in Appendix E.
No public commodity flow data by truck were available for the 2000 CTSW Study so the study relied on the North American Transportation Survey (NATS) conducted by AAR at truck stops to capture long haul truck moves, the Census Department's Truck Inventory and Use Survey (TIUS) and FHWA's Highway Performance Management System (HPMS). Rail flows came from the rail waybill database and rail rate data came from proprietary Surface Transportation Board (STB) data. This proprietary rate data was essential to the study since no other source of actual rail rates for different types of shipments in different corridors was available to compare to costs of moving the same commodities between the same origins and destinations by various truck configurations. Truck rate data was purchased from a private vendor because the data reflected differential rates in various markets.
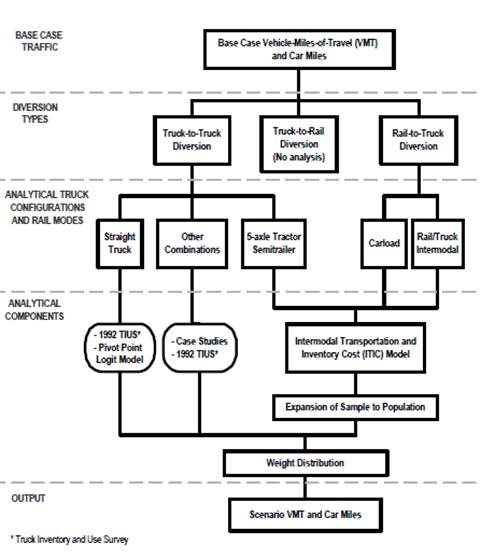
Figure 3 shows the analysis of the scenario vehicle miles of travel (VMT) and car miles. Diversion of freight from one truck configuration to another accounted for a substantial share of the total change in truck VMT associated with Truck Size and Weight (TS&W) policy options.
Figure 3. Analysis of Scenario VMT and Car Miles (USDOT FHWA 2000, vol. 3, p. IV-2)
The analysis of truck-to-truck diversion was divided into short-haul shipments and longer-haul, primarily because suitable data on short-haul shipments were not available. Several policy scenarios were analyzed to isolate potential impacts of different vehicle configurations that might be allowed under different TS&W policy options. Both rail intermodal-containers or trailers going by rail for part of their journey-and rail carload moves were analyzed. Impacts of changes in TS&W limits examined in the study included safety, pavement and bridge deterioration, traffic operations, productivity, energy consumption, and environmental impacts.
2.1.1.1.1 Networks for Scenario Analysis
The 2000 CTSW Study assumed the following networks for the purposes of scenario analysis.
National Network for Large Trucks: The Surface Transportation Assistance Act (STAA) of 1982 required States to allow 48-foot semitrailers and 28-foot double trailer combinations (often referred to as "STAA doubles") on specified highways. The National Network includes virtually all Interstate Highways as well as other highways. States are required to allow reasonable access for the STAA vehicles to and from the National Network.
National Highway System: With the National Highway System (NHS) Designation Act of 1995, Congress established the NHS. This system consists of the highways of greatest National interest, and includes the Interstate System, a large portion of the other principal arterial highways, and a small portion of mileage on other functional systems. MAP-21 expanded the National Highway System to include all highways classified as principal arterials.
Analytical Networks for Longer Combination Vehicles: Two illustrative networks were specified to analyze expanded LCV operations under the various scenarios. The USDOT emphasized that these networks, like the scenarios themselves, were purely for illustrative purposes and did not reflect the USDOT's position on where various vehicle classes should be allowed to operate. The network developed to test the operation of long double trailer combinations -- Rocky Mountain Doubles (RMDs) and Turnpike Doubles (TPDs) -- consisted of access-controlled, interconnecting segments of the Interstate System and other highways of comparable design and traffic capacity. The routes connected major markets and distribution centers. The network designed to evaluate the impact of allowing triple-trailer combinations to operate nationwide includes 65,000 miles of rural Interstate and other highways. Some urban Interstate highway segments were included for connectivity. This network included many low traffic highways in the U.S.-West and some four lane highways in the U.S.-East. The network designed for the operation of triple-trailer combinations is larger than the network used to analyze long double combination operations because triple trailer combination vehicles have better offtracking performance than long twin trailer combinations.
2.1.1.1.2 Scenario Analysis
Of the policy scenarios examined in the 2000 CTSW Study, three involved increased TS&W limits. These scenarios are described below.
The North American Trade Scenario This scenario would allow heavier tridem axles, up to either 44,000 or 51,000 pounds, to facilitate trade between the U.S. and its NAFTA partners. Such changes would allow the eight-axle B-train combinations used in Canada to operate on U.S. highways. It would also increase the use on U.S. highways of six-axle tractor-semitrailer combinations, which are currently much more common in Canada and particularly Mexico. The network would comprise 42,000 miles for Rocky Mountain Doubles and Turnpike Doubles, 60,000 miles for triples, and the existing National Network for eight-axle B-train doubles. The study noted that only 21 states allow LCVs, and that some eastern states only allow those vehicles on their turnpikes.
Longer Combination Vehicles Nationwide Scenario This scenario assumed that a national network over which these vehicles could operate. The network would comprise 42,000 miles for Rocky Mountain Doubles (RMD) and Turnpike Doubles (TPD), 60,000 miles for triples, and the existing National Network for eight-axle B-train doubles. Due to their poor offtracking, the scenario did not allow long double-trailer combinations (TPDs and RMDs) off the designated network. It is assumed that drivers of these vehicles would use staging areas-large parking lots-to disconnect the extra trailer and attach that trailer to another tractor for delivery to its final destination. Drayage is assumed to be along the most direct route off the network between the shipper or receiver and the network. The staging area costs are not included in the truck operating costs because it is unclear whether charges would be levied for use of the staging areas.
Triples Nationwide Scenario The Triples Nationwide Scenario would establish a national 65,000-mile network for seven-axle triple combinations weighing up to 132,000 pounds. Little diversion from rail intermodal was expected, however, because this scenario assumed that each triple-trailer combination can only handle containers up to 28 feet in length and the majority of rail intermodal traffic is transported in containers or trailers 40 feet or longer.
2.1.1.2 Western Uniformity Scenario Analysis
As the USDOT's 2000 CTSW Study was nearing completion, the Western Governors' Association (WGA) asked the USDOT to analyze another illustrative truck size and weight scenario in addition to the scenarios already included in the study. The "Western Uniformity Scenario" requested by WGA would assess impacts of lifting the LCV freeze and allowing harmonized LCV weights, dimensions, and routes among only those western states that currently allow LCVs (USDOT 2004). Specifically the WGA requested that USDOT analyze impacts of expanded LCV operations assuming that weights would be limited only by federal axle load limits and the federal bridge formula, with a maximum gross vehicle weight of 129,000 pounds.
LCVs have operated in western states for many years. Grandfather rights in effect since 1956 have allowed those vehicles to exceed the 80,000-pound federal weight limit on Interstate Highways. Until 1991 States could determine the weights and dimensions allowed under their grandfather rights, but the LCV freeze instituted in the Intermodal Surface Transportation Efficiency Act of 1991 (ISTEA) prohibits States from increasing allowable LCV weights on the Interstate System or allowing longer LCVs on the National Network established in the Surface Transportation Assistance Act of 1982. Because grandfather rights in each of the western states differ, allowable weights and dimensions for LCVs in most western states vary.
Both the logistics cost model and the commodity flow data used for the 2000 CTSW Study were significantly improved for the Western Uniformity Scenario Analysis. The ITIC model, was made easier to use and logistics costs were updated and refined. The major improvement, however, in the Western Uniformity Scenario Analysis was in the commodity flow database. The Federal Highway Administration (FHWA) developed its Freight Analysis Framework (FAF) in 2002 and that database was used for the Western Uniformity Scenario Study. The FAF, which is discussed in more detail later in this desk scan, was based on the Census Bureau's Commodity Flow Survey (CFS) with additional data sources to fill in commodity flows that were not collected in the CFS. For the Western LCV Uniformity Scenario, a version of FAF having county-to-county flows was developed that allowed detailed assessments of the potential shift to LCVs based on the networks that would be available to those vehicles and the extent to which those networks served various origins and destinations at the county level. Without county level origins and destinations it would have been impossible to directly reflect network limitations for some LCVs when estimating potential diversion of traffic to those configurations since virtually all FAF regions are served by all highway systems. The limited networks assumed to be available to various types of LCVs, and the requirement that they assemble and disassemble for travel off those networks, significantly affected estimates of overall diversion and the configurations to which shipments were diverted.
2.1.1.3 TRB Special Report 225, Truck Weight Limits
The Transportation Research Board's 1990 Special Report 225, Truck Weight Limits was one of the most comprehensive analyses of truck size and weight policy options that had been done up to its publication date. The study analyzed impacts of 10 specific truck size and weight policy options including several that are similar to scenarios being analyzed in the current 2014 CTSW Study.
Base case forecasts of VMT and payload ton-miles for a future year (1995) were developed for 10 vehicle types, seven regions of the country, nine gross vehicle weight ranges, and four highway systems (rural and urban Interstate, other rural and other urban).
Interviews with 32 firms representing all segments of the trucking industry were a key input to developing forecasts of scenario VMT. No mathematical model was used to estimate shifts from one truck configuration to another, but the authors note that many perspectives were provided in the interviews that would be difficult to capture in a mathematical model. On the other hand findings depend to a great degree on the firms interviewed for the study and there is uncertainty about whether actual responses to truck size and weight changes would correspond to anticipated responses noted in the interviews.
It was assumed that State length limits and access policies for multi-trailer combinations would remain unchanged. Thus in regions where length limits would not allow longer combination vehicles, such vehicles would not be allowed in that region even under a scenario in which that vehicle otherwise would be allowed. Likewise in regions with restrictive access limits, multi-trailer vehicles might be restricted to the Interstate System whereas in the western states where LCVs have much broader access, scenario vehicles would retain that same degree of access.
Transportation costs were calculated for each vehicle, but those costs were not used to estimate modal shifts. Rather they were used in combination with estimated changes in miles traveled by each configuration to estimate changes in total transportation costs associated with each scenario. Costs considered in the study were driver costs, vehicle costs, fuel costs, tires, maintenance, and overhead costs. Cost estimates were developed from The Truck Blue Book, interviews with operators and dealers, and a review of estimates from previous studies. Costs were expressed in terms of cost per mile, cost per loaded mile, and cost per ton-mile. No non-transportation logistics costs were considered in the analysis. The Association of American Railroads'(AAR) Intermodal Competition Model was used to forecast potential truck/rail diversion. The Intermodal Competition Model represented the state of the practice at the time, but since this study was completed other models including the ITIC model have been developed. The ITIC model drew heavily from the Intermodal Competition Model.
Carl Martland of MIT conducted a study for the Coalition Against Bigger Trucks in 2007 to estimate potential competitive impacts of larger trucks on rail freight traffic (Martland 2007). The study creates a base case of 100 synthetic O-D movements intended to represent the traffic that is handled or could be handled by the railroad industry and handled at either the origin or destination by a short-line railroad. For each O-D movement, the study identifies the cost, capacity, and service characteristics offered by each transportation mode, and estimates the total logistics costs that would result from using each available mode for each O-D. The method then allocates the traffic to each mode based upon a comparison of the total logistics costs using a statistical logit model. If the costs are equal, all modes share the traffic equally; if one mode dominates, then that mode captures all the traffic. The resulting traffic is summed over all O-D pairs to get the mode share for the base case. For scenario evaluation new cases are structured based on changes to the performance characteristics of one or more modes, unit costs, and operating parameters and the results are subsequently compared to the base case for changes in market share by mode, changes in traffic volumes, and performance.
This approach cannot provide exact estimates of market changes, since actual conditions will often be more complex than what is covered by this methodology. However, this methodology does include the major factors known to influence mode choice, and it is broad enough to provide insight into the probable effects of new technologies or other changes in the competitive transportation environment. Technological or operating changes that result in significantly higher or lower logistics costs for one mode can be expected to cause significant changes in mode choice; technologies that afford only minor changes in total logistics costs will be unlikely to cause significant changes in mode choice. However, one drawback of the method is the allocation of all traffic to the dominant mode. The logit model determines the probability of choosing each mode, so allocating all traffic to the mode with highest probability likely over-allocates to that mode and under-allocates to other modes.
The data relies on values of trip distances, values/pound, density, and annual use rates from studies sponsored by the International Railroad Congress, and the American Short Line and Regional Railroad Association for short line rail traffic.
The study was conducted in coordination with the Association of American Railroads (AAR). The study uses a methodology developed at MIT and applied previously in various studies, including a similar study of the competitive effects of larger trucks on short line railroads. The methodology was applied in two analyses, each of which examines rail mode share for a set of generic origins and destinations under various assumptions concerning truck size and weight limits.
Martland conducted another study of Class 1 railroads using the same general methodology used in his 2007 study of short-line rail impacts. The study assesses the competitive impact of increases in truck size and weight limits on freight traffic handled by the Class I railroads. The study focuses on bulk traffic and general merchandise traffic, but does not analyze high-volume double-stack domestic freight or the movement of marine containers to and from ports. The study presents two analyses that address the effects of increases in truck size and weight on the rail market share for traffic handled by the rail industry. The first concerns the rail market share for the entire range of general merchandise and bulk freight, while the second focuses on the relative costs of moving bulk traffic short distances by rail and by truck.
Rather than analyzing data for actual shipments by truck and rail, the study analyzed hypothetical movements structured to represent a typical mix of commodity and customer characteristics. For each O-D movement, the estimated mode share was based upon a comparison of the total logistics costs for using rail, intermodal, and truck transportation. In addition to direct transportation costs, the total logistics costs included inventory costs, loading and unloading costs, and loss and damage.
The key steps in Martland's methodology are:
- Prepare a base case:
- Create a set of origin-to-destination (O-D) movements to represent the traffic that is handled or could be handled by a railroad or group of railroads. Since each O-D will represent many actual O-Ds, it is necessary to structure the set of O-Ds to provide a realistic mix of customers (i.e. a realistic mix of commodities, trip distances, and annual use rates).
- Identify the cost, capacity, and service characteristics offered by each transportation mode serving each O-D.
- Estimate the total logistics costs that would result from using each available mode for each O-D.
- Allocate the traffic to each mode based upon a comparison of the total logistics costs. If the costs are equal, all modes share the traffic equally; if one mode dominates, then that mode captures all of the traffic.
- Sum over all O-D pairs to get the mode split for the base case.
- Structure new cases to reflect a different operating environment:
- Change performance characteristics for one or more modes.
- Change unit costs
- Change operating parameters
- Compare results of the new cases to the base case:
- Document changes in market share by mode
- Document changes in traffic volumes (tons, ton-miles or shipments by mode)
- Document changes in performance (cost, service, capacity)
Martland notes, "This approach cannot provide exact estimates of market changes, since actual conditions will often be more complex than what is covered by this methodology. However, this methodology does include the major factors known to influence mode choice, and it is broad enough to provide insight into the probable effects of new technologies or other changes in the competitive transportation environment. Technological or operating changes that result in significantly higher or lower logistics costs for one mode can be expected to cause significant changes in mode choice; technologies that only enable minor changes in total logistics costs will be unlikely to cause significant changes in mode choice."
Principal sources of data for the analysis came from the Surface Transportation Board's (STB) Carload Waybill Sample and earlier studies in which logistics costs associated with different types of operations had been estimated.
Babcock has examined the impacts of railroad abandonment on communities (Babcock 2003, 2007). His research measured quantifiable impacts of short-line railroad abandonment in Kansas through four research tasks. First, an assessment of Kansas county road conditions and financing was conducted to determine the ability of counties to absorb the resulting incremental heavy truck traffic. Second, the changes in wheat handling and transportation costs were computed. Third, the increase in truck-attributable road damage costs to Kansas county and state roads was computed. Fourth, the additional highway accident benefits and costs attributable to the resulting incremental truck traffic were calculated. He concluded that "losses of shortline railroads would have negative effects on rural Kansas communities, including increased road damage costs and reduction in farm income." Furthermore, energy consumption and emissions required to move freight would increase if shortline railroads were abandoned.
Middendorf and Bronzini (1994) of the Oak Ridge National Laboratory conducted a study for FHWA to determine the net effect of truck size and weight policy changes on shipper total logistics cost and how these effects might influence the demand for alternative tractor-trailer configurations. "Data on product characteristics, lane volumes, transportation cost, and other logistics costs gathered in the shipper survey were entered into a computer program called the Freight Transportation Analyzer (FTA). The FTA is a deterministic economic order quantity model adapted to incorporate transportation costs. For each lane observation in the survey dataset, the FTA calculated the shipper's annual freight, order, and inventory carrying costs for the shipper's current mode of transport as well as for two types of LCVs: the Rocky Mountain double and the turnpike double.
Original data of a highly confidential nature was required for this study. Many firms were willing to provide freight flow data, but were either unwilling or unable to specify critical logistics costs such as order processing cost and inventory carrying cost, even when assured of confidentiality. Some firms lacked the sophisticated logistics management systems necessary to respond fully to the detailed questions that were asked. As a result, the research was based on a limited sample of 297 product-specific traffic lane (origin-destination) movements obtained from a total of 72 companies.
The study concludes that, "An excellent indicator of whether or not a truckload shipper would benefit from switching to LCVs is the ratio of the shipper's current annual single trailer freight costs to annual inventory carrying costs. The research indicates that, when single trailer freight costs are two or more times greater than the inventory carrying costs, switching from single trailers to LCVs will in all likelihood greatly reduce the shipper's annual total logistics cost. On the other hand, when inventory carrying costs are roughly the same as or greater than the single trailer freight costs, the chances are good that switching from single trailers to LCVs will increase the shipper's annual total logistics cost."
Middendorf and Bronzini conclude that, "No single variable or combination of variables among the ones considered in this study appears to be highly effective at predicting how much or to what degree an individual shipper's annual total logistics cost would change as a result of switching to some type of LCV. The influence of product value, in particular, is much smaller than is commonly expected. Product value is significant only when annual traffic lane volumes fall below 15,000 cwt (680,385 kg) or 350,000 ton-mi (510,650 metric ton-km). Only at low annual shipment volumes do higher product values significantly increase the chances that LCV use will increase the shipper's total logistics cost. Other factors such as annual lane volume and lane distance are good indicators of whether or not a shipper would benefit from using LCVs, but they are not highly significant estimators of the amount that would be saved or lost. Further research with more detailed shipper data will be needed to produce better logistics cost models for alternative truck sizes and weights."
A major finding of the study is that, in most cases, use of LCVs would significantly reduce total logistics cost of truckload shippers and potentially cause shifts from conventional tractor-semitrailers to LCVs. More research with better data and more robust logistics cost models is needed to determine how much diversion would actually occur and what the cumulative nationwide impact on shippers' total logistics cost would be. Because of the small number of rail boxcar and intermodal observations in the shipper survey data, it was not possible to estimate the amount of diversion that might occur from rail to LCVs. The research indicates, however, that turnpike doubles operating under higher than existing GVW limits could reduce shippers' annual total logistics cost enough to induce some shippers to switch from rail boxcars and intermodal to LCVs. Additional research is needed to determine how much rail boxcar and truck-rail intermodal freight might be diverted.
A study is underway under the National Cooperative Freight Research Program to "develop a handbook for public practitioners that describe the factors shippers and carriers consider when choosing freight modes and provides an analytical methodology for public practitioners to quantify the probability and outcomes of policy-induced modal shifts."(TRB 2015) While the primary emphasis of this project is on policies to shift truck traffic to rail to reduce environmental emissions and congestion, findings should also be of use in analyzing impacts of truck size and weight policy options. No reports on this project are available at this time.
2.1.2 Recent State Modal Diversion Studies
2.1.2.1 Minnesota Truck Size and Weight Study
The Minnesota Department of Transportation conducted an extensive analysis of TS&W alternatives in cooperation with an advisory committee representing a variety of industries, all levels of government, and other interested organizations (Cambridge Systematics 2006). Alternative truck configurations considered in the study included 6 and 7-axle tractor-semitrailers at various weights and an 8-axle B-train double similar to vehicles commonly used in Canada.
"To guide estimates of the amount of freight that might shift to heavier trucks under each Scenario, tables were created to show the current distribution of truck traffic by truck type, operating weight, and highway system (Interstates, other trunk highways, and local)...With these distributions, estimates were made regarding the amount of Base Case freight (measured in payload ton-miles) moving in trucks that are at or close to Base Case weight limits. This weight-limited freight is a good candidate for shifting to heavier trucks if weight limits are increased."
"The principal shipper and carrier responses considered were changes in operating weights and the types of trucks used, in order to reduce the amount of truck VMT (and hence cost) to carry a given amount of freight. The following possibilities also were considered: 1) changes in limits might cause shifts from rail to truck, 2) changes in the total amount of freight shipped, 3) shifts in highway systems used by trucks and 4) shifts in the time of year for shipments (due to seasonal differences in limits). Sensitivity analysis was performed to investigate how different assumptions about the size of shifts might affect the overall evaluation of a scenario."
The impact areas covered in the study are:
- Truck traffic effects (including modal or system diversion);
- Transport costs;
- Pavement costs;
- Bridge posting and replacement;
- Bridge fatigue;
- Bridge decks;
- Bridge design;
- Crash costs; and
- Congestion costs.
"With these distributions, estimates were made regarding the amount of Base Case freight (measured in payload ton-miles) moving in trucks that are at or close to Base Case weight limits. This weight-limited freight is a good candidate for shifting to heavier trucks if weight limits are increased." The primary basis for estimating shifts among vehicle configurations was expert opinion based on characteristics of freight traffic in the State and viewpoints of shippers and carriers. No quantitative modeling was used to estimate potential shifts among vehicle configurations or between modes.
2.1.2.2 Wisconsin Truck Size and Weight Study
Cambridge Systematics conducted a study for the Wisconsin Department of Transportation, the purpose of which was "to assess potential changes in Wisconsin's TS&W laws that would benefit the Wisconsin economy while protecting roadway and bridge infrastructure and maintaining safety...The broad challenge of this evaluation is the ability of the TS&W changes to balance economic gains resulting from increased truck productivity with the potential costs to safety and infrastructure." (Cambridge Systematics 2009)
The methodology draws heavily upon past studies of truck size and weight limit changes by the Minnesota DOT, the USDOT, and the Transportation Research Board. Estimates of diversion from Base Case to Scenario configurations were developed for two cases:
- Non-Interstates Only. Scenario configurations are not allowed on Interstate highways; and
- All Highways. Scenario configurations are allowed on Interstate highways (this case would require a change in Federal truck size and weight regulations)."
New truck configurations examined in the study included 6-axle 90,000 pound tractor-semitrailer; 7-axle 97,000 tractor-semitrailer; 7-axle 80,000 pound single unit; 8-axle 108,000 pound twin trailer; 6-axle 98,000 pound tractor-semitrailer; and 6-axle truck-trailer combination.
Impacts were estimated in the following areas:
- Truck usage
- Goods movement costs
- Pavement and bridge impacts
- Bridge reconstruction, rehabilitation and posting costs
- Safety
- Congestion, and
- Energy and the environment
As with the Minnesota Truck Size and Weight Study, shifts among vehicle configurations were estimated using expert opinion based on characteristics of freight traffic in the State and viewpoints of shippers and carriers. No quantitative modeling was used to estimate potential shifts among vehicle configurations or between modes.
2.1.2.3 Montana
Jerry Stephens and colleagues at Montana State University conducted a study in 1996 of the Impact of Adopting Canadian Interprovincial and Canamax Limits on Vehicle Size and Weight on the Montana State Highway System (Stephens, et al. 1996). As in the Minnesota and Wisconsin studies, it was assumed that only weight limited vehicles would consider shifting to new configurations and operating weights. Data on existing vehicle weights operating on Montana highways were used. Between 33 and 66 percent of total freight carried on vehicles within 10 % of their weight limits was assumed to divert to alternative configurations. The authors note that, "In reality, the availability of proper shipping/receiving facilities, cost of new equipment, maneuverability requirements, type of haul, etc. will influence decisions of this kind, and some weight limited operators will choose to continue to use their existing configurations."
Estimates of diversion of traffic from rail to truck was based on findings of the TRB 225 study which estimated that ton-miles on highway system would increase by 3 3/4 % under Canadian Interprovincial Limits. Diversion estimates did not consider limiting the networks available to longer combination vehicles.
2.1.2.4 Texas
Bienkowski and Walton at the Southwest Region University Transportation Center prepared a paper analyzing The Economic Efficiency of Allowing Longer Combination Vehicles in Texas (Bienkowski and Walton 2011). "An LCV scenario for Texas was chosen, with specific routes and vehicle types. Operational costs for these vehicles were calculated on a cost per mile and cost per ton (or cubic yard) mile. The LCV scenario and the current truck base case were analyzed to find the number of truck trips, the number of miles, and the cost per mile for the chosen routes. These are then compared to estimate the change if LCVs were allowed in Texas."
To decide which types of LCVs would be safe and appropriate for Texas, the research team contacted companies interested in using LCVs. The first vehicle chosen was a 97,000 pound tridem semitrailer, which is not an LCV. The next configuration coupled two standard 53-foot semitrailers and was assumed to travel at a maximum gross weight of 138,000 pounds. Finally, that same double combination was studied at a gross vehicle weight of 90,000 pounds to serve cube-out traffic.
Based on operator surveys and input from industry contacts, the researchers decided that the following LCV scenario would be realistic for this study:
- LCV approval would affect primarily standard 5-axle tractor-semitrailers;
- 15% of current truck cargo currently hauled by 5-axle tractor-semitrailers would remain in this vehicle class;
- 35% would be transferred to the 97-kip tridem axle tractor-semitrailers;
- 20% would be transferred to the light doubles; and,
- The remaining 30% would become the 138-kip double 53s.
These shifts among configurations were based solely on expert opinion and not on a detailed analysis of the costs of using alternative configurations for hauling different commodities over different distances.
2.1.2.5 Virginia
Virginia has conducted several studies of freight movement along the I-81 corridor. A major focus of those studies is to estimate the potential for diverting truck traffic to rail in the corridor. A 2009 study evaluated several strategies for diverting traffic from truck to rail, one of which involved the use of cross-elasticities to estimate the change in traffic for one mode when prices for the other mode change (Commonwealth of Virginia 2009).
An important finding of that study that has implications for the current study is that "the literature on freight elasticities does not tell a clear story. One recent study (Littman 1999) cited compiled results from prior studies. The widest range cited suggests that price elasticities for trucking range from -0.04 to -2.97 and price elasticities for rail range from -0.08 to -2.68, depending on commodity. The narrowest range cited suggests that elasticities for both trucking and rail range from -0.25 to -0.35. The average value of -0.30 is suggested for the present analysis, mostly because it yields the most plausible results."
"For trucking, this means a 1 percent increase in price results in a 0.3 percent loss of traffic. Looking at the choice between truck and rail costs, it might be expected that for each 1 percent cost savings offered by rail, 0.3 percent of trucks might divert to rail when offered the choice."
The study notes, "The diversion estimates are very sensitive to price assumptions. Even relatively small changes in price can produce significant changes in the estimates. This analysis is based on average rates, but in practice, trucking and rail costs vary widely depending on the commodity, travel lane and distance, competitive market conditions, and other factors. Further analysis would be needed to accurately reflect these important differences..We have relied on a general estimate of price elasticity. The best diversion models are based on corridor and commodity-specific elasticities not only for price, but also for changes in speed, reliability, and other factors."
This conclusion has significant implications for the use of cross-elasticities based on econometric analysis for the current 2014 CTSW Study. Detailed cross-elasticities for different commodities moving in different markets are not available, nor are elasticities that reflect changes in non-transportation logistics costs.
Another study of potential diversion of truck traffic to rail along the I-81 corridor in Virginia used the ITIC model in combination with the Transearch database (VDOT). "The purpose of the freight diversion analysis was to evaluate the potential for truck traffic currently using I-81 to divert to rail intermodal service, and to confirm assumptions from previous studies. Several steps were taken to develop a method for the modal diversion analysis:
- A literature review was conducted to evaluate previous studies that examined diversion potential in the corridor, and identify existing data sources for inputs to the model.
- Identified existing truck-to-rail diversion models and selected the FHWA's Intermodal Transportation and Inventory Cost Model (ITIC) for the analysis.
- Translated a set of assumptions provided by Norfolk Southern and others about rail capacity improvements into values which could be modeled in ITIC; and
- Developed a set of criteria to select certain commodity movements in the 1998 Virginia Transearch™ database which are considered modally competitive.
The ITIC model was selected for use in the mode diversion analysis after a review of existing truck-to-rail diversion models. An advantage of this model is that it was developed and is maintained by the FHWA Office of Transportation Policy Studies in cooperation with the Federal Railroad Administration. Most of the data required for the model (except for rail variable costs and drayage distances) are readily attainable, and the model is well documented by the USDOT. The model is currently being refined and upgraded by a steering group of rail and truck experts under the FHWA.
ITIC, which is described in more detail later in this desk scan, is non-proprietary and can be modified to fit various truck size and weight, rail and transportation cost scenarios. It was also used to evaluate route diversions based on tolling scenarios in the I-81 study area. ITIC predicts modal diversion by calculating and comparing the total logistics costs for different modes of freight transportation.
The Transearch™ database provides the base data for this analysis. Transearch™ provides commodity detail to the four digit level as well as the annual tonnage for a particular commodity flow between an origin and destination. Only records that have been assigned to I-81 were analyzed. It is also important to note that only movements greater than 500 miles were assumed to be divertible to rail. County to county movements in Virginia, and shorter interstate movements were not included in the analysis. Movements that meet the following criteria were selected for analysis:
- Lane Density - Over 12.5 tons moved annually; and
- Distance - The distance between the origin and destination of the movement will be greater than 500 miles."
2.1.3 International Studies
A recent NCHRP report summarized the experience in Canada operating under their revised framework for regulating the size and weight of commercial motor vehicles (TRB 2010). This was an ex post assessment of changes associated with changes in truck size and weight policy in Canada.
The study concluded that the "Memorandum of Understanding among Canadian Provinces regarding vehicle weights an dimensions limits had a significant effect on the composition of the trucking fleet in Canada. There were significant differences in fleets in various regions of Canada reflecting differences in the types of commodities hauled. The 8-axle B-train is clearly the vehicle of choice for heavy haul in the four western provinces and in the four eastern provinces, where it did not exist prior to the Memorandum of Understanding (M.o.U.)." "The M.o.U. introduced the tridem semitrailer and the 8-axle B-train, and these are now the third and fifth most common configurations across Canada." "The tractor-tandem semitrailer (T12-2) was the most common configuration, by a wide margin, in all provinces, and made almost two-thirds of all cross-border truck trips, a proportion more than 60% higher than for all trips in Canada."
The study highlights the fact that, "A formal body, including federal and provincial government representation, was established to develop and oversee the process of rationalizing size and weight policy based on scientific analysis. The basis for technical input was the Canadian Vehicle Weights and Dimensions Study, which was specifically conducted to provide scientific input. The size and weight study provided an understanding of vehicle infrastructure interaction and produced a set of vehicle performance metrics that were used to specify vehicle configurations that had desirable vehicle dynamic characteristics and could operate within the load capability and geometric constraints of the road network."
The study concluded that "Size and weight regulation needs to be thorough and comprehensive so that the desired outcomes are achieved and undesirable outcomes are prevented. There is a need for monitoring of the fleet as it evolves to ensure that undesirable vehicles are kept in check and that the objectives of the policy can be fully achieved."
"The Canadian experience points to the simultaneous achievements of productivity, safety and environmental effects-aspects that are sometimes viewed as trade-offs."
2.1.4 Studies Using Aggregate Data and Econometric Models
In a literature search conducted for the 2000 CTSW Study, the most relevant modal-diversion study using aggregate data that was identified was performed by Jones, Nix and Schwier (USDOT 1995). "This study developed two sets of estimates of modal diversion resulting from changes in truck costs per ton-mile for three different potential changes in tax policy. Both sets of results were derived using estimates of the cross-elasticities of railroad revenue and railroad ton-miles relative to changes in truck costs. One set of results was obtained by deriving implicit cross-elasticities from high and low estimates of modal diversion previously provided to the Roads and Transport Association of Canada (RTAC) by the Canadian National (CN) and Canadian Pacific (CP) railways. In that case one set of cross-elasticities was applied to all traffic carried by the CN without regard to commodity, and a second set was applied to all traffic carried by the CP. The second set of results was obtained using elasticities developed by commodity, for 18 commodity groups, by the Association of American Railroads (AAR). The AAR elasticities vary with the size of the change in costs as well as with commodity group. The AAR elasticities produced estimates of revenue diversion that were up to 40 percent higher than did the CN/CP elasticities, and estimates of ton-mile diversion that were about twice as large as those produced by the CN/CP elasticities. The most likely reason for these differences is differences in the original estimates of modal diversion from which the cross-elasticities were derived. Other possible reasons are differences in the character of the road system in the United States and Canada, and differences in the character (commodity value, length of haul, etc.) of the movements in the individual commodity groups in the two countries.
The differences in the two sets of results illustrate an important limitation in the use of this type of analysis - the results are only as good as the cross-elasticities used. A related issue is the degree to which the scenario to be analyzed is similar to the one used in developing the cross-elasticities. In particular, if the cross-elasticities are expressed relative to transport costs (rather than relative to total logistics costs), do both scenarios generate similar changes in non-transport logistics costs for truck transport? (Many size and weight policy changes affect inventory costs, but changes in transport tax policy generally do not.) Also, do both scenarios apply uniformly to all types of hauls, or does one apply primarily to relatively divertible traffic (e.g., medium and long-haul traffic) and the other primarily to less divertible traffic?"
Since the 2000 CTSW Study several studies have used aggregate data to estimate the cross-elasticity of rail traffic with respect to trucking costs. Gerard McCullough of the University of Minnesota updated a study of the intercity freight markets that Ann Friedlaender and Richard Spady (FS) published in the Review of Economics and Statistics in 1980 (Friedlaender and Spady 1980). "The FS Study provided a macro-level perspective on the freight markets by focusing on transportation decisions in key industrial sectors-food, wood products, paper, chemicals, automobiles, and so on. The FS analysis and the current update of that analysis complement the short-run estimates of rail-truck competition levels. The FS analysis is based on a more generalized economic framework in which shippers have the flexibility to choose a range of productive inputs that includes truck and rail freight transportation along with labor, materials and capital. The FS framework thus provides a broader and longer term perspective on the potential effect that changes in TS&W regulations would have on the freight markets.
The diversion effects analyzed in the current study are based on a hypothetical ten percent decrease in trucking costs. This assumption is based in turn on the TS&W cost effects projected by the USDOT in its 2000 CTSW Study. The underlying assumption of the FS analysis is that freight shippers are business firms whose decisions can be modeled using statistical cost analysis. The elements of the cost analysis are industry output levels, freight movements and expenditures, firm levels of capital and materials, labor prices, truck prices, and rail prices. From their cost analysis, FS derive equations which specify how the shares of freight carried by each mode will respond to changes in truck and rail prices and other producer prices as well. The focus of both the FS analysis and the current analysis is on industry sectors where railroads and trucks compete for freight traffic."
The own-price and cross-price elasticities estimated in the study all had the proper sign and all were statistically significant. The report concludes that with a generalized 10 percent reduction in truck rates "the TS&W-related diversion effects ... would be consequential for railroads, shippers and general highway users."
Naleszkiewicz and Tejeda (2010) estimate truck to rail diversion using a freight mode choice model and the FAF database. The mode choice model is specified using a binomial logit functional form. The paper discusses the estimation of diversion in a risk adjusted framework which allows the capture of uncertainty associated not only with the diversion estimate but also forecasts of future freight traffic.
The proposition of the study is that rail capital improvement projects have the potential to divert trucks from highways by offering a lower-cost shipping alternative. The method uses a set of diversion filters first based on O-D pairs, followed by commodity filters, and finally distance. The mode choice model uses shipping costs as the primary variable and considers the price/mile and value of time/hour by truck and rail. The risk analysis is performed on the estimates of the logit regression over a range of possible values for the coefficients of the regression, using a distribution that is centered at the mean estimate and whose dispersion is proportional to the standard error of each estimator. This provides a risk-adjusted diversion function that assigns likelihoods to different possible market shares resulting from a given change in cost differentials. In addition, sensitivity analysis to estimate the market shares over a range of dependent and independent variables is useful to evaluate the accuracy and significance of the model estimates and permit the identification of critical variables affecting the market shares of each mode.
2.1.5 Studies of Mode Choice and Freight Demand
In addition to studies that have examined aggregate modal shifts associated with truck size and weight policy changes, there is another body of research that has examined mode choice decisions within the context of freight demand models. Holguin-Veras (2007) suggests that, "interactions between shippers and carriers determine mode choice." Shippers have preferences for shipment sizes that in many cases dictate the choice of mode, but where more than one mode could meet shipment size and frequency requirements, carrier prices, level of service, damage rates, and other factors will influence mode choice. He notes that, "in order to arrive at the joint optimum, shippers (through interaction with the carriers) need to become aware of the shape of the transport costs function, which has unit costs that decrease with shipment size. This then needs to be traded off against the inventory costs."
Abdelwahab and Sargious (1990) use economic order quantity models to examine tradeoffs between shipment size and mode. Total costs are a function of commodity value, inventory carrying cost, shipment size, usage rate, transit time and freight charges. The authors note that one of the earliest applications of an inventory-based approach to freight demand was a 1970 study by Baumol and Vinod. A major focus of Abdelwahab and Sargious is the relationship between freight rates and shipment size. Earlier studies had made simplifying assumptions that freight rates are independent of shipment size, but there was a recognition that freight rates generally vary by shipment size and may also vary by commodity value, density, and length of haul. The authors conclude that that there is dependence among freight rates, shipment size, and mode and that freight demand models should consider mode and shipment size simultaneously.
In a later paper Abdelwahab and Sargious (1991) investigate further the issues of mode choice and shipment size. They note Samuelson's position that "the relevant transportation choice which a shipper makes is not simply a choice between modes, but a joint choice of mode and shipment size. In most cases, the shipment size is practically mode determining..Hence, it follows that in freight demand modeling, shipment size and mode choice should always be modeled jointly." (Samuelson 1977). In particular Abdelwahab and Sargious examine theoretical aspects of modeling the interaction between two shipper choices, the discrete choice between modes and the continuous choice regarding shipment size. Similarly McFadden et. al (1986) developed an inventory-theoretic model that enables simultaneous analysis of determinants of mode choice, shipment size, and shipment frequency. Data issues hampered the empirical estimation of the model.
Cavalcante and Roorda (2010) developed a discrete/continuous model with shipment size as the continuous variable and vehicle-type choice as the discrete variable based on a shipper-based survey in Toronto. The study focused on the application of the model to urban goods movement as opposed to a nationwide or broad regional study. The modes studied included passenger vehicles, pickups/vans, single unit trucks, and tractor-semitrailers.
Hall (1985) examined relationships between shipment size and mode choice for truckload, less-than-truckload, and parcel delivery services. The model used was a variant of an economic order quantity model. Typical rate structures for each of the three types of service were developed and used along with inventory costs and other non-transportation logistics costs to identify the optimal mode and shipment size.
Abdelwahab and Sayed developed a neural network model of freight mode choice that they tested using 1977 Census of Transportation data on shipments by rail and truck. Shipments were characterized by a number of variables reflecting: (1) shipment attributes, such as size, value, density, special handling requirements, and shelf life; (2) modal attributes, such as, for each mode, duration and reliability of transit time, freight charges, susceptibility to loss and damage; and (3) market attributes, such as geographic location, volume of freight traffic on the origin-destination pair, and trip length. The authors tested the model and were able to predict the correct mode for 98 percent of shipments by truck and 73 percent of shipments by rail. They concluded that further development of neural network models was a promising approach to freight mode choice modeling.
Holguin-Veras (2002) examined the choice of truck configuration and shipment size as a discrete-continuous choice problem much as Abdelwahab and Sargious had examined the choice between truck and rail in the same way. A survey of truck drivers randomly selected at screenlines, cordons, and major trucking depots was conducted in Guatemala. "The sample, comprised of 5,276 observations of both empty and loaded trucks, was expanded on the basis of classified hourly traffic counts, and was post-processed to eliminate double counting. In addition to questions about trucking operational patterns, the truck drivers were asked basic questions about the shipper's characteristics. The sample contains information on shipment size, commodity types, and choice of commercial vehicles. The survey included questions on origins and destinations, type of vehicle, truck type, commodity type, shipment size, and economic sectors and activities at the origin and destination of the trip. This approach is similar to the one used by the commodity flow surveys" conducted by the Census Bureau. The truck configurations examined were pickups, single unit trucks, and tractor-semitrailers, so some methods and findings of this study are not germane to the issues being examined in the current study. The study examined the impacts of two policy options on vehicle choice - imposition of a weight-distance tax and changes in axle load limits - but found that neither had a significant impact. This perhaps was due to the trip characteristics and vehicle classes included in this study.
The econometric studies on mode choice and freight demand summarized above demonstrate the evolution of methodologies for analyzing optimum shipment size and vehicle configuration and some extended those methods to include analyses of truck size and weight limits. Many used the same types of transportation and logistics costs that are included in the ITIC model and several were based on national transportation databases such as the Census of Transportation. These studies, however, were not as comprehensive as the CTSW Study and did not require analysis of how changes in truck size and weight policy would affect travel by different vehicle configurations on different parts of the highway network and how vehicle weight distributions would be affected by changes in truck size and weight limits. All of these factors were important inputs to analyses of safety, infrastructure, energy and environmental impacts of truck size and weight policy changes.
2.1.6 Induced Demand
A key issue that has been raised in connection with potential increases in truck size and weight limits is the extent to which such changes might induce additional truck traffic because of lower costs associated with the use of larger, heavier trucks. A working paper was commissioned as part of USDOT's 2000 CTSW Study to examine this issue (Pickrell and Lee 1998). Pickrell and Lee of USDOT's Volpe Center stated the issue as follows: "To the extent that truck operators are constrained by regulations to operate differently from what they would choose to do without restrictions, the relaxation of truck size and weight regulations would allow truckers to carry more cargo at less cost. If it is assumed that trucking is a competitive industry, these savings will be passed on to shippers. Lower prices to shippers will induce some additional amount of freight movement, with more impact in the long run as producers and consumers respond directly and indirectly to the relatively lower prices. The question addressed here is how much additional truck freight?"
Pickrell and Lee distinguish two ways in which a reduction in truck freight costs could stimulate an increase in total freight shipments: (1) Changes in the composition of national output. "Prices for goods whose production and distribution costs include a significant trucking cost component would decline, and demand for these goods would increase in response. Producing and distributing the larger volumes of these goods demanded at their reduced prices would require an increase in the use of trucking services." (2) Substitution of trucking for other inputs to production. "Suppliers of goods would attempt to substitute trucking services for non-transportation inputs in their production and distribution processes, further increasing the number of ton-miles carried by truck. This could occur, for example, as suppliers relocate production or warehousing facilities to take advantage of lower shipping rates by distribution networks or even reorganize production processes to substitute transportation for other inputs in response to reduced costs for truck shipping."
For a hypothetical 10 percent reduction in trucking costs, the authors estimated the increase in truck shipping that would result through each of these two channels. The choice of 10 percent was for comparability with the reductions in trucking costs of between 5 and 12 percent that the 2000 CTSW Study estimated for its truck size and weight scenarios. The authors concluded that output compositional effects (the first of the channels identified above) would cause only a slight increase in truck freight, less than 0.3 percent. Although uncertainties about the parameter values underlying this estimate make it rather illustrative, the authors' conclusion appears sound. As the authors explain, trucking costs account for only a small share of production costs for most commodities; among the 48 commodity groups in their calculations, that share is less than 5 percent in all cases, and typically less than 2 percent. Therefore, a 10 percent reduction in trucking costs would produce only very small changes in the relative output prices of these commodities. Regarding the effects of input substitution (the second of the above-identified channels), the authors estimated that they would cause about a 2.5 percent increase in truck freight. However, this estimate is based on a highly conjectural value (0.25) for the elasticity of substitution between trucking and other inputs (a parameter that measures the extent to which these inputs are substitutable).
Winebrake et al. (2012) examine the issue of whether new regulations intended to reduce energy and GHG emissions may reduce trucking transportation costs and indirectly stimulate additional travel demand, thereby creating a direct ''rebound effect'' that could soften the effects of these policies. This analysis is analogous to the issue of whether reduced transportation costs associated with the use of more productive vehicles might induce additional VMT. Winebrake notes, "Literature examining the sources and magnitude of the rebound effect in the freight sector is still nascent. With a limited number of studies, concrete conclusions have not yet been constructed; nor has a framework been established for considering these studies in a policy context." Winebrake indicates that, "There are two types of freight elasticity estimates relevant to the rebound effect found in the literature: truck own-price elasticity, which measures a change in demand for trucking (in tons or ton-miles) in response to a change in trucking costs or freight rates and rail cross-price elasticity, which measures a change in demand for rail freight in response to a change in trucking costs or freight rates."
Winebrake summarized a number of studies that had estimated elasticities of demand for freight transportation as a function of transportation costs. All studies had shown some impact, but there was significant variation within and among each study, and differences in study scope, metrics, and other factors made it very difficult to generalize results. The authors summarize uncertainties in several areas that contribute to inconsistencies in study results. Those areas include type of commodity, shipment distance, transport region, availability of alternative modes, short-run vs. long-run impacts, and macroeconomic effects. The study concludes that more research is needed before elasticities of freight demand with respect to price can be used to estimate changes in VMT and fuel consumption.
2.1.7 ITIC Model
The ITIC model is used to evaluate truck-to-truck, rail carload-to-truck, and rail intermodal-to-truck diversion. The model has two modules - one for transportation costs, and one for inventory costs. While the inventory costs are calculated in the same manner for both rail and truck, the costs vary by mode. The transportation cost module is different for truck and rail as the two modes are represented by different datasets. Appendix E contains a detailed description of the evolution of the ITIC model and how it considers various factors important to modal shift analyses.
The ITIC model has been used with the Transearch commodity flow database as well as with county-level FAF data. When used with FAF data, the model takes as its inputs commodity flows by tonnage. Routes by different vehicle classes are determined for each O/D pair by commodity based on routes assumed to be available to each vehicle configuration. Commodity attributes (density, value, handling requirements (dry, temp controlled, bulk, etc.)), equipment type (van, reefer, bulk, etc.), highway network mileages, commodity/equipment-type/configuration load factors and O/D specific truckload volume freight rates by equipment-type/configuration are appended to the FAF flow data. For rail intermodal traffic being tested for diversion, rail line-haul and rail dray distance for costing freight rate of rail move is appended and the transportation costs for base and scenario cases are calculated.
The results of this analysis is fed into ITIC including annual commodity volume, handling requirements, shipment weight, base and scenario line-haul charges, dray charge (for rail intermodal), and line-haul and dray (for rail intermodal) miles.
The documentation of the ITIC model acknowledges that the model captures service quality considerations only in a "general way" and this is an artifact of the underlying data. Since detailed data is not available or is very difficult to get at the national scale, it is necessary to categorize the commodities more broadly. For example, "food and kindred products" would have included both canned goods and highly perishable goods. Service quality considerations present similar challenges for modeling choices of transportation mode. Choices between trucking and rail freight services (or rail combined with road) generally present a tradeoff between price and service quality. Rail freight is generally cheaper, but trucking has advantages in flexibility and speed, and often in reliability. It is difficult to quantify the service levels provided by each mode and the values that shippers assign to each service attribute.
2.1.7.1 Analysis of long-haul shipments
The assumption in the ITIC model is that the shipper chooses the transportation alternative that minimizes the sum of transportation and non-transportation logistics costs. The model adopts the conventional categorization of inventory costs as safety stock, cycle costs, and in-transit costs. For the calculation of safety stock, the model includes parameter values that measure the reliability of lead time for delivery. These values indicate lower reliability for rail carload than for other shipment options.
The ITIC model specifies that the amount of cycle inventory increases proportionally with the payload of the freight-moving unit. This means, for example, when a shipper switches to a truck with 20 percent more payload than a truck used previously, the amount of cycle inventory increases by 20 percent.
The scenario analyses assume that the total volume of freight that is shipped is fixed and does not attempt to estimate whether reductions in transportation costs would affect the total volume of freight shipped. As noted above, a brief study conducted by the Volpe Center for the 2000 CTSW Study concluded that any induced increase in truck freight traffic caused by reductions in shipping costs would be small enough to ignore without much loss of realism. Since changes in truck size and weight limits being examined in the current study are generally lower than changes examined in the 2000 CTSW Study, there is even greater reason to assume that any induced demand would not significantly affect estimated impacts.
2.1.7.2 Analysis of short-haul shipments
For short-haul shipments, the study notes that rail generally is not competitive with truck and considers only truck-to-truck substitution. For single unit trucks, substitution between three and four-axle trucks is a function of the change in their relative operating costs (induced by changes in TS&W limits). The 2014 TSW study assumes that there is no change in truck size and weight limits for single unit trucks. Short-haul combination trucks are assumed to have diversion that mirrors the diversion of long-haul combination trucks.
2.1.7.3 GAO Analysis of ITIC Model
The Government Accountability Office (GAO) evaluated the ITIC-IM model developed by the Federal Railroad Administration (FRA) as part of their evaluation of intercity passenger and freight rail. The ITIC-IM model is an extension of the original ITIC model that includes the ability to analyze impacts of a broader variety of changes that could affect truck-rail competition. To determine whether the available data and model assumptions were reliable for the purposes of the study, the GAO evaluated the ITIC-IM model input data for their relevance, completeness, accuracy, validity, and consistency. The GAO found that of the 26 variables used as input into the ITIC-IM model, empirical data were available for nine of the inputs. They concluded that "the issues of completeness, accuracy, validity, and consistency of our data negatively impact their reliability and increase the uncertainty of our estimates."
2.2 Summary of Mode Choice Methods and Past Studies
This section summarizes findings of the literature review of modal shift models and databases that might be applicable to the current 2014 CTSW Study. Many studies have examined the issue of freight mode choice using a variety of data and methods. The choice of data and methods in various studies typically is guided by the resources available for the study, the study scope and objectives, and other factors unique to each study. Thus in evaluating potential data and methods for the current 2014 CTSW Study, it is important to consider the unique requirements of this 2014 CTSW Study. Resources available for this study are greater than for most academic studies and State or regional studies. Along with the significant resources available for this 2014 CTSW Study comes an expectation that key issues will be examined rigorously and that the best, most reliable data will be used to analyze potential impacts of allowing various types of new configurations to use different parts of the highway system. Table 2 compares different general approaches to conducting modal shift studies that have been used in past studies. Study methods can be broken down into three general methodologies - (1) those that estimate modal choice for individual shipments based on characteristics of those shipments, and costs associated with moving shipments by the various modes between various origins and destinations; (2) studies that rely on expert opinions of shippers and carriers concerning the likelihood of shipments of various commodities traveling different distances under a variety of operating conditions and restrictions shifting to alternative modes; and (3) aggregate methods that estimate cross-elasticities of demand for one made based on changes in price and other characteristics of shipments by another mode.
Most recent large scale studies have used disaggregate analyses of individual shipments, although several recent State studies have relied primarily on expert opinions of shippers and carriers. Most studies using disaggregate methods have used actual data, but some like the study by Martland used synthetic data in lieu of actual data. Actual data is preferred when resources permit since they are less likely to be challenged as being representative. This is especially true for studies such as the current 2014 CTSW Study when complex relationships involving different vehicle classes operating on different highway networks in different parts of the country are being analyzed.
Table 3 summarizes key freight mode choice studies in terms of their geographic scope, the modes considered in the study, the data used in the mode choice analysis, and the general methodology used to estimate mode choice. The methodologies correspond to those included in Table 2. Most national studies have used disaggregate total logistics cost models for at least part of the study, the exception being the academic study by McCullough which used econometric methods to estimate cross-elasticities of demand for one rail based on an assumed change in trucking rates. Recent State truck size and weight studies have tended to rely on expert opinion supplemented by sensitivity analysis.
Several critical decisions must be made regarding the modal shift analysis for the current truck size and weight study. These include:
- the method (and specific model if applicable) to be used to estimate shifts among vehicle configurations and different modes as the result of the truck size and weight scenarios
- the source and level of disaggregation of data that will be needed to support analyses using the selected analytical tool
- the extent to which all data must be publicly available
Each of these factors is discussed below including tradeoffs associated with certain decisions.
2.2.1 Modal shift methodology
As shown in Table 2, there are three basic methods that have been used in recent studies examining potential modal shifts associated with changes in truck size and weight policy
- Disaggregate total logistics cost models
- Expert opinion, often accompanied by sensitivity analysis
- Aggregate econometric methods based on estimates of the cross-elasticity of demand for one mode based on changes in price or service characteristics of another mode.
Recent large-scale Federal studies have all used disaggregate total logistics cost models for at least part of the analysis, and logistics cost models have been used in other studies as well. Several recent State studies have used expert opinion coupled with sensitivity analysis. Only a very few studies have based their estimates of mode choice on estimates of cross-elasticities of demand between two modes.
A review of the literature indicates that there is no single cross-elasticity that can be used to reflect competitive relationships across modes for the movement of different commodities in different markets. The primary use of cross-elasticities has been to estimate potential truck to rail or rail to truck shifts resulting from some price or service change. In general, those studies that have used cross-elasticities have been interested only in general estimates of the overall impact on one mode associated with changes in another mode. They have not been interested in mechanisms by which those changes occur or differentiating impacts on different parts of the industry. No examples were found where cross-elasticities were used to estimate potential shifts among different truck configurations as the result of size and weight policy changes. Nor is there data upon which to adequately estimate cross-elasticities between modes based on different network availabilities. Based on these findings, it does not appear feasible to use cross-elasticities derived from aggregate econometric analysis to satisfy the requirements of the 2014 CTSW Study.
Recent State studies that have relied upon expert opinions of shippers and carriers to estimate changes in mode choice associated with truck size and weight policy changes have generally been focused on a narrower range of issues than the current truck size and weight study. Expert opinion is valuable when opinions are based on a clear understanding of the factors that will affect mode choice decisions, but the more complex the decisions, the harder it is for experts to reliably anticipate the overall response to policy changes. Most recent State studies have been primarily concerned about potential impacts of allowing heavier tractor-semitrailers to operate. Network limitations have been easily defined and it has been relatively easy to identify the universe of shipments that might divert to vehicles with higher gross vehicle weight limits. A nationwide study that includes larger, heavier trucks as well as rail and potentially water modes is more complex than the State studies that have relied on expert opinion. The impact of network limitations on certain vehicle configurations would be difficult for many experts to estimate and tradeoffs between rail and longer combination vehicles are not always clear. Perhaps the greatest drawback to the use of expert opinion for the current study, however, is the lack of objective criteria upon which modal shift estimates are made. Not everyone will agree who is an expert and even experts could be expected to disagree on the potential use of different configurations based on different individual assumptions about how they would operate. The lack of objective criteria for modal shift decisions could adversely affect the credibility of the study.
While there certainly are known weaknesses with existing disaggregate total logistics cost models, they do offer an objective basis upon which to estimate the changes in transportation and non-transportation logistics costs to move different commodities between different origins and destinations resulting from changes in truck size and weight limits. Existing models such as ITIC are transparent and have been used in enough different types of application to have some confidence in their use.
There are several reasons for using the ITIC model for the current 2014 CTSW Study. First, it is a model that was developed by the Department and that has been used both by FHWA and FRA. This should reduce any claims that the model is biased toward one mode or the other. Second, the ITIC model has undergone recent updates that should reduce the time it takes to get the model up and running. The ITIC model framework allows for testing the impact of alternative assumptions. There was an intensive search for modeling tools, but alternative models that would meet objectives of the current study were not found.
Conclusion: Based on factors discussed above, it is recommended that the ITIC model be used as the basis for estimating modal shifts for the truck size and weight study.
2.3 Data Requirements and Sources for Modal Shift Analysis
The analysis of potential modal shifts associated with truck size and weight policy changes is only as good as the data upon which it is based. As noted above, having good data on both the commodities being moved and the origins and destinations of commodity movements by different modes is essential to assessing which moves might shift to alternative modes and truck configurations. A review of commodity flow databases was conducted as part of the National Cooperative Freight Research Program (NCFRP) 20 Study, Developing Subnational Commodity Flow Data (Cambridge Systematics 2010).
For the purpose of this study, two data products are of primary interest: A multi-dimensional commodity flow matrix, the principal dimensions of which are the volumes of freight moving between various origins and destinations by mode and type of commodity; and a series of network routings showing how freight vehicles move over the nation's freight transportation network (highways, railways, waterways,).
2.3.1 Freight Analysis Framework (FAF) Data
One such multi-modal commodity flow database is the Freight Analysis Framework (FAF) developed by FHWA. This database was used in the Western Uniformity Scenario Analysis by FHWA. The FAF integrates data from a variety of sources to estimate commodity flows and related freight transportation activity among states, regions, and major international gateways. The original version, FAF1, provides estimates for 1998 and forecasts for 2010 and 2020. FAF2, provided estimates for 2002 plus forecasts through 2035. The latest version of the FAF, FAF3, is based on the 2007 Commodity Flow Survey (CFS) and provides estimates for 2007, plus forecasts through 2040.
FAF3 has a number of improvements to the commodity flow matrix over previous versions including:
- A roughly doubling of the number of U.S. shipping establishments sampled as part of the 2007 U.S. Commodity Flow Survey (from some 50,000 establishments in 2002, to approximately 100,000 establishments surveyed in 2007);
- The use of PIERS data to support improved allocations of imports and exports to FAF domestic zones of freight origination (for U.S. exports) and destinations (for U.S. imports);
- Incorporation of additional federal datasets within an improved FAF3 log-linear modeling/iterative proportional fitting algorithm, as well as the development of estimates of flows for commodities that were out-of-scope for the CFS;
- Greater use of U.S. inter-industry input-output coefficients in estimating commodity flows that were out-of-scope for the 2007 CFS; and
- FAF3 provides an O-D specific treatment of natural gas products, which were evaluated only at the level of national or broad regional activity totals in FAF2 (Southworth 2010, p. 3).
Figure 4 shows the FAF3 freight flow matrix construction process. The matrix construction begins with the data from the 2007 CFS, and uses the same geographic (123 domestic U.S. FAF zones) and commodity (43 Standard Classification of Transported Goods (SCTG) definitions as the CFS but uses a modified version of the CFS modal definitions (Southworth 2010, p. 7).
Figure 4. Overview of the FAF3 Freight Flow Matrix Construction Process(USDOT FHWA 2010, p. 7)
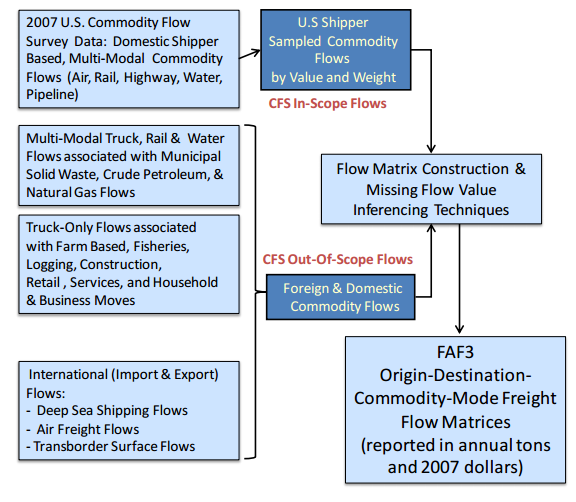
The CFS represents the best basis for FAF construction because it provides shipper sampled, and subsequently expanded estimates of both tons shipped and dollar value trades within and between all US regions for all modes of freight transportation. However, the CFS has a number of well researched weaknesses that require considerable additional effort in order to construct a complete accounting of freight movements within the United States (see TRB, 2006). First, the CFS does not collect secondary moves, e.g., public warehousing where public means a for-hire service and not an auxiliary establishment of a manufacturer. Second, the CFS does not report imports, and CFS reporting of export flows is also subject to data quality issues resulting from limited sample size. Finally, the CFS either does not collect data from the following freight generating and receiving industries, or collects insufficient data to cover the industries in a comprehensive manner: Truck, rail and pipeline flows of crude petroleum, and natural gas; Truck shipments associated with farm-based, fishery, logging, construction, retail, services, municipal solid waste, and household and business moves; and Imported and exported goods transported by ship, air, and trans-border land (truck, rail) modes. In FAF3 these industries produce what are referred to in Figure 4 as Non-CFS or Out-Of-Scope (OOS) to the CFS freight flows. Their estimation requires a good deal of data collection and integration into the larger flow matrix generation process. The data sources for these OOS flows are for the most part derived from freight carrier reported data sources, in some cases requiring the use of secondary or indirect data sources, such as location specific measures of industrial activity, employment or population, to allocate flows to specific geographic regions. These OOS flows represent some 32% of all U.S. freight movements measured on an annual tonnage basis. In addition to the OOS movements noted above, suppression of some in-scope flows is also an issue if there are insufficient CFS observations across mode, commodity, or origin and destination to protect confidentiality. The FHWA used a combination of log-linear modeling and Iterative Proportional Fitting (IPF) techniques to fill missing cell values, supplementing the CFS with data from the Surface Transportation Board (STB) Public Use Railcar Waybill data and US Army Corp of Engineers (USACE) Waterborne Commerce Data. Figure 5 gives an overview of the process to estimate the missing cell values in the 2007 CFS.
Figure 5. Estimation of Missing Cell Values in the 2007 CFS (Southworth 2010, p. 10)
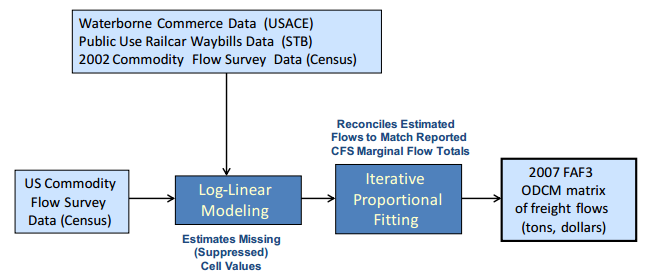
OOS flows were estimated using commodity specific datasets and different computational methods for each industrial class. Methods varied depending on whether flows were domestic or import/export. Where an industrial sector produces O-D flows in more than one commodity class, data from national inter-industry input-output tables were used to estimate how much freight each sector contributes to a specific set of SCTG 2-digit commodity flows. State and county level data on volume of production, industrial or commodity specific sector sales, or industrial sector employment is then used to allocate flows between origins and destinations. Spatial allocation formulas are then used to produce O-D flow volumes. Where truck movements were concerned this occurred in one of two ways. One way was to determine county level origin and destination activity totals and then apply a spatial interaction model to these county productions and attractions, with subsequent aggregation of inter-county flows back up to FAF3 region-to-region flow totals. The second way was to estimate origins and destinations of commodities at the FAF3 regional level and then estimate flow between each of the FAF3 regions. The specific form of spatial interaction model used also varied by commodity class. Either a distance decay coefficient was calibrated against an empirically derived average shipping distance, or a simple allocation was made based on market potentials (i.e., on the relative size of a county's or region's demand for a specific commodity). County-level spatial interaction modeling here allows for cross-county flows to be captured that are also cross-FAF3 adjacent regional flows. Use of regional O and D shipment totals prior to spatial interaction modeling occurred where data sources proved more reliable at this less detailed level or geography. Figure 6 shows the process for generating the OOS truck freight flows.
Figure 6. Process for Generating OOS Truck Freight Flows (Southworth 2010, p. 14)
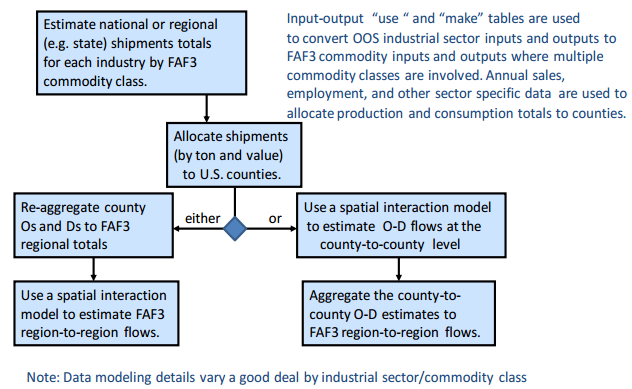
Import and export freight flows in FAF3 are constructed from a variety of data sources, each of which has their own unique coding system and needs to be converted into FAF3's 2-digit SCTG codes, as well as have its flows either spatially aggregated or disaggregated to FAF3 analysis zones. Figure 7 provides an overview of the FAF3 international data modeling. As shown in the figure, datasets from multiple private and public agencies such as the Bureau of Transportation Statistics (BTS), USACE, Energy Information Administration (EIA), US Census Bureau's Foreign Trade Division (FTD), Port Import Export Reporting Service (PIERS), etc., are used to construct FAF3's import-export freight flows.
Figure 7. FAF3 International Data Modeling ((Southworth 2010, p. 22)
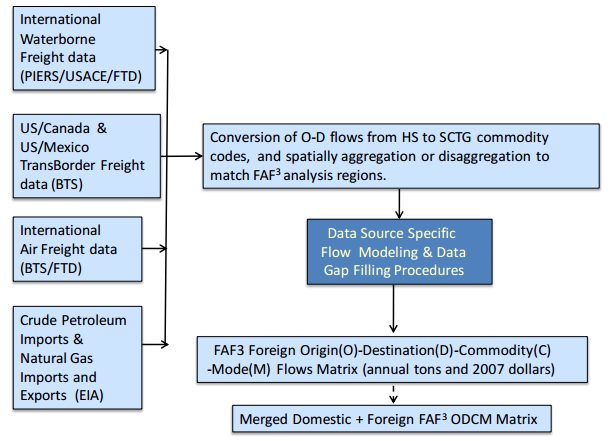
Use of FAF in the Western LCV Uniformity Scenario. For the Western LCV Uniformity Scenario, a version of FAF having county-to-county flows was developed that allowed detailed assessments of the potential shift to LCVs based on the networks that would be available to those vehicles and the extent to which those networks served various shipment origins and destinations at the county level. The current release of FAF (version 3) has data available only at the FAF region level. If the modal diversion analysis were performed at this level of detail, it would be impossible to directly consider network limitations for some LCVs when estimating potential diversion of traffic to those configurations since virtually all FAF regions are served by all highway systems. In the Western LCV Uniformity Scenario analysis, the limited networks assumed to be available to various types of LCVs significantly affected estimates of overall diversion and the configurations to which shipments were diverted. To understand the effects of network limitations on some vehicle configurations, greater geographic disaggregation of freight flows is required than the current version of FAF provides.
While disaggregating the FAF to a county level enhances the analysis of potential truck size and weight policy options by allowing impacts of limiting certain vehicle configurations to particular highway networks to be assessed, it is important to recognize that uncertainties exist in the disaggregation process. The greatest uncertainty is in the exact quantity of particular commodities shipped into or out of individual counties within each FAF region. Various measures of industrial activity are available at the county level, but associating exact quantities of commodities demanded or supplied with different levels of industrial activity is imprecise. That is one reason why FHWA does not provide county level data to State and local governments - while the data may be good enough for national level policy analysis, they may not be good enough by themselves for more detailed freight planning studies at the State or regional level. Depending on the purpose and scope of such freight planning studies, State and local agencies may purchase more detailed data from third-party suppliers or they may do special studies themselves to produce more accurate estimates of the commodity flows than could be produced simply by allocating regional totals on the basis of general measures of economic activity. Much greater precision is required for State and local planning studies that could lead to investment decisions than for national-level policy analyses.
The FHWA recently sponsored a workshop to "discuss national multimodal freight analysis framework (FAF) research. Participants discussed the state of the art, primary gaps in current capabilities, and strategies for addressing these gaps, particularly in the areas of multimodal freight networks, freight demand modeling, and origin-destination data disaggregation. Workshop participants identified several opportunities regarding new methods for data, as follows:
- Local-level details (e.g., local O-D data, local network data, local truck, local commodity truck, etc.) are not currently captured in the national FAF. Opening data for peer review and creating an architecture that allows information to be passed from the local level to the national level (i.e., establishing ground truth) could increase data validation.
- Data mining could supplement current national-level freight data to capture temporal and seasonal variations or enable tracking of commodity flows-the current FAF displays only in mode-centric, O-D, and annual flows.
- New automated methods for data manipulation could mitigate the variability of data quality-collected and reported on a State-by-State basis-and missing data, which limit the ability to support analysis of intermodal and national-level freight flows.
- Enhanced data could provide the ability to assign flows along a multimodal routable network, creating a "flowable" network, that is, one that enables tracking of flows from any origin to any destination."
2.3.2 IHS Global Insight Transearch
Transearch is a privately maintained comprehensive market research database for intercity freight traffic flows compiled by IHS Global Insight. The development of the Transearch database involves the fusion of various freight traffic data sources into a common framework for planning and analysis. The database provides detailed U.S. and cross-border origin-destination freight shipment data at the state, Bureau of Economic Analysis (BEA), county, metropolitan area, and zip-code level detail by commodity type (by Standard Transportation Commodity Classification (STCC) code) and major modes of transportation. Forecasts of commodity flows up to 30 years in the future are available for the following four modes - air, truck, water, and rail.
The data is compiled from the following sources: Commodity Flow Survey (CFS); Carload Waybill Sample; USACE Waterborne Commerce Statistics; Federal Aviation Authority (FAA) Airport Activity Statistics; Bureau of Census FTD; American Association of Railroads (AAR) Freight Commodity Statistics; and Inter-industry trade patterns. Transearch uses CFS data for the following: (TRB 2006, p.131)
- To calculate commodity $/ton values. The $/ton values maintained for Transearch production are updated annually for the intervening non-CFS years using inflation-based factors derived from sources such as the Producer Price Index;
- To calculate for-hire/private trucking mode share splits; To develop OD truck flows;
- To develop truck length-of-haul profiles;
- Identification of commodities moving via air mode; and
- Quality control.
Transearch has some limitations on how this data should be used and interpreted:
Mode Limitations - The Rail Waybill data used in Transearch is based on data collected by rail carriers terminating 4,500 cars or more annually. The waybill data contains some information for regional and short-line railroads, but only in regards to interline service associated with a Class I railroad. The rail tonnage movements provided by the Transearch database, therefore, represent only a portion of total rail shipments. Another issue with the rail waybill interlined shipments is that participating carriers may be billed for only their portion of the move, distorting the actual freight movements in the database.
Use of Multiple Data Sources - Transearch consists of a national database built from company-specific data and other available databases. To customize the dataset for a given region and project, local and regional data sources are often incorporated.
Data Collection and Reporting - The level of detail provided from some specific companies when reporting their freight shipment activities limits the accuracy of Transearch. If a shipper moves a shipment intermodally, for example, one mode must be identified as the primary method of movement. Suppose three companies make shipments from the Midwest U.S. to Europe using rail to New York then water to Europe. One company may report the shipment as simply a rail move from the Midwest to New York; another may report it as a water move from New York to Europe; the third may report the shipment as an intermodal move from the Midwest to Europe with rail as the primary mode. The various ways in which companies report their freight shipments can limit the accuracy of Transearch due to the reporting of unlinked trips. Unlike Transearch, FAF3 considers intermodal trips (truck-rail etc.) as a distinct mode in the development of the origin-destination flow matrix and is therefore able to represent trips more completely. The FAF3 reports trips as linked trips, i.e., in the same example above, the shipment is reported one trip using rail and water as the shipping modes.
Limitations of International Movements - Transearch does not report international air shipments through the regional gateways. Additionally, specific origin and destination information is not available for overseas waterborne traffic through marine ports. Overseas ports are not identified and Transearch estimates the domestic distribution of maritime imports and exports. Transearch data also does not completely report international petroleum and oil imports through marine ports. In FAF3 a variety of data sources such as the US Army Corp of Engineers International Waterborne Commerce, US Census Bureau's Foreign Trade database, a FAF3-specific extraction of data from the Port Import Export Reporting Service (PIERS), Bureau of Transportation Statistics (BTS) T100 Data, and BTS TransBorder Freight Database are used to estimate international flows from/to overseas by water, air, and truck to/from the FAF3 region along with the Port of Entry/Exit (POE).
Transearch's county-to-county market detail is developed through the use of Global Insights' Motor Carrier Data Exchange inputs and Global Insights' Freight Locator database of shipping establishments. Freight Locator provides information about the specific location of manufacturing facilities, along with measures of facility size (both in terms of employment and annual sales) and a description of the products produced. This information is aggregated to the county level and used in allocating production among counties. Much of the Motor Carrier Data Exchange inputs from the trucking industry are provided by zip code. The zip code information is translated to counties and used to further refine production patterns. A compilation of county-to-county flows and a summary of terminating freight activity are used to develop destination assignments.
Transearch is widely used for State and local freight planning purposes. It also can be used in conjunction with the TREDIS modeling system developed by the Economic Development Research Group to assess economic impacts of various changes in freight transportation service and performance. TREDIS, however, is not a logistics-based model and would not be able to estimate mode choice decisions based on changes in truck size and weight limits.
Transearch is the only nationwide proprietary commodity flow data uncovered in the desk scan that contains data on multiple modes of transportation. As discussed below, the Surface Transportation Board maintains a Carload Waybill Sample of rail shipments that has both public use and proprietary versions, but that database only contains data on rail moves.
Commodity Flow Survey - The Commodity Flow Survey (CFS) produces data on the movement of goods in the United States and provides information on commodities shipped, their value, weight, and mode of transportation as well as the origin and destination of shipments of commodities from manufacturing, mining, wholesale, and select retail and service establishments. The CFS covers business establishments with paid employees that are located in the United States and are classified by the North American Industry Classification System (NAICS) in mining, manufacturing, wholesale trade, and selected retail and service trade industries. The survey does not cover establishments classified in transportation, construction, and most retail and service industries. Farms, fisheries, foreign establishments, and most government-owned establishments are also excluded. The CFS captures shipments originating from select types of business establishments located in the U.S., except for Puerto Rico and other U.S. possessions and territories. Shipments traversing the United States from a foreign location to another foreign location are not included, nor are shipments from a foreign location to a U.S. location. However, imported products are included in the CFS at the point that they leave the importer's initial domestic location for shipment to another location. Shipments that are shipped through a foreign territory with both the origin and destination in the U.S. are included in the CFS data. The CFS data is one of the main building blocks of both FAF and Transearch, but by itself is not suitable for modal diversion analysis.
STB Public Use Waybill Data - The Public Use Waybill Sample (PUWS) is a non-proprietary version of the STB Carload Waybill Sample. The STB requires that all U.S. railroads that terminate more than 4,500 revenue carloads submit a yearly sample of terminated waybills. The waybills are sampled under two different plans, depending on the number of carloads on the waybill and weighted using appropriate multipliers for each sampling level, which are not disclosed, to represent total U.S. rail movements in that year. Use of the waybill data is subject to some qualifications. As with any sample, some portions of the total population are better represented than others. Since the full Carload Waybill Sample contains specific waybill information such as origin and termination freight station, junction points, and rail carrier identification, it is not suitable for public release. As an alternative, the Public Use Waybill Sample has been created from the original full sample by eliminating station and carrier information. Origin and termination points are reported by BEA area and junction points are reported by state or province, rather than by freight station or city name. Additionally, some waybill records are excluded from the PUWS. The PUWS only contains rail freight movements for commodities handled by at least three freight stations in the U.S. If a 5-digit commodity was not handled by at least three Freight Station Accounting Codes (FSACs) nationwide, the record is rejected for the PUWS. Commodities (with the exception of munitions data) are identified at the 5-digit STCC level. Because of the sensitive nature of the munitions data, this information is reported at the 2-digit STCC level (STCC 19) and no geographic coding for these records is included. The use of BEA economic areas in the PUWS is subject to the "three-FSAC rule". This rule was adopted to protect against any disclosure of competitively sensitive waybill data in the Public Use file. Under this approach, a BEA economic area is only reported if there is activity for at least three FSACs on one railroad for a given commodity within that BEA, or if there are at least two more FSACs with activity than there are railroads in that BEA economic area for a given commodity. Records that do not pass the three FSAC rule are still included, but without any geographic coding. Intermediate junction data is shown only when both the originating and the terminating BEAs pass these criteria. Only about 45 to 50% of the total waybill records have full geographic data.
2.3.3 Networks
The FAF2 geospatial network coverage was used as the basis for updating the FAF3 network. It represents more than 447,400 miles of the nation's highways comprised of Rural Arterials, Urban Principal Arterials, and all National Highway System (NHS) routes. The following roadways are included:
- Interstate highways;
- Other FHWA designated NHS routes;
- National Network (NN) routes that are not part of NHS;
- Other rural and urban principal arterials;
- Intermodal connectors;
- Rural minor arterials for those counties that are not served by either NN or NHS routes; and
- Urban bypass and streets as appropriate for network connectivity.
Updates from the FAF2 to the FAF3 network include:
- Updates to NHS designation and intermodal revisions current to version 2009.11 releases;
- Additions or updates to urban bypass or other state specific highway alignment; and
- Integration and updating of NN and LCV route designations, state link specific truck restrictions, clearances, and hazmat route restrictions.
2.3.3.1 FAF3 Network and HPMS 2008 Data Integration Process
The 2008 HPMS database was selected for the 2007 network update to ensure base year information consistency. Typically each HPMS current year release (e.g., 2008) is based on the last year (e.g., 2007) state reported roadway inventory database. The link specific information was then further processed to minimize the attribute discrepancy at the state/or urban boundary and at other locations where link specific data gaps exist. For missing and non-sampled links, truck traffic percentages were updated using a combination of state specific functional class averages and/or correlations with adjacent link truck percentages. The 2040 values for average traffic volume and truck traffic were estimated using the state growth factor reported in the HPMS 2008 database and projected to 2040 using a linear growth algorithm.
The HPMS and NHS data sources both provide Linear Referencing System (LRS) information. However, due to changes in the submittal criteria, the two data sources have not maintained a common format that would allow direct relating of their respective data. To overcome this issue, HPMS and NHS data are related using algorithms, as necessary, for primary and secondary signage, mileposts, and translated LRS identifiers.
The FAF3 network has information on each link's truck restrictions, and the types of trucks and LCVs that are allowed on the network. The FAF3 data do not provide an estimation of the Average Daily Truck Traffic (ADTT) used to move freight between the shipping zones. The work flow diagram shown in Figure 8 illustrates a general overview of the process of estimating the AADT. The primary source of information for developing the procedures for converting commodity flows in tons to truck trips was the 2002 Vehicle Inventory and Use Survey (VIUS) database. The VIUS provides national and state-level estimates of the total number of trucks by truck type.
Figure 8. Truck Conversion Flow Diagram (Battelle (2011), p. 3-2)
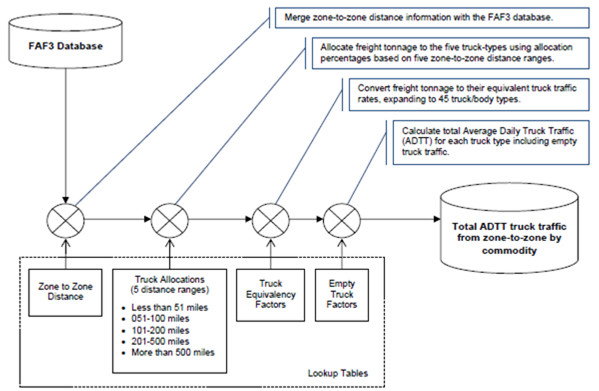
There are five groups of truck configurations, ranging from single unit trucks to tractor plus triple trailer combinations, nine types of truck body types, such as Dry Van, Flat Bed, and Tank. The allocation of FAF3 O-D tonnage for each truck configuration and body type was carried out for each commodity the truck carried. The conversion of commodity flows from tons to trucks is done in the following steps. The first step involves identifying the primary truck configurations (Single Unit Trucks, Truck plus Trailer Combinations, Tractor plus Semitrailer Combinations, Tractor plus Double Trailer Combinations, and Tractor plus Triple Trailer Combinations) and major truck body types (Dry Van, Flat Bed, Bulk, Reefer, Tank, Logging, Livestock, Automobile, and Other). This is followed by allocation of commodities to truck configurations used to transport these commodities. Following this, the average payload by vehicle group and body type is estimated and converted into the equivalent number of trucks. Finally, the percent of empty truck trips is calculated.
2.4 Future Research Needs Related to Estimating Modal Shifts Associated with Truck Size and Weight Policy Options
As indicated above, substantial research has been conducted over an extended period of time on potential impacts of changes in truck size and weight policy on shifts of traffic between modes and between different truck configurations. Research has been conducted at the national, regional, State, and corridor levels using a variety of analytical techniques and data sources. Analytical techniques have ranged from complex models of transportation logistics costs associated with the use of different modes to expert opinions about potential impacts. To a large degree methods have reflected the resources available to conduct the study and the scope of the study. Studies whose sole objective was to estimate potential impacts of truck size and weight options on modal diversion were more likely to use econometric methods or logistics models that are not linked to highway networks. Studies that also focused on estimating infrastructure, safety, and other outcomes of modal diversion have tended to use logistics models and disaggregate commodity flows that are linked to the highway network. State studies that have not had the resources available to many federal studies have often relied on expert opinion rather than data-intensive logistics cost models.
Data used in the various studies have ranged from highly disaggregate commodity flows synthesized from a variety of primary and secondary sources, to synthetic data meant to broadly represent different types of operations, to surveys of individual companies. Again the resources available to conduct the study and the study objectives strongly influence the data used in the study. Synthetic or survey data could not be used to produce defensible estimates of safety and infrastructure implications of modal diversion. A special analysis was conducted for the 2014 CTSW Study to disaggregate the FAF to produce county-to-county commodity flows. Additional research to improve estimates of county-to-county flows is needed. Several specific research activities to improve commodity flow databases were identified in a recent FHWA workshop and are discussed in Section 2.3.1 above.
There is a consensus across all past studies that larger, heavier trucks would divert traffic from truck configurations operating today and that traffic also could be diverted from the railroads, but the potential magnitude of impacts varies considerably among studies. Much of the difference can be accounted for by different assumptions in each study about the weights and dimensions of larger trucks, the networks on which they would operate, the potential response by the railroads to increased competition from the larger trucks, impacts of larger trucks on overall transportation and logistics costs, responses by shippers and carriers to the availability of larger, heavier trucks, and other factors.
Improving estimates of modal diversion will require additional research in several areas. First, estimates of the logistics costs associated with the use of different modes and truck configurations need to be improved. Currently the various logistics costs are assumed to be the same for all companies, but this clearly is not the case. Better information on how logistics costs vary for different types of companies would improve our understanding of impacts of truck size and weight changes, but as Middendorf and Bronzini found, it is very difficult to get good information from companies on their logistics costs. Second, because truck size and weight limits in the U. S. have not changed significantly in many years, there is very little empirical data on responses of different parts of the transportation industry to changes in truck size and weight limits. Truck size and weight limits have changed in Canada, Australia, and other countries, however. In depth examinations of impacts of changes in other countries could inform researchers in the U.S. and help calibrate models used to estimate modal shifts and other responses to truck size and weight changes. Third, the Vehicle Inventory and Use Survey is an important source of information on the way trucks are actually used in practice, providing such information as the percent of their mileage that is empty, the types of commodities carried in different vehicle configurations and body types, the average mileage traveled annually by different types of vehicles, etc. This survey has not been conducted in over ten years and information is becoming quite dated. A new Vehicle Inventory and Use Survey would provide much improved information for use in truck size and weight studies.
Another research need related to the ITIC model is the fact that it is an all-or-nothing model that assumes that all shipments of a particular commodity between the same O-D pairs will respond the same to a change in transportation or non-transportation logistics costs. Estimates could be improved if different probabilities could be assigned to modal shifts based on characteristics of the commodities, transportation modes and corridors involved. This likely would take considerable resources to develop
2.5 Comparison of Findings from Past Modal Shift Studies
As noted above, it is difficult to directly compare results from the various studies that have estimated modal diversion associated with truck size and weight policy options. Studies differ in, among other things
- geographic scale,
- the types and detail of changes they are attempting to estimate,
- the data and methods used
- the weights, dimensions, and vehicle configurations they are examining, and
- the metrics they use to measure impacts.
Nevertheless comparing findings of these studies can help shed light on factors that are important in understanding impacts of truck size and weight policy changes. Table 4 shows findings from major studies whose results lend themselves to comparison with other studies.
| Study | Vehicles and Weights Analyzed k = thousands of pounds | Change in Truck VMT (percent) | Change in Rail Travel (percent) |
|---|---|---|---|
| Nationwide Studies | |||
| USDOT, Comprehensive Truck Size and Weight Study (2000) | 3S3-90k; Twin 33s-124k 3S3-97k; Twin 33s-131k RMD-120k; TPD-148k*; Triple-132k Triple-132k |
(11) (11) (23) (20) |
(5) 2 (6) 2 (20) 2 (4) 2 |
| Martland, “Estimating the Competitive Effects of Larger Trucks on Rail Freight Traffic”, (2007)(impacts on short-lines only) | 3S3-97k RMD-110k TPD-148k |
(13) 3 (18) 3 (34) 3 |
|
| Martland, “Estimating the Competitive Effects of Larger Trucks on Rail Freight Traffic,” (2010) (impacts on Class 1 railroads) | 3S3-90k 3S3-97k RMD-129k TPD-129 TPD-148k Triple-110k |
(13) 3 (19) 3 (36) 3 (30) 3 (60) 3 (12) 3 |
|
| Regional Studies | |||
| USDOT, Western Uniformity Scenario Analysis (2004) | RMD-129k; TPD-129K*;Triple-110k* | (25) | (.02) 3 |
| Cambridge Systematics, Minnesota Truck Size and Weight Project, Final Report, (2006) | 3S3-90k; 3S4-97k; 3S3-2-108k; SU4-80k | ** | NA |
| Cambridge Systematics, Wisconsin Truck Size and Weight Study, 2009 1 | 3S3-90k 3S3-98k 3S4-97k 8-axle twin-108k SU7-80k 6-axle truck-trailer-98k |
(.06) (0.4) (.18) (1.2) (.07) (0.5) (.06) (0.4) (.01) (.02) (.01) (.04) |
NA |
| Stephens, Impact of Adopting Canadian Interprovincial and Canamax Limits on Vehicle Size and Weight on the Montana State Highway System, (1996) | Various vehicle classes allowed under Canadian Interprovincial and Canamax Standards | (<=3)*** | NA |
| Bienkowski, The Economic Efficiency Of Allowing Longer Combination Vehicles In Texas (2011) | 3S3-97k; TPD-90k; TPD-148k | (31)*** | NA |
| McCullough, Long-Run Diversion Effects of Changes in Truck Size and Weight (TS&W) Restrictions: An Update of the 1980 Friedlaender Spady Analysis, 2013 | NA - 10% reduction in truck costs assumed | 7 | 8.5 4 |
NA= not analyzed
* Limited network return to Footnote *
** No change in VMT reported, no % change in transport cost savings reported return to Footnote **
*** Impacts of specific vehicle configurations were not reported return to Footnote ***
1 Numbers in the left column are for non-Interstate operations only. Numbers in the right column assume vehicles can also operate on the Interstate System return to Footnote 1
2 Estimated change in rail car-miles return to Footnote 2
3 Estimated change in ton-miles return to Footnote 3
4 Estimated change in net income return to Footnote 4
Reductions in truck travel estimated in the various studies ranged from a high of 31% in the Bienkowski study in Texas to little or no impact for some heavier configurations in Wisconsin. The major reason for such a large difference is the metric used to express results. In the Texas study changes are based only on shifts from the base vehicle configuration to the scenario configurations whereas changes in Wisconsin and Montana reflect estimated changes in overall heavy truck VMT including substantial VMT that would not be affected by the introduction of the scenario vehicles. Reductions in truck traffic estimated in USDOT's 2000 CTSW Study vary as one would expect with greater reductions being estimated for those vehicle classes offering the greatest increases in payload. The magnitude of impacts for turnpike doubles is mitigated, however, by the assumption that those vehicles would be limited primarily to the Interstate System and would have to assemble and disassemble for goods to get from origin to destination. Impacts estimated in the Western Uniformity Scenario are somewhat higher than estimated impacts in the 2000 CTSW Study because larger networks were assumed to be available to the larger vehicles.
Potential rail impacts estimated in studies by Martland are considerably higher than impacts estimated in the 2000 CTSW Study for several reasons. First, Martland's study examined only rail competitive traffic so the shifts to truck were higher on a percentage basis than shifts estimated in the 2000 CTSW Study which examined potential shifts for all rail traffic. Second, Martland did not consider the potential for railroads to reduce their rates to prevent diversion of traffic to the heavier trucks whereas the 2000 CTSW Study did assume that railroads would reduce rates. The actual extent to which railroads might reduce rates to maintain traffic would depend on factors unique to particular moves. The low estimates in the Western Uniformity Scenario analysis can be attributed in part to the study being regional in scope as opposed to local, and in part to the fact that larger vehicles already operate in many of the western States and thus the base case modal shares already reflect some competition with heavy trucks.
The credibility of modal shifts estimated in the studies reviewed above is difficult to determine. An important factor limiting the ability to assess the credibility of study findings is that there have been virtually no changes in federal or state truck size and weight limits over the last 30 years and thus observable modal shifts due to changes in truck size and weight limits are not available. This means there is little basis for calibrating estimates based on changes in transportation and logistics costs for the various modes to actual changes that have been observed in practice. Furthermore, reports available on most studies do not provide sufficient detail to adequately assess the credibility of findings. While major assumptions underlying each study generally are available, details concerning specific data sources often are not available, and these details could significantly affect study findings.
2.6 References - Modal Diversion
Abdelwahab, W. M., and M. Sargious. (1990), "Freight Rate Structure and Optimal Shipment Size in Freight Transportation". Logistics and Transportation Review, Vol. 26, No. 3, pp. 271-292.
Abdelwahab, W. M., and M. A. Sargious. (1991), "A Simultaneous Decision-Making Approach to Model the Demand for Freight Transportation," Canadian Journal of Civil Engineering, Vol. 18, No. 3, pp. 515-520.
Abdelwahab, W., and T. Sayed. (1999), "Freight Mode Choice Models Using Artificial Neural Networks," Civil Engineering and Environmental Systems, Vol. 16, No. 4, pp. 267-286.
Association of American Railroads, Freight Station Accounting Code Directory, American Railroads Building, Washington, DC, 20036.
Babcock, Michael W., et. al (2003)., "Economic Impacts Of Railroad Abandonment On Rural Kansas Communities," Kansas Department of Transportation, Topeka, ftp://ftp.mdt.mt.gov/research/LIBRARY/KS-03-4.PDF
Babcock, Michael W. (2007), "Energy Use and Pollutant Emissions Impacts of Shortline Railroad Abandonment," Research in Transportation Economics, Volume 20, Pages 225225tthttp://www.sciencedirect.com/science/article/pii/S0739885907200095
Battelle (2011), "FAF3 Freight Traffic Analysis," submitted to Oak Ridge National Laboratory, http://faf.ornl.gov/fafweb/Data/Freight_Traffic_Analysis/faf_fta.pdf
Baumol, W. J. and Vinod, H. D. (1970), "An Inventory Theoretic Model of Freight Transport Demand," Management Science, 16 (7), pp. 413-21.
Bienkowski, Bridget N. and Walton, C. Michael (2011), The Economic Efficiency Of Allowing Longer Combination Vehicles In Texas, Southwest Region University Transportation Center, Austin, TX, 2011 http://d2dtl5nnlpfr0r.cloudfront.net/swutc.tamu.edu/publications/technicalreports/476660-00077-1.pdf
Cambridge Systematics (2006), Minnesota Truck Size and Weight Project, Final Report, prepared for the Minnesota Department of Transportation, http://www.dot.state.mn.us/information/truckstudy/pdf/trucksizeweightreport.pdf
Cambridge Systematics (2009), Wisconsin Truck Size and Weight Study, Wisconsin Department of Transportation http://www.topslab.wisc.edu/workgroups/tsws/deliverables/FR1_WisDOT_TSWStudy_R1.pdf
Cambridge Systematics (2010), NCFRP 20: Developing Subnational Commodity Flow Data, Subtask Report: Review of Subnational Commodity Flow Data Development Efforts and National Freight-Related Data Sets, Washington, D.C., http://onlinepubs.trb.org/onlinepubs/ncfrp/ncfrp_rpt_026Dev.pdf
Carson, Jodi L. (2011), Directory of Significant Truck Size and Weight Research, National Cooperative Highway Research Program Project 20-07, Task 303, Washington, D.C. http://onlinepubs.trb.org/onlinepubs/nchrp/docs/NCHRP20-07(303)_FR.pdf
Cavalcante, R., and M. J. Roorda. (2010), "A Disaggregate Urban Shipment Size/Vehicle-Type Choice Model," Presented at 89th Annual Meeting of the Transportation Research Board, Washington, D.C.
Chiang, Y.S. and P.O. Roberts (1976), Representing Industry and Population Structure for Estimating Freight Flows, MIT Center for Transportation Studies CTS Report 76-8, Cambridge, Massachusetts, August 1976.
Chiang, Y. S. (1979), "A Policy Sensitive Model of Freight Demand," PhD Dissertation, Department of Civil Engineering, Massachusetts Institute of Technology, Cambridge, Massachusetts.
Comer, B., J. J. Corbett, J. S. Hawker, K. Korfmacher, E. E. Lee, C. Prokop, and J. J. Winebrake. (2010), "Marine Vessels as Substitutes for Heavy-Duty Trucks in Great Lakes Freight Transportation," Journal of the Air and Waste Management Association, Vol. 60, July, pp. 884-890.
Commonwealth of Virginia (2009), Feasibility Plan for Maximum Truck to Rail Diversion in Virginia's I-81 Corridor, http://www.drpt.virginia.gov/studies/files/Draft%20final%20report.pdf
ECONorthwest (2013), Highway Cost Allocation Study 2013-2015 Biennium, prepared for the Oregon Department of Administrative Services, http://www.oregon.gov/DAS/OEA/docs/highwaycost/2013report.pdf
Federal Highway Administration (1995), Comprehensive Truck Size and Weight Study, Summary Report for Phase I--Synthesis of Truck Size and Weight (TS&W) Studies and Issues, Washington, D.C., http://ntl.bts.gov/DOCS/cts.html
Federal Highway Administration (2015), "National Multimodal Freight Analysis Framework Research Workshop, Workshop Summary Report," Washington, D.C.
Federal Railroad Administration (2004), Study of the Benefits of Positive Train Control.
Federal Railroad Administration (2009), Preliminary National Rail Plan, Washington, D.C.
Friedlaender, A.F. and R.H. Spady (1977), Hedonic Rates and the Derived Demand for Freight Transportation, Center for Transportation Studies, Massachusetts Institute of Technology, Cambridge, MA.
Hall, R. (1985), "Dependence between Shipment Size and Mode in Freight Transportation," Transportation Science, Vol. 19, No. 4, pp. 436-444.
Holguín-Veras, J. (2002), "Revealed Preference Analysis of Commercial Vehicle Choice Process," Journal of Transportation Engineering, Vol. 128, No. 4, pp. 336-346.
Holguin-Veras et al. (2011), "An Experimental Economics Investigation of Shipper-Carrier Interactions on the Choice of Mode and Shipment. Size in Freight Transport," Networks and Spatial Economics, Vol. 11, No. 3
Littman, Todd (1999), "Transportation Elasticities: How Prices and Other Factors Affect Travel Behavior," Victoria Transport Policy Institute, March 31, 2008. Mr. Littman presents trucking elasticities in a table sourced from Small and Winston, Victoria Transport Policy Institute
Martland, Carl D. (2007), "Estimating the Competitive Effects of Larger Trucks on Rail Freight Traffic," http://www.minnesotarailroads.com/News/Short_Line_Diversion_Report.pdf
Martland, Carl D. (2010), "Estimating the Competitive Effects of Larger Trucks on Rail Freight Traffic."
McCullough, Gerard (2013), Long-Run Diversion Effects of Changes in Truck Size and Weight (TS&W) Restrictions: An Update of the 1980 Friedlaender Spady Analysis, University of Minnesota, http://ageconsearch.umn.edu/bitstream/148023/2/TSW%20AAR_Diversion_05092013.pdf
McFadden, D., C. Winston, and A. Boersch-Supan. (1986), "Joint Estimation of Freight Transportation Decisions under Non-Random Sampling," Discussion paper, Harvard University.
Middendorf, David P. and Bronzini, Michael S. (1994), "The Productivity Effects of Truck Size and Weight Policies," Oak Ridge National Laboratory, http://ntl.bts.gov/DOCS/pets.html
Morris, Joseph, "Subsidies and External Costs in U.S. Surface Freight Transportation," Transportation Research Board, http://road-transport-technology.org/Proceedings/4%20-%20ISHVWD/Subsidies%20And%20External%20Costs%20In%20U.S.%20Surface%20Freight%20Transportation%20-%20Morris%20.pdf
Naleszkiewicz, K. and J. Tejeda (2010). "A Stochastic Discrete Mode Choice Model for Truck to Rail Diversion," http://www.arema.org/files/library/2010_Conference_Proceedings/A_Stochastic_Discrete_Mode_Choice_Modek_for_Truck_to_Rail_Diversion.pdf
National Surface Transportation Policy and Revenue Study Commission (2007), Commission Briefing Paper 4J-02 "Implications of Potential Revisions to Truck Size and Weight Standards." http://transportationfortomorrow.com/final_report/pdf/volume_3/technical_issue_papers/paper4j_02.pdf
Pickrell, D.H., and Lee, D.B. (1998) "Induced Demand for Truck Services from Relaxed Truck Size and Weight," Draft working paper prepared for the US Federal Highway Administration. http://ntl.bts.gov/lib/17000/17500/17592/PB2001102424.pdf
Roberts, Paul O., and J.R. Ginn (1971), Stockout Costs in Inventory Management, Harvard Business School Working Paper, 71-9, April, 1971.
Roberts, Paul O. (1975), Factors Influencing the Demand for Freight Transport, CTS Discussion Paper 8-75, MIT Center for Transportation Studies, Cambridge, Massachusetts, August 1975.
Roberts, Paul O., with Mark Terziev, James Kneafsey, Lawrence Wilson, Ralph Samuelson, Yu Sheng Chiang, and Christopher Deephouse (1976), Analysis of the Incremental Cost and Trade-Offs Between Energy Efficiency and Physical Distribution Effectiveness in Intercity Freight Markets, MIT Center for Transportation Studies, Report CTS 76-14, Cambridge, MA, November, 1976.
Roberts, P. O. with Tom Brigham, and Carol Miller (1977a), An Equilibrium Analysis of Selected Intercity Freight Markets: Truck with Double Trailers vs. TOFC Shuttle Trains, MIT Center for Transportation Studies Report CTS 77-25, Cambridge, MA, December, 1977.
Roberts, Paul O., Moshe Ben Akiva, M. Terziev, and Y.S. Chiang (1977b), Development of A Policy Sensitive Model For Forecasting Freight Demand, M.I.T. Center for Transportation Studies, CTS Report 77-11, Cambridge, MA, April 1977.
Roberts, P.O. and A.S. Lang (1978), The Tradeoffs Between Railroad Rates and Service Quality, M.I.T. Center for Transportation Studies, Report 78-12, May 1978.
Roberts, Paul O. (1981), The Translog Shipper Cost Model, MIT Center for Transportation Studies Report No. 81-1, developed under a U.S. Department of Transportation University Research Program contract, Cambridge Massachusetts, June, 1981.
Samuelson, R. D. (1977). Modeling the Freight Rate Structure. Center for Transportation Studies, Massachusetts Institute of Technology
Southworth, Frank, et al. (2010), "The Freight Analysis Framework, Version 3: Overview of the FAF3 National Freight Flow Tables," Oak Ridge National Laboratory prepared for the Federal Highway Administration, http://faf.ornl.gov/fafweb/Data/FAF3ODCMOverview.pdf
Stephens, Jerry, et al. (1996), Impact of Adopting Canadian Interprovincial and Canamax Limits on Vehicle Size and Weight on the Montana State Highway System, Department of Civil Engineering, Montana State University, Bozeman, http://www.mdt.mt.gov/other/research/external/docs/research_proj/canada_impact.pdf
Transportation Research Board (1990), Truck Weight Limits: Issues and Options, Special Report 225, Washington, D.C.
Transportation Research Board (1996), Paying Our Way, Estimating Marginal Social Costs of Surface Freight Transportation, Special Report 246, Washington, D.C., http://onlinepubs.trb.org/onlinepubs/sr/sr246.pdf
Transportation Research Board (2006), Circular E-ZPassC088, "Commodity Flow Survey Conference," Washington, D.C., http://onlinepubs.trb.org/onlinepubs/circulars/ec088.pdf
Transportation Research Board (2010), Review of Canadian Experience with the Regulation of Large Commercial Motor Vehicles, NCHRP Report 671, Washington, D.C., http://onlinepubs.trb.org/onlinepubs/nchrp/nchrp_rpt_671.pdf
Transportation Research Board (2015), "Impacts of Policy-Induced Freight Modal Shifts," National Cooperative Freight Research Program Project 44 (underway), Washington, D.C.
U.S. Department of Transportation (1995), Comprehensive Truck Size and Weight (TS&W) Study, Phase 1-Synthesis, The Effects of TS&W Regulations on Truck Travel and Mode Share, Working Paper 9.
U.S. Department of Transportation (1997), 1997 Federal Highway Cost Allocation Study, unpublished Appendix B, Highway Revenue Forecasting Model, p. B-42, Washington, D.C.
U.S. Department of Transportation (2000a), Addendum to the 1997 Federal Highway Cost Allocation Study, Final Report, Washington, D.C. https://www.fhwa.dot.gov/policy/hcas/addendum.htm
U.S. Department of Transportation (2000b), Comprehensive Truck Size and Weight Study, Washington, D.C. https://www.fhwa.dot.gov/reports/tswstudy/
U.S. Department of Transportation (2004), Western Uniformity Scenario Analysis, Washington, D.C. https://www.fhwa.dot.gov/policy/otps/truck/wusr/wusr.pdf
Virginia Department of Transportation, I-81 Corridor Improvement Study, Freight Diversion and Forecast Report, Tier 1 Environmental Impact Statement http://www.virginiadot.org/projects/resources/freight.pdf
Winebrake, J. J., E. H. Green, B. Comer, J. J. Corbett, and S. Froman. (2012). "Estimating the Direct Rebound Effect for On-Road Freight Transportation." Energy Policy, Vol. 48, Sept., pp. 252-259
Winston, Clifford (1978), Mode Choice in Freight Transportation, Department of Economics, University of California, Berkeley, CA.
Wolfe, K. Eric and W.P. Linde (1997), The Carload Waybill Statistics: Usefulness for Economic Analysis, Journal of the Transportation Research Forum, Volume 36, No. 2, 1997, pp. 26 - 41.
CHAPTER 3 - Energy and Environment
In 2007, heavy duty trucks (defined by EPA as on-highway vehicles with a GVW greater than 8,500 lb. and which are not Medium-Duty Passenger Vehicles) carried 71 percent of all freight moved in the U.S. by tonnage and 87 percent by value. Heavy-duty trucks are the largest source of Greenhouse Gases (GHG) in the transportation sector after light-duty vehicles and the total GHG emissions from this sector increased over 72 percent from 1990 to 2008.
Current diesel engines are 35-38 percent efficient over a range of operating conditions with peak efficiency levels between 40 and 45 percent depending on engine sizes and applications, while gasoline engines are approximately 30 percent efficient overall. This means that approximately one-third of the fuel's chemical energy is converted to useful work and two-thirds is lost to friction, gas exchange, and waste heat in the coolant and exhaust. Trucks use this work delivered by the engine to overcome overall vehicle-related losses such as aerodynamic drag, tire rolling resistance, friction in the vehicle driveline, and to provide auxiliary power for components such as air conditioning and lights. Lastly, the vehicle's operation, such as vehicle speed and idle time, affects the amount of total energy required to complete its activity.
3.1 State-of-the-Practice in Modeling Heavy Truck Fuel Consumption
Energy consumption and emissions of air pollutants have been considered in many previous truck size and weight studies at both the federal and state levels. A working paper prepared in connection with the 2000 CTSW Study highlighted the key issues surrounding truck size and weight policy and energy consumption, summarized studies conducted through 1994, and identified gaps in the literature that needed further research (Battelle 1995). Among those research needs were impacts of larger, heavier vehicles on fuel efficiency; impacts of new types of tires on fuel consumption; intermodal tradeoffs between trucks, rail, and other modes; and the impacts of environmental regulations on fuel consumption.
Battelle identified several aspects of truck size and weight regulation that could affect fuel consumption including:
- Vehicle weight - research to date had estimated a 50% increase in gross vehicle weight would lead to a much lower increase in fuel consumption,
- Vehicle dimensions - a "factor contributing to fuel consumption is the aerodynamic drag from longer or multiple trailers that might be used under increased TS&W limits. No studies have attempted to quantify what effect, if any, increased truck lengths would have on energy consumption. The Transportation Research Board's (TRB) analysis of Twin Trailer Trucks (TRB, 1986) indicated twin trailer combinations encounter greater air resistance than tractor-semitrailers and are less able to sustain high speeds.",
- Intermodalism - "recent studies have looked at the energy conservation impacts of intermodal freight transport. These studies all tend to support the position that direct comparisons should be made between truck and rail energy consumption, looking at specific commodity types and routes, rather than more generic application of industry wide energy efficiencies. Ton-miles of freight is probably the best measure for energy comparisons, provided that ton-miles are applied to specific commodities that travel by both modes. A commodity and route-specific application of a ton-mile measure recognizes differences between the modes."
- Tires - "increased use of double and triple trailer configurations can contribute to increased irregular tire wear. This can occur due to excessive movement on dolly axles (Heavy Duty Trucking, Feb. 1992, pp 68). Irregularly worn tires can increase friction and resistance, creating more load on the engine. The impact of worn tires has not been discussed in the literature, but it may be as significant as the improvements new tire technologies provide. Similarly, the effects of tire and axle loads on energy conservation have not been researched. To the extent these increase resistance and exacerbate load on the engine, fuel efficiency will be reduced."
The USDOT's 2000 CTSW Study used fuel consumption and emissions factors derived for the 1997 Federal Highway Cost Allocation Study (USDOT 1997) to estimate impacts of truck size and weight scenarios on energy and emissions. That research addressed the first of the research needs identified in the working paper by using then state-of-the-art models that included gross vehicle weight, tire rolling resistance, aerodynamic drag, speed, grades, and drive train efficiency among the factors used to estimate vehicle fuel consumption. Fuel consumption modeling, however, was limited to the truck tractor and did not consider rolling resistance and aerodynamic drag associated with trailers.
The USDOT's Addendum to the Federal Highway Cost Allocation Study (2000) included estimates of air pollution-related costs associated with motor vehicle travel. Pollutants analyzed in the study included particulates, sulfur dioxide, nitrous oxides, volatile organic compounds, carbon monoxide, and lead. Cost estimates were developed in cooperation with EPA and relied on EPA air quality models that take into account all sources of air pollution and the transport of pollutants within and between air sheds. EPA models did not break out various classes of heavy trucks, so findings could not be used directly for the current study, but they do demonstrate the complexity of translating emissions of various pollutants into economic costs. The study notes,
Air pollution costs attributable to motor vehicles were estimated by comparing levels of air pollution when all sources of pollution were present with air pollution when motor vehicle emissions were eliminated. Costs attributable to rural motor vehicle travel were estimated by eliminating all urban motor vehicle travel, and urban costs were estimated by eliminating rural travel. These methods were necessary to eliminate interactions between emissions in rural and urban areas that would make it impossible to estimate whether there are significant differences in costs associated with travel in rural and urban areas.
About two-thirds of motor vehicle-related air pollution costs are attributable to urban travel and one-third to rural travel.. the sum of these costs for urban and rural travel individually is slightly greater than costs for all motor vehicle travel. This is explained by regional transport of both precursor emissions and air pollutants and the complex chemistry leading to the production of ozone and particulate matter.
Except for PM10 and PM2.5, automobiles account for the largest share of various motor vehicle emissions. Because of the complex chemical processes by which emissions are transformed into particulate matter, ozone, and other secondary pollutants, and variations in the transport of pollutants in different regions of the country, relative emissions attributable to different vehicle classes cannot be directly translated into relative air pollution costs without detailed air quality modeling that was beyond the scope of this project. For instance, while heavy trucks account for a large share of particulate emissions, they account for a smaller share of costs because significant portions of particulate matter are formed through chemical reactions involving other compounds emitted predominantly by light trucks and passenger vehicles.
This study represented one of the most detailed assessments of the nationwide air pollution costs associated with highway vehicles. The level of detail in this study is beyond the scope of most truck size and weight policy studies including the current study, but it highlights the fact that the full impact of changes in emissions cannot be assessed just by measuring emission levels themselves.
Carson (2011) recently summarized literature related to truck size and weight research, including impacts on fuel consumption and the environment. Her general findings were:
- "The impacts of increased truck size and weight limits on the environment are typically characterized in terms of energy consumption, harmful emissions, and noise levels.
- Estimates are often derived from anticipated reductions in heavy truck VMT and do not directly differentiate between truck configurations or size and weight classes.
- With some consistency, fuel consumption is estimated to decrease with increased truck size and weight limits, attributable to anticipated reductions in heavy truck VMT.
- Harmful emissions impacts are largely inestimable for specific truck configurations or size and weight classes using contemporary models with the exception of CO2-CO2 production is directly proportional to diesel fuel use. As such, CO2 production is also consistently estimated to decrease with increased truck size and weight limits, attributable to anticipated reductions in heavy truck VMT."
Scora, et al. (2010) modeled the impact of vehicle weight, speed, road grade, and roadway facility type using an emissions model they developed. On-road heavy-duty truck data for a variety of driving conditions was collected using a state-of-the-art mobile emission laboratory. A modal emission model for heavy duty diesel trucks was used to analyze the data. The authors found, "The optimal driving speed at which CO2 emissions are minimized increases with increasing vehicle weight. For the modeled vehicle, the speed at which CO2 emissions are minimized is close to 23 mph when there is no additional trailer weight and approaches 45 mph with a large trailer weight of 64,000 pounds." While vehicle weights were varied in the study, alternative vehicle configurations were not examined.
Woodrooffe et al. (2010) reported on a study for the Joint Transport Research Centre of the Organisation for Economic Co-operation and Development and the International Transport Forum that benchmarked the safety and productivity of typical highway transport trucks from various countries. Among the metrics considered were fuel economy and CO2 emissions. The energy and emission analysis included simplifying assumptions that vehicles travel at a constant speed of 90 km/h on level ground in calm wind conditions. Only two variables are considered, tire rolling resistance and overall vehicle aerodynamic drag. The power required to overcome aerodynamic drag and tire rolling resistance can be expressed as follows:
P=( FR + FA) * v = (CR * m * g + ½ * p * CD * A * vx2 ) * v
where
P = power required to overcome the resistive forces (expressed
as watts),
FR = tire rolling resistive force,
FA = aerodynamic resistive force,
CR = tire rolling resistance coefficient,
CD = aerodynamic drag coefficient,
A = frontal area of the vehicle,
v = velocity of the vehicle,
p = air density,
m = mass, and
g = gravity
Different values for tire rolling resistance were used for standard dual-tire axles and wide-based single tires. A further simplifying assumption was made that the aerodynamic drag coefficient was the same for each vehicle configuration, regardless of the trailer length or number of trailers.
The amount of CO2 produced per kWh was estimated as follows:
- Amount of diesel fuel consumed for truck applications is approximately 200 g/kWh (assuming 50% efficiency).
- The mass of diesel fuel is approximately 850 g/L.
- CO2 emissions produced by diesel fuel are 2.668 kg/L.
- Therefore, the amount of CO2 produced per kilowatt-hour is 0.628 kg
Woodrooffe concluded, "For the vehicles examined in this study, using fuel efficiency and CO2 produced relative to the product of cargo mass and volume was found to be the performance measure most effective at differentiating vehicle efficiency performance."
In as study for Wisconsin, Cambridge Systematics (2009) estimated potential fuel and emissions reductions associated with the use of 6 different vehicle configurations including 3 heavier tractor-semitrailers, a heavy straight truck, a heavier straight truck-trailer combination, and a heavy double trailer combination. The greatest reduction in fuel consumption and emissions was associated with a 6-axle tractor-semitrailer with a maximum gross vehicle weight of 98,000 pounds.
In a presentation to the 2009 Asilomar Conference on Transportation and Energy, Winebrake compared the energy efficiency of different modes of transportation. He noted that, "We can solve a large part of the energy and environmental problems of freight transportation by moving goods off trucks and onto trains and ships." He demonstrated the savings possible through the use of rail and ships in different corridors based on an analysis conducted using the Geospatial Intermodal Freight Transportation (GIFT) model developed jointly by Rochester Institute of Technology and the University of Delaware. Winebrake indicated that the potential for mode shifting was a function of, among other things,
- The compatibility of the cargo to transportation by alternative modes,
- The feasibility of using alternative modes based upon the availability of required infrastructure, and
- The practicality of using alternative modes based on economic considerations.
He then identified a number of policy options for increasing the use of more energy-efficient modes including efficiency standards, taxes, subsidies, technology mandates, infrastructure investment, research and development, alternative low-carbon fuels, size and weight restrictions, and demand management.
Comer et al. (2012) used the same methodology to examine the tradeoffs associated with a shift from heavy-duty trucks to ships for freight transport in the Great Lakes region, with particular attention given to cross-border freight flows between the United States and Canada. The GIFT model includes "energy, environmental, economic, and speed attribute information (by mode) on each segment and node of the intermodal network. Attributes such as emissions of various pollutants (e.g., CO2, PM10, NOx, SOx, CO, and VOCs), energy consumption (e.g., Btu), time, and economics (US$) have been incorporated into GIFT through a custom emissions calculator and graphical user interface that allows for user-defined inputs to be entered into the model. Each segment of the network takes on calculated attribute values based on the characteristics of the transport mode, segment speed, and other factors. Moreover, transfers between modes (occurring at rail yards, ports, and other intermodal transfer facilities) accrue time, cost, and emissions "penalties" using a hub-and-spoke approach that links each mode's network to the facility hub through creation of "spokes." Once the network includes such attribute data, the analyst can solve the network transportation problem for different single objective functions, such as least time, least cost, and least emissions (or a weighted multi-objective function applying a combination of these attributes)." As in Winebrake (2009), a number of policy options are identified to make ships more competitive with truck and rail.
An important aspect of estimating the relative fuel consumption and environmental emissions of different modes is to determine the fuel consumption and environmental benefits of heavy-duty truck technologies through testing and analysis. Significant research has been conducted since the 2000 CTSW Study on heavy truck fuel efficiency, but most has not been in the context of truck size and weight analysis.
Several methods are available to assess fuel consumption and greenhouse gas emissions from trucks. Truck fleets today often use SAE J1321 test procedures to evaluate criteria pollutant emissions changes based on paired truck testing. Light-duty trucks are assessed using chassis dynamometer test procedures. Heavy-duty engines are evaluated with engine dynamometer test procedures. Most large truck manufacturers employ various computer simulation methods to estimate truck efficiency. Each method has advantages and disadvantages. The Greenhouse Gas Emissions Model (GEM) was developed by the U.S. Environmental Protection Agency (US EPA) as a means for determining compliance with the proposed GHG emissions and fuel consumption vehicle standards for Class 7 and 8 combination tractors and Class 2b-8 vocational vehicles developed by US EPA and NHTSA respectively (EPA 2010). As both agencies' proposed compliance tool, GEM was designed with the following modeling attributes:
- Capable of modeling a wide array of medium- and heavy-duty vehicles over different drive cycles;
- Contains open source code, providing transparency in the model's operation;
- Freely available and easy to use by any user with minimal or no prior experience;
- Contains both optional and preset elements; and
- Managed by the agencies for compliance purposes.
The design of GEM focuses on the application of technologies having the largest impact on reducing vehicle GHG emission reductions or fuel consumption in the 2014-2017 timeframe. For the given timeframe, the model would allow various inputs to characterize a vehicle's properties (e.g., weight, aerodynamics, and rolling resistance) and predict how the vehicle would behave when it to be operated over a particular driving cycle.
US EPA has validated GEM based on the chassis test results from "SmartWay"-certified tractors tested at the Southwest Research Institute. Since many aspects of one tractor configuration (such as the engine, transmission, axle configuration, tire sizes, and control systems) are similar to those used on a manufacturer's sister models, the validation work conducted on these vehicles is representative of the other Class 8 tractors.
The input values needed for the simulation model (e.g., drag coefficient, tire rolling resistance coefficients, tire/wheel weight reduction, vehicle speed limiter, aerodynamic drag, tire rolling, resistance coefficient inputs, and extended idle reduction technologies) are obtained as manufacturer testing or model default values. The tool also has a range for vehicle speed limiter and default extended idle reduction technology benefit variables.
After parameters are input to the graphical user interface, GEM predicts the individual and cycle weighted fuel consumption and CO2 emissions for three proposed test cycles - a Transient cycle, a 55 mph steady-state cruise cycle, and a 65 mph steady-state cruise cycle. The model can also be used to determine a level of technology necessary for a vehicle to meet a specified GHG standard and allows a manufacturer to estimate the benefits and costs of those changes to a particular vehicle for that level of GHG reductions.
While the GEM model can estimate fuel consumption based on detailed characteristics of a truck tractor, it does not estimate the effects on fuel consumption of trailer characteristics such as weight, aerodynamic drag, and the rolling resistance of tires. Bachman et al. (2005) cite a U.S. Department of Energy (DOE) report (DOE 2000) that indicates, "At a steady speed of 65 miles per hour on a flat road, aerodynamic drag and rolling resistance account for 21 percent and 13 percent, respectively, of the total energy used by a class 8 heavy-duty tractor." They note that "measurements of whole-vehicle emissions from class 8 tractor-trailers are not readily available because historically such measurements involve dynamometer testing in the laboratory, and dynamometers suitable for class 8 tractor trailers are rare." Bachman reports on a study of the emission benefits of improving trailer aerodynamics and reducing tire rolling resistance that was conducted in connection with EPA's SmartWay Transport Partnership. This partnership between shippers, transportation providers, such as truck fleets, and the US EPA is designed to encourage shippers and fleets to reduce air pollution and greenhouse gas emissions through lower fuel consumption. Installation of devices to reduce aerodynamic drag and use of super single tires to reduce rolling resistance were found to improve fuel economy of tractor-semitrailers by 18 percent at highway speeds and offered even greater improvements in a suburban driving cycle. A similar study in Austria found reductions in fuel consumption of 12 percent when vehicle aerodynamics were improved and low rolling resistant tires were used (Eichlseder 2011).
In addition to estimating the impacts of rolling resistance on fuel economy and CO2 emissions, Bachman also estimates impacts on NOx emissions. Particulate emissions are not measured because "PM is controlled by a more complex set of factors in addition to power output, including fuel composition, and transient engine properties, such as air/fuel ratio, oil leakage through piston rings, and exhaust gas temperature." The tests conducted as part of the study show that "components designed to reduce power load not only reduce power load and improve fuel economy, but they also reduce NOx emissions. In some cases, NOx reductions may be disproportionately greater than improvements in fuel economy, although this may be an artifact of the particular engine design that was tested. Additional testing of other engine designs is necessary to quantify the relation between NOx reduction and improvements in fuel economy." Thus relationships between NOx emissions and fuel economy are not as direct as relationships between CO2 emissions and fuel economy and more specialized equipment is required to measure NOx emissions associated with different operating characteristics.
A National Academy of Sciences study (NAS, 2010) found that the relationship between the percent improvement in fuel economy (FE) and the percent reduction in fuel consumption (FC) is nonlinear; e.g., a 10 percent increase in FE (miles per gallon) corresponds to a 9.1 percent decrease in FC, whereas a 100 percent increase in FE corresponds to a 50 percent decrease in FC. The study also found that Medium and Heavy Duty Vehicles (MHDVs) are designed as load-carrying vehicles, and consequently their most meaningful metric of fuel efficiency will be in relation to the work performed, such as fuel consumption per unit payload carried, which is load-specific fuel consumption (LSFC). Methods to increase payload may be combined with technology to reduce fuel consumption to improve LSFC. Therefore, the study recommended that regulators need to use a common procedure to develop baseline LSFC data for various applications, to determine if separate standards are required for different vehicles that have a common function.
Battelle (1995) summarizes findings on the relative fuel efficiency of truck and rail reported by Nix (1991). While these findings are quite dated, they nevertheless consistently show rail to be more fuel-efficient than trucking on a ton-mile basis.
An FRA study completed by ICF International in 2009 compares rail and truck fuel efficiency and concludes that rail is more fuel efficient (ICF 2009). This study is an update to a similar 1991 study to address the technological and operational improvements that have been realized between 1991 and 2009 for both rail and truck. The methodology used was the same as in the 1991 study so that the studies are comparable. The study evaluates and compares rail and truck fuel efficiency on corridors and for services in which both modes compete. An analysis of past and future trends is also provided in the study. Competitive movements are defined as those of the same commodity having the same (or proximate) origin and destination. The study does not compare economic efficiency of the modes, nor does it evaluate any individual criteria that influence mode choice.
Between 1990 and 2006 overall rail fuel efficiency had improved by about 21.5%, or about 1.2% per year. There have also been key developments in locomotive technology during the timeframe which include: adoption of electronic controls in all locomotive subsystems; continuing development of the diesel engine, including low-emissions models to meet US EPA Tier 2 requirements for emission standards; development of AC traction systems; locomotive truck and brake improvements; operator's cab improvements; development of 6,000 hp engines; and hybrid and Genset locomotives. In addition, there have been improvements to non-locomotive technology that can impact fuel efficiency including 286,000 lb. gross weight cars; lightweight car construction; electronically controlled pneumatic brakes; specialized car types; use of distributed power; reduction of rolling resistance through rail lubrication; steerable or radial trucks; and low friction bearings. Some of these developments result in benefits to fuel economy of rail.
Similarly, there have been improvements in the trucking industry that have resulted in increased fuel efficiency. These include tractor and trailer aerodynamic improvements, tare weight reduction, improvements in transmissions and lubricants, and idle reduction technology. Other factors that have improved fuel efficiency for trucks include operational changes such as speed reductions, fuel cost increase, and anti-idling policies.
Twenty three movements were selected and analyzed for the study. Of the 23 movements studied, double-stack trains accounted for 48% rail movements, dry van trailers accounted for 47% of the truck movements. A summary of the findings indicates that rail is more fuel efficient than truck on all 23 movements in terms of ton-miles per gallon. The rail fuel efficiency ranges from 156 to 412 ton-miles per gallon in the study. The truck fuel efficiency ranges from 68 to 133 ton-miles per gallon.
Ratios comparing the fuel efficiency by rail and by truck were calculated for the movements. The analysis shows that the rail-truck fuel efficiency ratio varied by rail equipment type with tank cars resulting in the highest ratio (5.3) and auto rack representing the lowest ratio (1.9). The study also found that truck drayage and intermodal terminal operations account for 7% to 27% of total fuel consumed by intermodal trains. Empty mileage was also taken into consideration in this study. The study concludes that when empty miles are considered, all intermodal movements (double-stack and TOFC) and gondola movements are even more fuel efficient than comparable truck movements. For box cars and covered hoppers, rail is still more fuel efficient than trucks, but the gap between the two modes narrows when including empty miles.
In comparison with the results from the 1991 study, overall, double-stack trains appear to have become more fuel efficient. On the other hand, dry vans and container on chassis are somewhat less fuel efficient now than in the 1991 study, which may be explained by the more realistic representation of truck movements in the 2009 study. These factors can explain the increase in rail-truck fuel efficiency ratios for commodities moved in double-stack trains.
The following criteria were used to identify the competitive movements used in the study analysis:
- Movements that had comparable rail and truck mode shares
- Movements that were representative in terms of freight activity (measured in ton-miles)
- A mix of short, medium and long distance movements
- A mix of different commodities (and thus different equipment types)
- A mix of geographic regions.
The evaluation measures and compares fuel efficiency in ton-miles per gallon and also uses a rail-truck efficiency ratio, which is a ratio between rail and truck fuel efficiency as measured in ton-miles per gallon. The calculation of line-haul fuel consumption considers factors including distance, circuitry, grade profile, speed profile, vehicle characteristics, vehicle weight, and vehicle aerodynamic profile. Rail fuel efficiency also considers short branchline movements. Truck idling was factored into the truck fuel efficiency calculations.
Rail fuel consumption was calculated by two participating railroads using in-house train simulators. Fuel consumption from other movements such as drayage, were added separately. Truck fuel consumption was estimated using the MOVES/PERE model designed by the US EPA and fuel consumption from idling was added in separately.
As noted above, the US EPA is part of a SmartWay Transport Partnership whose goal is to encourage shippers and fleets to reduce air pollution and greenhouse gas emissions through lower fuel consumption. One strategy that is part of the SmartWay program is the use of longer combination vehicles. The US EPA says that, "LCVs are more fuel-efficient, on a ton-mile basis, than typical combination trucks. For example, a Rocky Mountain Double consumes 13 percent less fuel per ton-mile of freight, compared to a typical combination truck. This saves over $8,000 in fuel costs per year. Turnpike Doubles and Triples reduce fuel use per ton-mile by 21 percent, saving over $13,000 in annual fuel costs (Smartway Transport Partnership)."
The Northeast States Center for a Clean Air Future sponsored a study titled, "Reducing Heavy-Duty Long Haul Combination Truck Fuel Consumption and CO2 Emissions," (NESCCAF, 2009) that examined available and emerging technologies that could be used to reduce CO2 emissions and lower fuel consumption from new heavy-duty long haul combination trucks in the United States in the 2012 to 2017 timeframe. The core of the analysis consisted of a series of modeled simulations to predict the fuel saved by incorporating various combinations of technology and operational measures in new trucks. Vehicle and engine simulation modeling provided detailed information on the acceleration, braking, power, fuel economy, and emissions performance of different heavy-duty vehicle designs, including advanced powertrain designs. A baseline vehicle was specified that had engine, driveline, rolling resistance and aerodynamic characteristics typical of new vehicles at the time. Two simulation models were used to allow the evaluation of various packages of technology and operational measures: GT-POWER for engine cycle simulation and RAPTOR to model the vehicle, including the transmission and driveline. Both models were validated by comparing predicted fuel economy results to actual on-road vehicle fuel economy measurements, or to test cell engine fuel consumption results. The research team believed it was important to measure packages of improvements rather than individual improvements to avoid the possibility of double-counting benefits when assessing multiple options.
The test cycle used in this study was based on the California Heavy-Duty Diesel Truck Drive Cycle. Modifications were made to the California Cycle to make it more representative of nationwide long-haul trucking operations. Specifically, the portion of the cycle involving high-speed driving was increased, the average speed was increased by 8 percent, and two segments of both positive and negative grades were added. Because of these changes, results of the study may not be applicable to short-haul trucking operations.
In addition to a broad variety of technology measures, the study examined fuel consumption and emissions for alternative vehicle configurations as follows:
- Baseline 5-axle tractor-53-foot semitrailer combination with a maximum weight of 80,000 pounds
- 6-axle tractor-53-foot semitrailer combination with a maximum weight of 97,000 pounds
- Twin 28-foot trailer combination with a maximum weight of 80,000 pounds
- Twin 33-foot trailer combination with a maximum weight of 97,000 pounds
- Rocky Mountain Double combination with a maximum weight of 120,000 pounds
- Triple 28-foot trailer combination with a maximum weight of 120,000 pounds, and
- Turnpike Double combination with a maximum weight of 137,000 pounds
Noteworthy in this analysis is the fact that modeling applied to the entire vehicle combination, not just to the engine or truck tractor as in most other studies. The NESCCAF study recognized that operations of the heavier configurations with the same engine as was used on the base vehicle would degrade hill-climbing and acceleration performance. Engines with greater horsepower were tested with some of those configurations. While the more powerful engines increased fuel consumption relative to the base engine by from 4 to 7 percent, the fuel and emissions savings associated with the larger, heavier configurations were still substantial when compared to the baseline vehicle.
3.2 Data Requirements and Sources for Energy and Environmental Analysis
As with modal shift analyses, data requirements to estimate energy consumption and environmental emissions associated with truck size and weight policy changes may vary according to the study scope, objectives and resources. The basic data needed may include the distance assumed to be traveled by the base case and scenario vehicles; characteristics of the highways on which the trucks are operating; and characteristics of the vehicles that affect energy consumption and emissions.
Most past studies of energy and environmental impacts associated with freight transportation have not attempted to estimate the net effects of truck size and weight policy scenarios, taking into account changes in VMT and related fuel consumption and emissions associated with different vehicle classes operating at different weights. Many have simply compared the relative energy consumption of different vehicle configurations and modes assuming single average fuel consumption and emissions levels per unit of travel. Metrics used in those studies often are gallons consumed or grams emitted per ton-mile of travel. More detailed studies such as the NESCCAF study have used specific drive cycles to more fully represent the range of highway conditions that vehicles of interest are operated under, while other studies have simply assumed an arbitrary travel distance without varying the operating environment. The 2000 CTSW Study estimated the changes in VMT for various truck configurations by highway functional class and, based on characteristics of each functional class, estimated fuel consumption and emissions for each functional class. The primary source of information on characteristics of highway functional classes is the Highway Performance Monitoring System database maintained by FHWA based on information supplied by the States. For that study broad averages of characteristics such as grade and traffic characteristics were used as the basis for estimating fuel consumption and emissions.
Vehicle characteristics needed to estimate fuel consumption and emissions also vary according to the objectives and resources available for the study. The most common vehicle characteristic in past truck size and weight studies has been vehicle weight, but increasingly studies are also considering tire rolling resistance and aerodynamic drag in estimates of vehicle fuel economy and emissions. Most of those studies have limited themselves to characteristics of the truck tractor, not the entire vehicle combination. The most sophisticated studies, as reflected by the NESCCAF study, have used models that can account not only for characteristics of the truck tractor, but also the truck trailer(s). Again, most of those studies have not been conducted within the context of truck size and weight policy analysis, but the methods lend themselves to more robust estimates of fuel consumption and energy impacts associated with potential changes in truck size and weight limits.
3.3 Future Research Needs Related to Energy and Environmental Impacts of Truck Size and Weight Policy Options
Significant progress has been made in closing research gaps identified related to energy impacts identified above by Battelle in a working paper prepared for the 2000 CTSW Study (Battelle 1995). Understanding of the effects of tire rolling resistance, aerodynamic drag, and different engines on fuel consumption and CO2 emissions has improved dramatically as illustrated by recent work by the NESCCAF (2009). Estimating NOx and particulate emissions is still more difficult than estimating CO2 emissions, but recent regulations to reduce levels of those two pollutants have reduced the severity of environmental problems associated with those pollutants. The ability of compare fuel consumption and emissions of alternative modes has also been significantly improved with studies such as Winebrake (2009) and Comer (2010). Further work remains to reflect findings of these simulation studies into nationwide truck size and weight policy models and databases, but many of the research gaps are being closed.
3.4 Comparison of Findings from Past Energy and Environment Studies
As noted above, many of the studies that have estimated truck fuel consumption and environmental emissions have not been conducted within the broader context of truck size and weight policy analysis and thus have limited information about the net effect of changes in truck size and weight limits taking into account changes in VMT for different vehicle classes and weight groups. Many studies have compared the overall fuel efficiency and emissions of different truck configurations compared to rail and water. Those studies have uniformly found that truck and marine modes are more fuel efficient than trucking. Some studies such as Winebrake (2009) and Comer (2010) have examined fuel consumption and emissions in actual travel corridors where the availability of rail and water may be limited and a combination of trucking and rail or water modes is required. Drayage by truck to and from rail/water facilities reduces the energy and environmental advantage of those modes.
Comparing findings from past studies that have such different purposes and use different metrics is difficult. Table 5 below shows results from three past studies that have analyzed fuel consumption or emissions for different vehicle configurations. The 2000 CTSW Study analyzed changes in fuel consumption associated with several policy scenarios and reflects net fuel savings taking into account the fuel efficiency of the scenario vehicles and changes in VMT for each vehicle class. Savings ranged from six percent for scenarios involving 6-axle tractor-semitrailers and twin 33-foot trailers to 13 percent and 14 percent for scenarios involving triples and turnpike doubles respectively. It must be noted that triples were assumed to have broad access to origins and destinations. The Northeast States Center for a Clean Air Future study compared the relative fuel efficiencies of different truck configurations to a standard 5-axle tractor-semitrailer. Fuel consumption for each vehicle was estimated for the same drive cycle and results were evaluated in terms of fuel required to haul the same quantity of freight the same distance for each vehicle class. The Wisconsin study is similar to the 2000 CTSW Study in that net fuel savings resulting from shifts of some freight to various scenario vehicles are estimated. Only the aggregate savings are reported so percentage changes in fuel consumption are not available. The greatest savings were estimated for the introduction of a 6-axle tractor-semitrailer with a gross vehicle weight of 98,000 pounds. Much lesser savings were estimated for a heavy single unit truck or a heavy truck-trailer combination.
| Study | Vehicles and Weights Analyzed k = thousands of pounds | Change in truck VMT (percent) | Change in fuel consumption |
|---|---|---|---|
| USDOT, Comprehensive Truck Size and Weight Study (2000) | 3S3-90k; Twin 33s-124k 3S3-97k; Twin 33s-131k RMD-120k; TPD-148k*; Triple-132k |
(11) (11) (23) (20) |
(6%)* (6%)* (14%)* (13%)* |
| USDOT, Western Uniformity Scenario Analysis (2004) | RMD-129k; TPD-129K*;Triple-110k* | (25) | (12.1) |
| Northeast States Center for a Clean Air Future (NESCCAF 2009) | 3S3-97k Twin 33s-97k RMD-120k Triples-120k Turnpike Doubles-137k |
NA | (5%)** (10%)** (21%)** (17%)** (25%)** |
| Wisconsin Truck Size and Weight Study (2009) | Twin 28s-108k 3S4-97k SU7-80k 3S3-90k 3S3-98k SU4-2-98K |
240,000 gallons 540,000 gallons 40,000 gallons 450,000 gallons 1,420,000 gallons 60,000 gallons |
TPD - Turnpike Double
SU - Single Unit Truck
* Change in scenario fuel consumption/CO2 emissions return to Footnote *
** Difference from base case 3S2 return to Footnote **
As noted above Comer, et al. (2010) conducted a corridor analysis comparing various indicators of modal performance for truck, rail, and ship. Table 6 presents some results from that analysis. Performance of the various modes differed significantly for the individual performance measures. The total distance traveled by truck and the total cost of the move was greater for trucks than for the other modes, but the total time to make the move was considerably less. Emissions of CO2 were greater for trucks, but emissions of NOx and PM10 were less than emissions for the other two modes. The authors point out that the relative results are corridor specific and cannot be generalized to other corridors. The ICF study for FRA bears this out as they found significant variations in fuel consumption by truck and rail depending on the type of equipment used, the commodity being hauled, and other factors (ICF 2009).
3.5 References for Energy and Environmental Impact Analysis
Babcock, Michael W. (2007), "Energy Use and Pollutant Emissions Impacts of Shortline Railroad Abandonment," Research in Transportation Economics, Volume 20, Pages 225-257 http://www.sciencedirect.com/science/article/pii/S0739885907200095
Bachman, L. Joseph, et al. (2005), "Effect of Single Wide Tires and Trailer Aerodynamics on Fuel Economy and NOx Emissions of Class 8 Line-Haul Tractor-Trailers," U.S. Environmental Protection Agency, Washington, D.C., http://www.epa.gov/smartway/documents/publications/sae-reports/effects-on-fuel-economy.pdf
Battelle (1995), "Comprehensive Truck Size and Weight (TS&W) Study Phase 1-Synthesis Energy Conservation and Truck Size and Weight Regulations," https://www.fhwa.dot.gov/reports/tswstudy/TSWwp12.pdf
Cambridge Systematics (2009), Wisconsin Truck Size and Weight Study, Wisconsin Department of Transportation http://www.topslab.wisc.edu/workgroups/tsws/deliverables/FR1_WisDOT_TSWStudy_R1.pdf
Carson, Jodi L. (2011), Directory of Significant Truck Size and Weight Research, National Cooperative Highway Research Program Project 20-07, Task 303, , Washington, D.C. http://onlinepubs.trb.org/onlinepubs/nchrp/docs/NCHRP20-07(303)_FR.pdf
Comer, B., J. J. Corbett, J. S. Hawker, K. Korfmacher, E. E. Lee, C. Prokop, and J. J. Winebrake. (2010), "Marine Vessels as Substitutes for Heavy-Duty Trucks in Great Lakes Freight Transportation," Journal of the Air and Waste Management Association, Vol. 60, July, pp. 884-890.
Eichlseder, Dr. Helmut (2011), "Evaluation of fuel efficiency improvements in the Heavy-Duty Vehicle (HDV) sector from improved trailer and tire designs by application of a new test procedure," Graz University of Technology, Graz Austria, http://www.theicct.org/sites/default/files/publications/Final_Report_ICCT_VDA_FINAL2.pdf
Forkenbrock, David J. (1999), "External Costs of Intercity Truck Freight Transportation," Transportation Research Part A 33 (1999) 505-526, http://citeseerx.ist.psu.edu/viewdoc/download?doi=10.1.1.145.3557&rep=rep1&type=pdf
ICF International (2009). Comparative Evaluation of Rail and Truck Fuel Efficiency on Competitive Corridors, Federal Railroad Administration, Washington, D.C., http://www.ontrackamerica.org/files/Comparative_Evaluation_Rail_Truck_Fuel_Efficiency.pdf
National Academy of Sciences (2010), Technologies and Approaches to Reducing the Fuel Consumption of Medium- and Heavy-Duty Vehicles , Washington, D.C., http://www.nap.edu/download.php?record_id=12845
Nix, Fred P. (1991), "Trucks and Energy Use: A Review of the Literature and the Data in Canada," prepared for the Ontario, Quebec, and Canadian Trucking Associations." http://trid.trb.org/view.aspx?id=357045
Northeast States Center for a Clean Air Future (NESCCAF 2009), "Reducing Heavy-Duty Long Haul Combination Truck Fuel Consumption and CO2 Emissions," http://www.nesccaf.org/documents/reducing-heavy-duty-long-haul-combination-truck-fuel-consumption-and-co2-emissions
Organization for Economic Cooperation and Development (2010), Moving Freight with Better Trucks, Paris, http://www.internationaltransportforum.org/jtrc/infrastructure/heavyveh/TrucksSum.pdf
Scora, George, Kanok Boriboonsomsin, and Matthew J. Barth (2010). Effects of Operational Variability on Heavy-Duty Truck Greenhouse Gas Emissions. Transportation Research Board 89th Annual Meeting. http://trid.trb.org/view.aspx?id=911323
SmartWay Transport Partnership , "Longer Combination Vehicles A Glance at Clean Freight Strategies," http://www.epa.gov/otaq/smartway/documents/partnership/trucks/partnership/techsheets-truck/EPA420F10-053.pdf
U.S. Department of Transportation (USDOT 2000), Addendum to the 1997 Federal Highway Cost Allocation Study, Washington, D.C., https://www.fhwa.dot.gov/policy/hcas/addendum.htm
U.S. Department of Energy (2000), Technology Roadmap for the 21st Century Truck Program: A Government-Industry Research Partnership, Report 21CT-001, Office of Heavy Vehicle Technologies.
U.S. Environmental Protection Agency (2010), Greenhouse Gas Emissions Model (GEM) User Guide, Washington, D.C., http://www.epa.gov/otaq/climate/regulations/420b10039.pdf
Winebrake, James (2009), "Improving the Energy Efficiency and Environmental Performance of Goods Movement," presentation to the 2009 Asilomar Conference on Transportation and Energy.
Woodrooffe, John et al., (2010), "Truck Productivity, Efficiency, Energy Use, and Carbon Dioxide Output, Benchmarking of International Performance," Transportation Research Record: Journal of the Transportation Research Board, No. 2162, Transportation Research Board of the National Academies, Washington, D.C.
CHAPTER 4 - Traffic Flow and Operations
Traffic operations are influenced by roadway and traffic conditions along with vehicle characteristics, including size and weight. Heavy vehicles, including trucks, are significantly larger than passenger vehicles and have greater impact on traffic flow and operations. A report prepared in conjunction with the USDOT 2000 CTSW Study identified the following issues as of particular interest to federal policy considerations: passenger car equivalencies, capacity, level of service, and traffic stream costs (Battelle 1995). Larger, heavier trucks could affect the following aspects of traffic operations - maintaining speed on grades; weaving, merging, and changing lanes; highway capacity and level of service; and maneuvering through signalized intersections.
The report notes that traffic engineers use the concept of passenger car equivalencies (PCE) of trucks for analysis and design relating to highway capacity and level of service. PCEs represent the number of passenger cars that would consume the same percentage of a highway's capacity as the truck(s) under consideration.
The Highway Capacity Manual (HCM) has long been an important reference for factors affecting highway capacity, level of service, and traffic operations. The latest version of that TRB report was published in 2010. Heavy vehicles are defined in the HCM as those having "more than four tires touching the pavement". Trucks, buses and recreational vehicles make up the three groups of heavy vehicles. Trucks vary and the operational characteristics depend on the weight of its load and the engine performance. Heavy vehicles adversely impact traffic in two ways as explained in the HCM (Highway Capacity Manual 2010, Chapter 4):
- They are larger than passenger cars and occupy more roadway space; and
- They have poorer operating capabilities than passenger cars, particularly with respect to acceleration, deceleration, and the ability to maintain speed on upgrades.
According to the HCM, the second impact is more critical as the inability to keep pace with passenger vehicles can create large gaps that are not easily filled by passing maneuvers. Queues may also develop behind the heavy vehicle, especially on grades, resulting in roadway inefficiencies that are not easily overcome. When downgrades are steep enough to require operation in a low gear, heavy vehicles can impact downgrade movements as well, which also causes gaps and queues.
The HCM presents PCE values that vary as a function of road class, geometry, types of trucks, and percent trucks in the traffic stream. However, the values are not explicitly sensitive to parameters considered in TS&W investigations such as truck weight, length, and configuration.
The HCM identifies the methods for calculating traffic flow quality and accounts for heavy vehicles within the methodology for identifying Levels of Service (LOS). Other studies (Al-Kaisy, Hall and Reisman 2002, Benekohal and Zhao 2000) have addressed the issue of traffic flow and operation with respect to trucks including other truck size and weight studies.
Carson reviewed the literature on the effects of truck weights and dimensions on congestion, an important aspect of traffic operations (Carson 2011). She developed the following general conclusions based on that literature review:
- Increases in allowable truck size and weight could impact highway congestion through resultant changes in either truck volumes or highway capacity:
- Heavy truck VMT may either decrease as a result of increased truck capacity or increase in response to lower trucking transport costs.
- Larger, heavier trucks may be less maneuverable and have less horsepower in relation to their weight, effectively reducing highway capacity.
- With some consistency, increases in allowable truck size and weight were predicted to result in a modest degradation in traffic flow and associated capacity however, anticipated corresponding reductions in heavy truck VMT were predicted to offset these negative impacts in the broader context of highway congestion.
- Larger, heavier trucks would have inferior capabilities related to speed maintenance on upgrades; traction; and freeway merging, weaving, and lane changing and require increased intersection and passing sight distance.
- Prior studies have been criticized for oversimplifying the complex interactions between trucks and other vehicles in the traffic stream. Changing truck volumes, dimensions, and acceleration abilities will affect other vehicles' driving, acceleration, and braking patterns.
In a 1989 TRB report that examined the potential impacts of providing access for larger trucks a "modest degradation in traffic flow and associated capacity attributable to larger, heavier trucks" were anticipated (TRB 1989). Two vehicle characteristics were largely responsible for the adverse effects: "(1) higher average truck weights that may increase the vehicle weight-to-horsepower ratio, reducing speed and acceleration capabilities and (2) added truck length that challenges passing on two-lane roads and causes delays at intersections as trucks make turning maneuvers. The magnitude of these adverse impacts depends on the volume of larger, heavier trucks in the traffic stream."
TRB initiated a second comprehensive study that considered a series of specific truck configurations-each with lower axle weights but higher GVWs-intended for operation on Interstate and State highway systems (TRB 1990). Four prototype vehicle configurations were examined:
- 7-axle tractor-semitrailer with a 91,000-lb GVW limit and 60-ft length.
- 9-axle double trailer with a 114,000-lb GVW limit and 81-ft length (two 33-ft trailers).
- 9-axle B-train double with similar dimensions as above but with a different coupling arrangement between the two trailers.
- 11-axle double trailer with a 141,000-lb GVW limit
Table 7 summarizes potential impacts of these prototype configurations on various aspects of traffic operations
Carson summarizes findings from this TRB study as follows: "According to this study's results, Turner trucks would have inferior capabilities related to speed maintenance on upgrades; traction; and freeway merging, weaving, and lane changing. In addition, Turner trucks would require increased intersection sight distance for trucks to cross and turn at unsignalized intersections and yellow-phase duration in signal timing plans. Other vehicles attempting to pass Turner trucks on two-lane highways would require increased passing sight distance and would be subjected to an increased duration of splash and spray. Other operational characteristics-including freeway exiting maneuvers, downhill operations, the effectiveness of longitudinal barriers, truck blind spots, blockage of view, and aerodynamic buffeting-were predicted to be no different for Turner trucks than other truck configurations currently in use. This study also estimates that the predicted use of Turner trucks would reduce heavy truck VMT by 3.4 percent, potentially offsetting the negative impacts to traffic flow and operations."
Impacts on congestion were estimated in the Minnesota Truck Size and Weight Study (Cambridge Systematics 2006). That study used findings from the 1997 Federal Highway Cost Allocation Study on average added delay per 1,000 PCE VMT on various highway functional classes to estimate changes in delay associated with each truck size and weight scenario and multiplied changes in delay by the value of time to estimate changes in the congestion costs.
Congestion costs associated with the potential introduction of various vehicle configurations were also estimated in the Wisconsin truck size and weight study (Cambridge Systematics 2009). Changes in PCE VMT were estimated for each vehicle configuration and resulting changes in speed were estimated based on speed versus volume functions in the Highway Economic Requirements System model to estimate delay associated with changes in traffic volumes.
The USDOT 2000 CTSW Study analyzed the "passenger-car equivalents" for different truck lengths and weight-horsepower ratios. Table 8 and 9 illustrate the findings of this study separated by rural and urban highways.
In both rural and urban areas, vehicle length has only minor effects on PCEs. Steep grades have a dramatic impact on PCEs especially for vehicles with high weight to horsepower ratios that cannot maintain their speed on upgrades. Weight-to-horsepower ratios also affect operations in urban areas since vehicles that cannot accelerate quickly adversely affect traffic operations.
The 2000 CTSW Study summarized the effects of large truck characteristics on traffic flow and operations. Impacts on several aspects of traffic operations could not be quantified so estimated impacts were expressed in terms of the direction and magnitude of the impact without numerical estimates. Table 10 shows those estimated impacts from the 2000 CTSW Study.
E = Relatively large effect. e = relatively small effect. -- = no effect.
This table shows that in regards to traffic congestion, the speed of large trucks has a large effect compared with length and weight. Issues related to the length of the vehicle include low speed offtracking, passing, lane changing and intersection requirements. The greater the length of a vehicle, and associated wheel base distance, the more offtracking will occur. Vehicles with longer wheel bases must operate at slow speeds and may require crossing lane lines to negotiate sharp turns at intersections, resulting in traffic delay for other vehicles. Larger and heavier trucks require more time and space to make passing and lane change maneuvers, also resulting in traffic delay for other vehicles. Larger vehicles are slower to accelerate to their desired speeds than passenger cars, and require larger gaps in traffic flows in order to change lanes or merge with traffic.
In a study, sponsored by the Association of American Railroads, Roger Mingo used the FRESIM model to estimate PCEs for different types of truck configurations (Mingo 1994). Large numbers of FRESIM runs were made varying the traffic composition and percent trucks in the traffic stream. Regression analysis was used to estimate the relative effect of each vehicle type on traffic speeds simulated in FRESIM compared to the passenger vehicle. Results of the analysis are shown in Table 11. The PCEs for doubles and LCVs are higher than estimates developed for the 1997 Federal Highway Cost Allocation Study, but there is insufficient documentation to determine potential reasons for the differences.
The Western Uniformity Scenario Analysis was conducted as a follow-on to the USDOT's 2000 CTSW Study to analyze the impacts of lifting the LCV freeze and allowing consistent LCV weights, dimensions and routes among Western States that already allowed LCVs. Various impacts were considered as part of the study, including traffic flow and operations related to LCVs.
The study states that large trucks affect traffic flow due to their size, acceleration, and braking characteristics which can negatively affect the LOS. The study analyzed potential traffic operation impacts in the 13 western States included in the scenario analysis. Much of the same methodology used in the USDOT 2000 CTSW Study was used for the analysis in this report. Substantial improvements in data and some analytical methods had been realized between 2000 and 2004, so the improved information was used. The vehicles analyzed were a twin-trailer configuration with two 48-foot semitrailers and one with 45-foot trailer lengths. In the summary, however, only the impacts of the 48-foot configuration are reported. For the traffic operations analysis, the variables analyzed include traffic delay in million vehicle-hours, congestion costs, low-speed off-tracking, passing, acceleration, lane changing and intersection requirements.
Study assumptions affecting estimates of the impacts on traffic operations include limited networks for LCVs, no LCV operations in congested urban areas, and the use of more powerful tractors on LCVs to maintain typical weight/horsepower ratios. Another factor affecting estimates of traffic operations impacts is the fact that the western States included in the analysis are rural in character - neither California nor Texas which have large metro areas and heavy traffic volumes were included in the study. Taking into account the assumption that some freight will move to the more productive scenario trucks, the traffic operations will not degrade or for some variables may even improve with the Western Uniformity Scenario. It is important to note that the assumption that increased engine power is available for those configurations with increased gross vehicle rates was used. Table 12 below shows the traffic operation impact and the resulting change using the Western Uniformity Scenario.
| Impact | 2000 (base case) | 2010 (scenario) |
|---|---|---|
| Traffic Delay (million vehicle-hours) | National Total 3,599* | Small decrease |
| Congestion Costs ($ million) | National Total $67 billion*** | Small decrease |
| Low-Speed Off-tracking | Degradation (28-30 feet** for turnpike double versus 16 feet for semitrailer) | |
| Passing | Requires operating restrictions. | |
| Acceleration (merging and hill climbing) | Requires sufficient engine power. | |
| Lane Changing | Some degradation due to additional length. (This is counterbalanced by decrease in heavy truck VMT.) | |
| Intersection Requirements | Some degradation due to additional length. (This is counterbalanced by decrease in heavy truck VMT.) |
**28 feet off-tracking for twin 45-foot TPDs and 30 feet off-tracking for twin 48-foot TPDs. return to Footnote **
***Estimated for 75 largest urban areas. return to Footnote ***
Ingle documents the literature on PCEs dating back to the 1965 HCM (Ingle 2004). The scope of his research was to evaluate PCEs for basic freeway segments for trucks with a broader range of weight-to-power ratios. Such results should make freeway capacity analysis more accurate for mixed vehicle flow with a non-typical truck population. In addition, the effects of high proportions of trucks, pavement type and condition, truck aerodynamic treatment, number of freeway lanes, truck speed limit, and level of congestion were considered. The analysis was conducted using the INTEGRATION traffic simulation model.
Ingle developed the following conclusions based on the results of his research:
- A truck fleet with multiple weight-to-horsepower ratios performs about the same as the homogeneous fleet assumed in the HCM. However, weight-to-horsepower (wt/hp) ratio was found to significantly affect PCEs - the PCEs for an average weight-to-horsepower ratio of 112,5 lbs/hp are 22 percent less than the average wt/hp ratio while PCEs for a 175 lbs./hp ratio were 30 percent higher than for the average wt/hp ratio. Ingle notes that 175 lbs/hp represents the 85th percentile of trucks on I-81 in Virginia based on a survey of those vehicles.
- PCEs for grades longer than 1 mile remain relatively constant so no extension of the HCM values for grades longer than 1 mile is necessary
- PCEs vary up to the point where trucks make up 60 percent of the traffic stream, but after that point do not vary
- Pavement type and condition can significantly affect PCEs when trucks account for a small portion of the traffic stream, but there is no impact associated with pavement conditions with higher proportions of trucks
- PCEs for three-lane segments are lower than PCEs for two-lane segments when trucks are a small proportion of the traffic stream, but this effect is not found at higher truck percentages. Lane restrictions were not found to affect PCE values
- Setting truck speed limits below speed limits for passenger vehicles increases the PCE value for trucks.
Ingle develops extensions of the PCE values contained in the 2000 HCM to account for these findings.
Al-Kaisy examined factors that contribute to the effect of heavy vehicles on traffic operations and level of service (Al-Kaisy 2006). He notes that two factors are primarily responsible for the effects of heavy vehicles on traffic operations -- their dimensions and their performance. The influence of these factors differs depending on three conditions: terrain, saturated versus unsaturated traffic, and traffic levels for unsaturated conditions. On level terrain the influence of heavy trucks is mainly attributed to their dimensions, but in rolling and especially mountainous terrain the vehicle's performance becomes important. As traffic volumes rise, heavy vehicle performance becomes an increasingly important influence on traffic operations.
Al-Kaisy notes that there has been a long-standing debate about the definition of passenger car equivalency due in part to the loose treatment of the subject in different editions of the Highway Capacity Manual (HCM). The 1965 HCM defined equivalency as "the number of passenger cars displaced in the traffic flow by a truck or a bus, under the prevailing roadway and traffic conditions." Average speed was used as the criterion to derive PCE factors for freeways and multilane highways. The 2000 HCM defines PCE as "the number of passenger cars displaced by a single heavy vehicle of a particular type under specified roadway, traffic and control conditions."
Recent work has noted that PCEs may vary depending on the type of traffic impact being studied. Van Aerde and Yagar note that "passenger car equivalents have generally been assumed to be similar for capacity, speed, platooning, and other types of analysis. This notion appears to be incorrect and is perhaps one of the main sources of discrepancies among the various PCE studies." (Van Aerde 1984)
The synthesis of previous truck size and weight studies and issues conducted for the 2000 CTSW Study identified other issues related to traffic operations. Heavy trucks can affect traffic operations when merging, weaving and changing lanes. "TS&W considerations can have important effects on these maneuvers because of their effects on gap size requirements and acceleration performance. Little is known about the effects of different percentages of trucks with variable size and weight on the ability to merge and change lanes in traffic streams of varying speed and density." The report noted that "ramp junctions and weaving areas are so site-specific as to their geometric design and operating speeds that simulation of those specific intersections is probably the only analytical method that will give reasonable precision."
Truck operations can also affect traffic operations at intersections. Larger and/or heavier vehicles can affect traffic operations at intersections in many ways including: (1) requiring extra time to accelerate up to the posted speed limit; (2) altering sight lines; (3) increasing sight distance requirements; (4) altering signal timing requirements. Many of these traffic disruption effects can be mitigated with the use of powertrains that ensure acceleration performance equivalent to or better than current vehicles.
4.1 Data Requirements and Sources for Traffic Operations Analysis
Estimating impacts of truck size and weight policy options on traffic operations requires several sources of data. One important data element is an estimate of the passenger car equivalents of the vehicles to be analyzed. The HCM generally does not contain the level of detail required to differentiate impacts of the scenario vehicles, and since the scenario vehicles being analyzed typically are not in widespread use, it is difficult to estimate the PCEs empirically. Thus most recent studies have relied on the use of simulation models such as FRESIM to estimate PCEs for the vehicles in question. As noted above, PCEs vary according to many factors including grades, vehicle length, weight-to-horsepower ratios, percent trucks in the traffic stream, and levels of congestion. Past studies generally have used different values for some or all of these factors and have come up with somewhat different PCE values for the various vehicle configurations. Differences can also be attributed to the use of different traffic simulation models with different model assumptions.
Impacts of changes in the PCE VMT (PCE weighted VMT) on delay and congestion costs depend on highway characteristics for each highway class (distribution of numbers of lanes, grades, traffic volumes) and relationships between speeds and volumes for the different types of highway. Highway characteristics may come from a number of sources depending on the scope of the study, but in recent nationwide studies they have come from the Highway Performance Monitoring System maintained by FHWA based on data reported by the States. Speed-volume relationships for different types of highways typically come from the Highway Capacity Manual. In each version of the HCM, there typically are some adjustments to the speed-volume relationships based on more recent data and analytical techniques.
Estimates of changes in traffic volumes by vehicle class, operating weight, and highway class typically come from the mode shift analysis used in the particular study. Past studies have varied widely in the level of traffic detail used.
4.2 Future Research Needs Related to Traffic Operations Analysis
As noted above, many vehicle classes of widespread interest in truck size and weight policy studies are not in widespread use or are not used at all in the U.S. This makes it difficult to calibrate and validate traffic simulation models that have been used to date as a primary tool for estimating impacts of larger, heavier vehicles on traffic operations. Care must be taken when extrapolating results of studies in other countries to ensure that results are not applied to quite different operating environments that may exist in the U.S. Several traffic operations impacts have been only qualitatively assessed in past Federal studies. Research might be undertaken to validate those qualitative assessments through discussions with officials in States where larger vehicles currently are operating or some actual data collection. As with international studies, care must be taken to ensure that the operating environment is clearly related to any impacts that are observed.
4.3 Comparison of Findings from Past Traffic Operations Analyses
As with impacts of modal shifts, energy consumption and environmental emissions, it is difficult to directly compare past studies because the vehicle classes and operating contexts vary as well as the metrics used to express impacts. Table 13 compares changes in delay and congestion costs estimated in four past studies. The 2000 CTSW Study was the only study that expressed changes in percentage terms. The largest reduction in delay and congestion costs was for the triples scenario, but the magnitude of the reduction is largely due to a study assumption that triples would not be limited to a designated network of Interstate and other freeways but would be allowed to travel to origins and destinations. The study report recognizes that this degree of access would be unlikely in many parts of the country if triples were to become legal. The Western Uniformity Scenario Analysis did not quantify congestion impacts, but indicated that a slight decrease in congestion could be expected.
Two State studies estimated congestion cost savings associated with allowing various truck configurations to operate. Minnesota analyzed four different truck configurations, a 6-axle tractor semitrailer operating at 90,000 pounds, a 7-axle tractor-semitrailer with a maximum gross vehicle weight of 97,000 pounds, an 8-axle twin trailer combination with a gross vehicle weight of 108,000 pounds, and a 4-axle single unit truck with a maximum weight of 80,000 pounds. These vehicles were all assumed to meet Federal truck size and weight limits which meant that all but the heavy single unit truck were prohibited from operating on the Interstate System. Congestion cost reductions were greatest for the two tractor-semitrailer combinations followed by the twin trailer combination and the single unit truck.
Wisconsin analyzed six candidate truck configurations as shown in Table 13. Two scenarios were analyzed for each configuration, one which prohibited the scenario trucks from using the Interstate System and one in which they could operate on Interstate highways. In both cases the tractor-semitrailer combination with the greatest gross vehicle weight reduced congestion costs the most. As in Minnesota the single unit truck and truck trailer combination reduced congestion costs the least. Allowing the heavier vehicles to operate on the Interstate System was found to reduce total congestion costs significantly more than limiting vehicles to non-Interstate highways. Baseline congestion costs were not reported in the study so it was impossible to estimate the percentage reduction in congestion costs as was done in the 2000 CTSW Study.
4.4 References for Traffic Operations
Al-Kaisy, Hall and Reisman (2002), "Developing Passenger Car Equivalents for Heavy Vehicles on Freeways During Queue Discharge Flow," Transportation Research Part A.
Al-Kaisy, Ahmed (2006), "Passenger Car Equivalents for Heavy Vehicles at Freeways and Multilane Highways: Some Critical Issues," ITE Journal, March 2006, pp. 40-43.
Battelle (1995), Comprehensive Truck Size and Weight (TS&W) Study Phase 1-Synthesis, Traffic Operations and Truck Size and Weight Regulations, Working Paper 6, prepared for the Federal Highway Administration, Washington, D.C. https://www.fhwa.dot.gov/reports/tswstudy/TSWwp6.pdf
Benekohal and Zhao (2000), "Delay-Based Passenger Car Equivalents for Trucks at Signalized Intersections," Transportation Research Part A.
Cambridge Systematics (2006), Minnesota Truck Size and Weight Project, Final Report, prepared for the Minnesota Department of Transportation, http://www.dot.state.mn.us/information/truckstudy/pdf/trucksizeweightreport.pdf
Cambridge Systematics (2009), Wisconsin Truck Size and Weight Study, Wisconsin Department of Transportation http://www.topslab.wisc.edu/workgroups/tsws/deliverables/FR1_WisDOT_TSWStudy_R1.pdf
Carson, Jodi L. (2011), Directory of Significant Truck Size and Weight Research, National Cooperative Highway Research Program Project 20-07, Task 303, , Washington, D.C. http://onlinepubs.trb.org/onlinepubs/nchrp/docs/NCHRP20-07(303)_FR.pdf
Ingle, Anthony (2004), "Development of Passenger Car Equivalents for Basic Freeway Segments," Virginia Polytechnic Institute and State University, Blacksburg, Virginia. http://scholar.lib.vt.edu/theses/available/etd-07102004-112810/unrestricted/passenger_car_equivalents_ingle.pdf
Mingo, Roger D. P.E. and Leimin Zhuang (1994), "Passenger Car Equivalents of Larger Trucks, Derived from Use of FRESIM Model," prepared for the Association of American Railroads.
Transportation Research Board (1989) Providing Access for Large Trucks, Special Report 223, Washington, D.C., http://www.nap.edu/catalog/11351/providing-access-for-large-trucks-special-report-223
Transportation Research Board (1990) New Trucks for Greater Productivity and Less Road Wear: An Evaluation of the Turner Proposal Special Report 227, Washington, D.C. http://www.trb.org/Publications/Blurbs/152257.asp
Transportation Research Board (2010), Highway Capacity Manual, Washington, D.C. http://www.trb.org/Main/Blurbs/164718.aspx
Van Aerde, M. and S. Yagar (1984), "Capacity, Speed and Platooning Vehicle Equivalents for Two-Lane Rural Highways," Transportation Research Record No. 971.
You may need the Adobe® Reader® to view the PDFs on this page.
previous | next