3. DETROIT CASE STUDY
This section presents the results of a case study of PSEs in the Detroit metropolitan area. Detroit was selected as the case study representative of the Very Large city category and is in the northern region of the U.S.
In conducting the case study, an exhaustive search of national and
local data was conducted to identify venues where large events might
occur and also to search data by event type, such as professional and
college football, basketball, and other sports to identify event generators
in the case study area. This dual approach of compiling data by both
venue and event type was designed to maximize the coverage of events.
Venues and Event Types
The following specially designed facilities with event days drawing crowds of more than 10,000 people in the Detroit area were identified and contacted:
- Ford Field – maximum capacity 65,000
- The Palace of Auburn Hills – maximum capacity 22,076
- Joe Louis Arena – maximum capacity 19,988
- Comerica Park – maximum capacity 41,070
- Cobo Arena – maximum capacity 12,191
- Cobo Conference and Exposition Hall – maximum capacity not available
- Belle Isle Park – maximum capacity not available
- DTE Energy Music Theater – maximum capacity 15,274
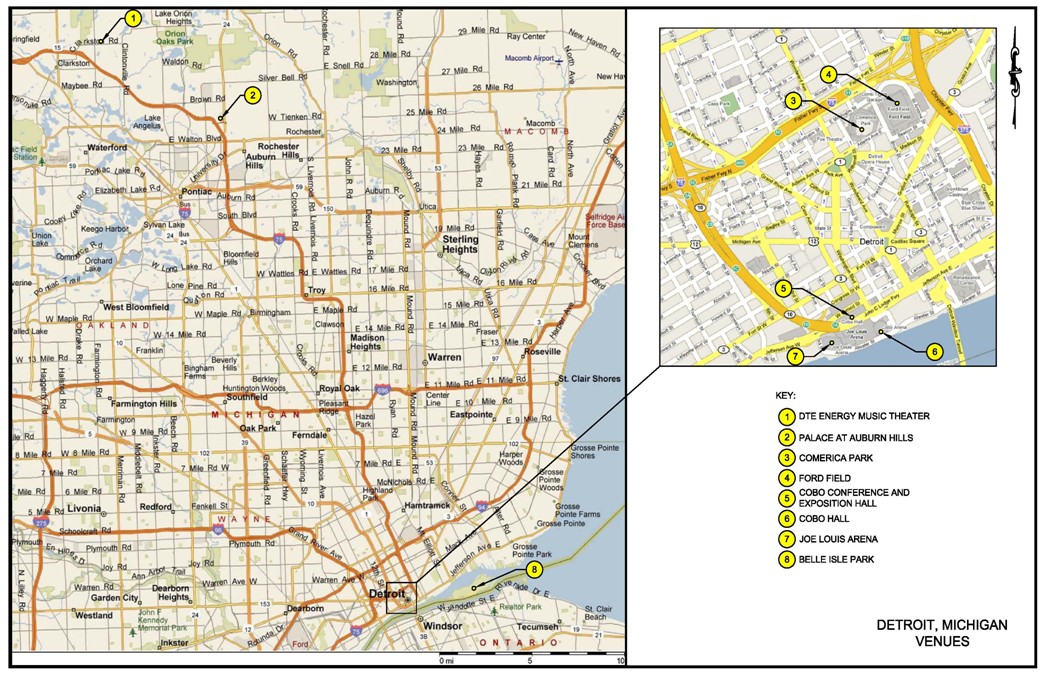
A map of these venues provided in Exhibit 3-1 shows that each is located within five miles of a major highway. All but two of the venues are located within five miles of the center of the city.
Exhibit 3-1: Map of Venues in Detroit that Host PSEs with More
Than 10,000 Attendees
Other event hosting facilities that were examined, but found not to host events with more than 10,000 people, are listed in Exhibit 3-2. While these facilities are not expected to host events that meet this study’s 10,000 attendance criterion, they are important to consider, especially in the context of simultaneous events and localized traffic management.
| Venue | Capacity |
|---|---|
| Bohemian National Home | 650 |
| Bonstelle Theatre | 2,500 |
| Detroit Opera House | 3,200 |
| Detroit Repertory Theatre | 5,700 |
| Detroit Science Center | 1,500 |
| Detroit Symphony Orchestra Hall | 2,000 |
| Fillmore Detroit | 2,220 |
| Fisher Theatre | 2,000 |
| Ford Community & Performing Arts Center | 1,200 |
| Fox Theatre | 5,000 |
| Gem Theatre | 450 |
| Greektown Casino | 1,500 |
| Harpos Concert Theatre | 2,000 |
| Hillberry Theatre | 4,050 |
| Magic Stick | 210 |
| The Majestic | 1,000 |
| Marquis Theatre | 500 |
| Masonic Temple | 4,400 |
| MGM Grand Casino | 1,200 |
| Moto City Casino | 1,200 |
| Music Hall Center for the Performing Arts | 1,700 |
| Compuware Sport Arena | 4,500 |
A major events calendar published by the GM Renaissance Center was used to estimate the number of street and park events.13 The major annual events listed in the event calendar are provided in Exhibit 3-3.
Exhibit 3-3: Calendar of Events in the Detroit Area
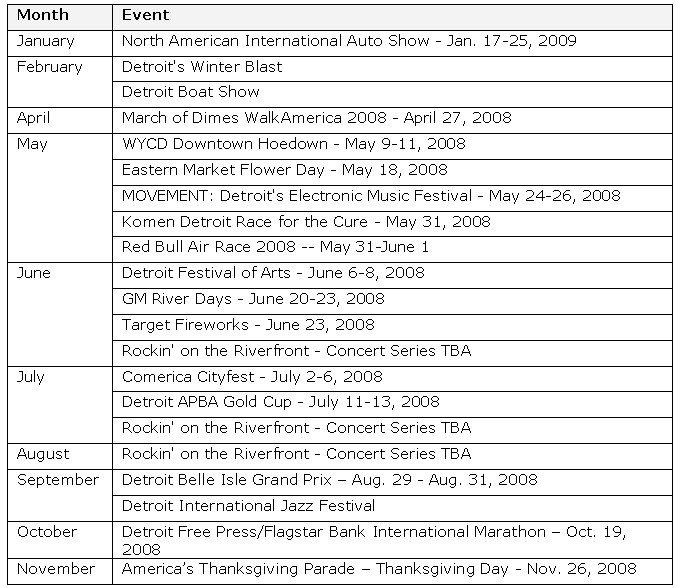
Source: GM Renaissance Center "Major Detroit Events and Festivals" http://www.gmrencen.com/Detroit/MajorEvents/tabid/99/Default.aspx.
Data Collection by Venue
The next few paragraphs provide a description of each of the PSE hosting venues in the city that draw crowds of more than 10,000 people. Information is provided on the size of the venues, the number and type of events that are hosted and the venue locations.
Ford Field
Ford Field is an indoor football stadium located in Detroit, Michigan that is the home of the Detroit Lions of the NFL. It is across the street from Comerica Park. Its regularly capacity is 65,000 seats, although it expands to 78,000 seats for basketball games. In addition to other events, Ford Field hosts 10 professional football games with an average attendance of 55,000.
The Palace of Auburn Hills
The Palace of Auburn Hills, often referred to simply as "The Palace," is a sports and entertainment venue in Auburn Hills, Michigan. Since opening in 1988, it has been the home of the Detroit Pistons of the NBA. Since 1998 it has also hosted the Detroit Shock of the WNBA. It also hosts an average of 40 concerts per year with more than 10,000 attendees, and 10 days of exhibitions and shows with more than 10,000 attendees.
Joe Louis Arena
Joe Louis Arena, nicknamed "The Joe" and "JLA," is a hockey arena. It is the home of a National Hockey League franchise, the Detroit Red Wings. It also hosts 90 concerts a year with more than 10,000 attendees per concert.
Comerica Park
Comerica Park, the baseball stadium located in downtown Detroit, replaced historic Tiger Stadium in 2000 and serves as the home of the Detroit Tigers of Major League Baseball's American League. Comerica Park is located across the street from Ford Field. The stadium hosts 81 regular season baseball games annually, each with an attendance of more than 10,000 people. Baseball games are the only major events hosted at the venue.
Cobo Arena
Cobo Arena is a 12,191-seat indoor arena adjacent to Cobo Conference and Exposition Hall. It is the home of the University of Detroit Mercy men's basketball team.
Cobo Conference and Exposition Hall
Cobo Conference and Exposition Hall, usually called Cobo Hall, is the convention center adjacent to Cobo Arena. Both Cobo Hall and Cobo Arena opened in 1960. Cobo Hall underwent a significant expansion in 1989 and presently holds 700,000 square feet (65,030 m²) of exhibition space. Each January, it hosts the North American International Auto Show or NAIAS, which draws about 56,000 people per day for 17 days.
Oakland Hills Country Club
Oakland Hills Country Club will host the 2008 PGA Championship. It is expected that the PGA Championship will draw about 40,000 people per day for four days during the tournament.
Belle Isle Park
Belle Isle is a 982 acre (2.42 square miles) island park in the Detroit River managed by the Detroit Recreation Department. It is connected to the rest of the city by the MacArthur Bridge and is the largest island park in the United States. In 1992, a temporary street race circuit was constructed on the isle for CART races. Belle Isle hosted ten events from 1992-2001, and racing resumed in 2007 as part of the IndyCar Series and American Le Mans Series.
DTE Energy Music Theatre
The DTE Energy Music Theatre is a 15,274-seat amphitheater located in Clarkston, Michigan. The amphitheater hosts approximately 45 concerts per year.
Data Collection by Activity
The next few paragraphs describe information relevant to Detroit for each of the PSE event types.
Professional Sports
Detroit is one of 13 American metropolitan areas that are home to professional teams representing all of the four major sports in North America. All of Detroit 's teams play within the city of Detroit itself except for the NBA's Detroit Pistons and the WNBA's Detroit Shock. Both of these basketball teams play in Auburn Hills, a suburb of Detroit. The three active major sports venues within the city are: Comerica Park (home of the MLB's Detroit Tigers), Ford Field (home of the NFL's Detroit Lions), and Joe Louis Arena (home of the NHL's Detroit Red Wings).
College Sports
In college sports, Detroit's central location within the Mid-American Conference has made it a frequent site for the league's championship events. While the MAC Basketball Tournament moved permanently to Cleveland starting in 2000, the MAC Football Championship Game has been played at Ford Field in Detroit since 2004, and annually attracts 25,000 to 30,000 fans. The University of Detroit Mercy has a NCAA Division I program, and Wayne State University has both NCAA Division I and II programs. The NCAA football's Motor City Bowl is held at Ford Field each December.
Auto Racing
Detroit's only auto racing venue is the Belle Isle Park, where the IndyCar Series and American Le Mans Series have various race events.
Golf Tournaments
The PGA Championship at Oakland Hill County Club is the one major golf tournament in Detroit scheduled for 2008. The Oakland Hills Country Club expects to host four event days with more than 10,000 attendees during the PGA Championship. Information on golf tournaments was determined by contacting all of the 19 golf courses in the Detroit area.
Street and Park Events
Street and park events in the Detroit area include fairs, festivals, and marathons. Information on street events was collected by contacting every event organizer listed in an annual event calendar published by the GM Renaissance Center.
Expositions and Shows
Most large exhibitions in Detroit are held at the Cobo Conference and Exposition Hall. As discussed earlier, the annual auto show is the largest of these events.
PSE Event Days Summary Matrix
A matrix that details the number of event days for PSEs with more than 10,000 attendees in the Detroit area is provided in Exhibit 3-4. The matrix categorizes the event days by event type and venue location. Detroit is host to approximately 526 large PSEs annually. Accordingly, there is an average of about 1.4 large PSEs every day in the city.
 |
Affiliated Team/Event | Average Attendance | Ford Field | The Palace of Auburn Hills | Joe Louis Arena | Comerica Park | Cobo Arena | Cobo Conference and Exposition Hall | Street | Parks | Oakland Hills Country Club | Belle Isle Park | DTE Energy Music Theater | Total |
|---|---|---|---|---|---|---|---|---|---|---|---|---|---|---|
| Professional Football | Lions | 55,000 | 10 | |
|
|
|
|
|
|
|
|
|
10 |
| Professional Baseball | Tigers | 32,000 | |
|
|
81 | |
|
|
|
|
|
|
81 |
| Professional Basketball | Pistons | 20,000 | |
70 | |
|
|
|
|
|
|
|
|
70 |
| Professional Ice Hockey | Red Wings | 18,000 | |
|
48 | |
|
|
|
|
|
|
|
46 |
| College Football | |
15,000 | 5 | |
|
|
|
|
|
|
|
|
|
5 |
| College Basketball | |
15,000 | |
10 | |
|
|
|
|
|
|
|
|
10 |
| Auto Racing | |
30,000 | |
|
|
|
|
|
|
|
|
3 | |
3 |
| Horse Racing | |
|
|
|
|
|
|
|
|
|
|
|
|
0 |
| Golf Tournaments | |
40,000 | |
|
|
|
|
|
|
|
4 | |
|
4 |
| Marathons | |
15,000 | |
|
|
|
|
|
2 | |
|
|
|
2 |
| Concerts | |
15,000 | |
40 | 90 | |
|
|
|
2 | |
|
45 | 177 |
| Parades | |
100,000 | |
|
|
|
|
|
1 | |
|
|
|
1 |
| Fairs | |
|
|
|
|
|
|
|
|
|
|
|
|
0 |
| Festivals | |
40,000 | |
|
|
|
|
|
3 | |
|
|
|
3 |
| Protests/Political Events | |
|
|
|
|
|
|
|
|
|
|
|
|
0 |
| Expositions and Shows | |
10,000 | 1 | 40 | |
|
3 | |
|
|
|
|
|
44 |
| Other-Concerts | |
47,000 | |
|
|
|
|
|
|
|
|
|
|
2 |
| Other – High School Football | |
25,000 | |
|
|
|
|
|
|
|
|
|
|
3 |
| Other – Auto Show | |
58,600 | |
|
|
|
|
17 | |
|
|
|
|
17 |
| Other – NAACP Event | |
125,000 | |
|
|
|
|
3 | |
|
|
|
|
3 |
| Other – Festival (Target Fireworks) | |
500,000 | |
|
|
|
|
|
|
1 | |
|
|
1 |
| Other – Festival (Thanksgiving; Arts Fest.) | |
105,000 | |
|
|
|
|
|
1 | 3 | |
|
|
4 |
| Other – Festival (Rockin' Riverfront) | |
10,000 | |
|
|
|
|
|
|
8 | |
|
|
8 |
| Other – Festival (Winter Blast) | |
125,000 | |
|
|
|
|
|
|
4 | |
|
|
4 |
| Other – Festival (Eastern Mkt. Flower Day) | |
125,000 | |
|
|
|
|
|
1 | |
|
|
|
1 |
| Other – Festival (GM River Days) | |
117,000 | |
|
|
|
|
|
|
3 | |
|
|
3 |
| Other – Festival (Comerica Cityfest) | |
87,000 | |
|
|
|
|
|
|
1 | |
|
|
1 |
| Other – Festival (Detroit Int'l Jazz Fest.) | |
250,000 | |
|
|
|
|
|
|
4 | |
|
|
4 |
| Other – Festival (Winter Blast) | |
125,000 | |
|
|
|
|
|
|
4 | |
|
|
4 |
| Other – Boat Race | |
33,000 | |
|
|
|
|
|
|
3 | |
|
|
3 |
| Other – College Hockey | |
12,000 | |
|
12 | |
|
|
|
|
|
|
|
12 |
| Total | |
|
21 | 160 | 148 | 81 | 3 | 20 | 8 | 33 | 4 | 3 | 45 | 526 |
| Maximum Facility Capacity | |
|
65,000 | 22,076 | 19,988 | 41,070 | 12,191 | NA | NA | NA | NA | NA | 15,274 | |
| Public Transportation (Y/N) | |
|
|
|
|
|
|
|
|
|
|
|
|
|
| Near Interstate (Y/N) | |
|
|
|
|
|
|
|
|
|
|
|
|
|
| Type of Public Transit* | |
|
|
|
|
|
|
|
|
|
|
|
|
|
| Number of Parking Spaces | |
|
|
|
|
|
|
|
|
|
|
|
|
|
Venue Location |
|
|
|
|
|
|
|
|
|
|
|
|
|
|
| * Response options are: B (Bus), L (Light
Rail), H (Heavy Rail) ** Response options are: D (Downtown), U (Urban), S (Suburban), R (Rural) |
||||||||||||||
Exhibit 3-5 summarizes venue-specific PSE event days with attendance over 10,000 as a percent of the total number of PSEs with attendance over 10,000. An average of approximately 526 PSE event days with attendance of more than 10,000 people occurs annually. This translates into an average of 1.4 events with crowds of more than 10,000 people per day, or about 10 per week. The venue that hosts the most events with more than 10,000 attendees is the Palace of Auburn Hills. This venue hosts 31 percent of all such events. The second most frequent host is Joe Louis Arena, which hosts 28 percent of all PSEs with attendance of more than 10,000. The third most frequent host is Comerica Park, which hosts 16 percent of all events with more than 10,000 attendees. Combined, these three venues host 75 percent of all PSE events with more than 10,000 attendees.
| Venue | Venue Type | Number of PSE Event Days Annually | Percent of Total |
|---|---|---|---|
| Ford Field | Stadium | 21 | 4 |
| The Palace of Auburn Hills | Arena | 160 | 30.4 |
| Joe Louis Arena | Arena | 148 | 28.1 |
| Comerica Park | Stadium | 81 | 15.4 |
| Cobo Arena | Arena | 3 | 0.6 |
| Cobo Conference and Exposition Hall | Convention Center | 20 | 3.8 |
| Street | Street | 8 | 1.5 |
| Park | Park | 33 | 6.3 |
| Oak Land Country Club | Golf Course | 4 | 0.8 |
| Belle Isle Park | Raceway | 3 | 0.6 |
| DTE Energy Music Hall | Music Hall | 45 | 8.6 |
| TOTAL | |
526 | 100 |
Exhibit 3-6 lists PSE event days by activity categories. The three largest categories are professional sports, concerts, and expositions and shows. Professional sports account for 40 percent of PSEs, with more than 10,000 attendees, while concerts account for 34 percent, and expositions and shows account for another 12 percent. Together these three categories account for 86 percent of events with more than 10,000 attendees.
| Activity category | Activity | Number of PSE Event Days Annually | Percent of Total |
|---|---|---|---|
| Professional Sports | Professional Football | 10 | 1.9 |
| Professional Sports | Professional Baseball | 81 | 15.4 |
| Professional Sports | Professional Basketball | 70 | 13.3 |
| Professional Sports | Professional Ice Hockey | 46 | 8.7 |
| College & High School Sports | College Football | 8 | 1.5 |
| College & High School Sports | College Basketball | 10 | 1.9 |
| College & High School Sports | Other – College Hockey | 12 | 2.3 |
| Racing | Auto Racing | 3 | 0.6 |
| Racing | Horse Racing | 0 | 0 |
| Racing | Other – Boat Racing | 3 | 0.6 |
| Golf | Golf Tournaments | 4 | 0.8 |
| Concerts | Concerts | 179 | 34 |
| Marathons | Marathons | 2 | 0.4 |
| Parades | Parades | 1 | 0.2 |
| Fairs | Fairs | 0 | 0 |
| Festivals | Festivals | 33 | 6.3 |
| Protests & Political Events | Protests & Political Events | 3 | 0.6 |
| Expositions & Shows | Expositions & Shows | 61 | 11.6 |
| TOTAL | |
526 | 100 |
Traffic Impacts
According to the UMR, the annual delay per traveler in Detroit is 54 hours. Given the results of the previous studies, the annual delay per traveler in the PM peak period would be 30.1 hours per year. Utilizing a range of 4 percent to 8 percent as the portion caused by PSEs results in an estimated 1.2 to 2.4 hours of delay per year for every traveler in the Detroit area as a result of planned special events. The results of the congestion analysis for the Detroit area are summarized in Exhibit 3-7.
| Congestion Category | Units | AM Peak (44%) | PM Peak (56%) | PSE Caused (4%) | PSE Caused (8%) | Totals |
|---|---|---|---|---|---|---|
| Average Delay per traveler | Hours | 23.9 | 30.1 | 1.2 | 2.4 | 54 |
| Wasted Fuel per Traveler | Gallons | 15.5 | 19.5 | 0.8 | 1.6 | 35 |
| Travel Delay | Hours | 51,126,991 | 64,420,009 | 2,576,800 | 5,153,601 | 115,547,000 |
| Excessive Fuel Consumed | Gallons | 33,655,752 | 42,406,248 | 1,696,250 | 3,392,500 | 76,062,000 |
| Congestion Cost | $ Million | $962 | $1,212 | $48 | $97 | $2,174 |
This delay affects both attendees and non-attendees of the planned special events. The attendees experience delay while they are trying to enter the various venues throughout the Detroit area. This includes entering parking lots and the delay caused by increased volumes. However, non-attendees also experience delay, since traffic volumes increase during planned special events along with possible roadway closures and detours. This reduces the consistency of the non-attendee traffic, since additional volumes and possible closures are introduced. The UMR notes that 40 percent of all congestion is recurring congestion. Travelers come to expect the recurring congestion on the roadway network and look at it as just part of the drive. The “unexpected” congestion is a larger issue, and this is what can result from planned special events. The next category analyzed in the UMR is wasted fuel per traveler; an estimated 0.8 and 1.6 gallons is wasted annually per traveler in the Detroit area as a result of planned special event congestion.
The population figures for the Detroit region were then further analyzed to obtain the total values of the effects of congestion. Planned special events account for between 2,577,000 and 5,154,000 hours of travel delay per year in the Detroit area. Excess fuel consumed is between 1,696,000 and 3,393,000 gallons per year, and the congestion cost is between $48 million and $97 million dollars per year. This figure would be higher if current gasoline prices were used in the calculators. A total cost of $97 million for the Detroit region is substantial and must be considered when planning and operations are undertaken for planned special events. This figure is indicative of the significant influence planned special events have on the traveling public in regions throughout the country.
This study used the previously determined attendance figures to determine more specific congestion impacts in the Detroit area. With 81 games per year, the average attendance at a Detroit Tigers professional baseball game is 32,000 people. That means that 2,592,000 people attend events at Comerica Park in Detroit each year, which is approximately 18 percent of all planned special event attendance in the Detroit area. The results of the attendance breakdown can be seen in Exhibit 3-8.
| Venue Type | Avg. Attendance | Number of Events | Total Attendance | Percent of Total |
|---|---|---|---|---|
| Professional Football | 55,000 | 10 | 550,000 | 4 |
| Professional Baseball | 32,000 | 81 | 2,592,000 | 18 |
| Professional Basketball | 20,000 | 70 | 1,400,000 | 10 |
| Professional Ice Hockey | 18,000 | 46 | 828,000 | 6 |
| College Football | 15,000 | 5 | 75,000 | 1 |
| College Basketball | 15,000 | 10 | 150,000 | 1 |
| Auto Racing | 30,000 | 3 | 90,000 | 1 |
| Golf Tournaments | 40,000 | 4 | 160,000 | 1 |
| Marathons | 15,000 | 2 | 30,000 | 0 |
| Concerts | 15,000 | 177 | 2,655,000 | 18 |
| Parades | 100,000 | 1 | 100,000 | 1 |
| Festivals | 40,000 | 3 | 120,000 | 1 |
| Expositions & Shows | 10,000 | 44 | 440,000 | 3 |
| Concerts | 47,000 | 2 | 94,000 | 1 |
| High School Football | 25,000 | 3 | 75,000 | 1 |
| Auto Show | 58,600 | 17 | 996,200 | 7 |
| NAACP Event | 125,000 | 3 | 375,000 | 3 |
| Target Fireworks | 500,000 | 1 | 500,000 | 3 |
| Thanksgiving Arts Festival | 105,000 | 4 | 420,000 | 3 |
| Rockin' Riverfront | 10,000 | 8 | 80,000 | 1 |
| Winter Blast | 125,000 | 4 | 500,000 | 3 |
| Eastern Market Flower Day | 125,000 | 1 | 125,000 | 1 |
| GM River Days | 117,000 | 3 | 351,000 | 2 |
| Comerica City fest | 87,000 | 1 | 87,000 | 1 |
| Detroit International Jazz Festival | 250,000 | 4 | 1,000,000 | 7 |
| Winter Blast | 125,000 | 4 | 500,000 | 3 |
| Boat Race | 33,000 | 3 | 99,000 | 1 |
| College Hockey | 12,000 | 12 | 144,000 | 1 |
Given that 18 percent of all attendance at special events in the Detroit area is at professional baseball games, between 463,800 hours and 927,600 hours of travel delay are attributable to this PSE. On a per-game basis, given 81 games per year, this breaks down to between 5,700 hours and 11,400 hours of delay caused by each professional baseball game in the Detroit area.
This delay affects both attendees as well as non-attendees of games at Comerica Park, the site of Detroit’s professional baseball team. The attendees experience delay while they are trying to enter the venue, and non-attendees also experience delay due to increased traffic volumes during the games, in addition to possible roadway closures and detours. The excess fuel consumed in the Detroit area due to professional baseball is between 305,300 and 610,600 gallons per year, or between 3,800 and 7,500 gallons per game. The congestion cost of professional baseball in the Detroit area is between $9 million and $17 million per year, which translates to between $110,000 and $210,000 of congestion cost per professional baseball game.
The preceding analysis looks at each step in the process as being equal. However, a closer look at the characteristics of Comerica Park reveals that there are many factors that help to reduce congestion caused by planned special events. Specifically, Comerica Park is located near an interstate highway, which provides a good access scheme for the events and helps to reduce congestion on the local network of arterial streets.
13 GM Renaissance Center, "Major Detroit Events and Festivals" (GM Renaissance Center), http://www.gmrencen.com/Detroit/MajorEvents/tabid/99/Default.aspx (accessed 4/24/2008).