PORTLAND CASE STUDY
Portland was chosen as the case study city to represent the Large category and is located in the western region of the U.S. This section presents the results of a case study of PSEs in the Portland metropolitan area.
In conducting the case study, an exhaustive search of national and local data was conducted to identify venues where large events might occur and also to search data by event type, such as professional and college football, basketball and other sports, to identify event generators in the case study area. This dual approach of compiling data by both venue and event type was designed to maximize the coverage of events.
Venues and Event Types
The following specially designed facilities in the Portland area with event days that attract crowds of more than 10,000 people were identified and contacted:
- Rose Garden Arena – maximum capacity 20,500
- Memorial Coliseum – maximum capacity 19,980
- PGE Park (formerly Civic Stadium) – maximum capacity 19,000
- Oregon Convention Center – maximum capacity 10,000
- Portland Metropolitan Exposition Center – maximum capacity not available
- Portland International Raceway – maximum capacity 86,000
- Columbia Edgewater Country Club – maximum capacity not available
Other event-hosting facilities that were examined, but found not to host events with crowds larger than 10,000, include:
- Portland Meadows (Horse Racing) – maximum capacity 4,450
- Portland Center for the Performing Arts – maximum capacity 2,992
- Portland State University's Peter W. Stott Center – maximum capacity 1,500
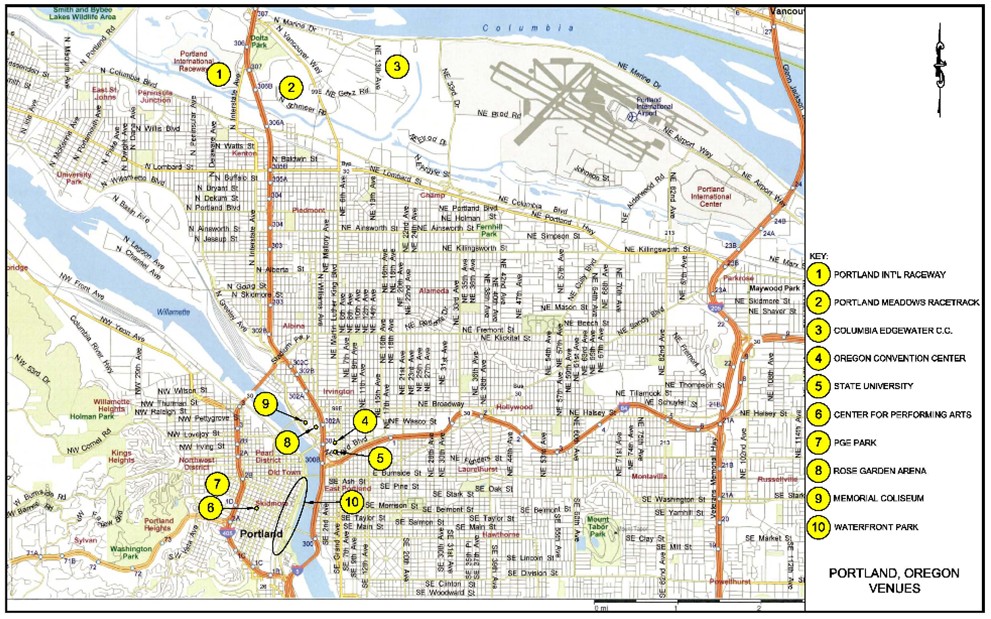
A map of some of these venues is provided in Exhibit 4-1. All of these venues are located well within five miles of a major highway.
Exhibit 4-1: Map of Venues in Portland that Host PSEs with
More Than 10,000 Attendees
Additionally, the following municipal departments were contacted to collect information on open-area PSEs:
- Department of Transportation
- Department of Parks and Recreation
- Revenue Bureau
- Police Bureau
Data Collection by Venue
The next few paragraphs provide a description of each of the PSE hosting venues in the city that draws crowds of more than 10,000 people.
Rose Garden Arena
Rose Garden Arena is an indoor venue located in downtown Portland. The Rose Garden Arena and Memorial Coliseum are both part of the Rose Quarter, a sports and entertainment district that is managed by Global Spectrum Inc. The Rose Garden is the largest stadium in the city and has a maximum capacity of 20,500. It is the home of the National Basketball Association (NBA) Portland Trailblazer team. Other PSEs hosted at the Rose Garden Arena include concerts and shows (e.g., circuses). The Rose Garden arena hosts an average of 66 PSEs annually.
PGE Park
The maximum capacity of PGE Park is 19,600 for typical sporting events. During concerts, the capacity is increased to 26,000 by utilizing floor space and adding a few additional bleachers. The maximum capacity ever obtained for an event at PGE Park was 29,000 for a special one-time-only soccer event.
The tenants of PGE Park include a AAA Minor League Baseball team known as the Portland Beavers. The Beavers host 76 events per year and have an average attendance of 8,000 people. Around seven Beaver games exceed 10,000 in an average year. The Portland Timbers, a professional soccer team, also plays an average of 18 games per year in PGE Park and has an average attendance of 9,000 people per game. About six of these games draw crowds in excess of 10,000 per year.
In addition to these professional teams, the Portland State University college football team plays in PGE Park and has an average attendance of 5,000. One PSU game in 2007 drew over 10,000 attendants. There are approximately 20 events per year related to football, but this number also includes a few high school football games. The total number of events at PGE Park in an average year is 138, with the remaining events comprised of concerts, special soccer matches, or other sporting events. About 17 of these events draw crowds in excess of 10,000 per day.
Oregon Convention Center
The Oregon Convention Center hosts 600,000 visitors annually. On average it has 35 exhibitions that draw crowds larger than 10,000 people. The convention center is also host to an annual cheerleading competition that achieves six event days with over 10,000 attendees.
Portland Metropolitan Exposition Center
The Portland Metropolitan Exposition Center in downtown Portland hosts about five PSEs per year with attendance of over 10,000 people. The five PSEs usually consist of one concert and four expositions. Unlike most other specially designed facilities, the Center does not have dedicated parking.
Portland International Raceway
Portland International Raceway (PIR) is capable of hosting 66,000 people. The raceway has 26,000 bleacher seats and can host an additional 60,000 standing participants. The largest event hosted at the PIR is the annual Champ Car race, a three day event with an average daily attendance of 11,500 people. The Champ Car race is the only event at the PIR that attracts more than 10,000 attendants.
Columbia Edgewater Country Club
The Columbia Edgewater Country Club hosts the annual Safeway Classic tournament. This annual golf tournament is for professional golfers on the Ladies Professional Golf Association (LPGA) Tour and is held over the course of a week during the month of August. There are usually four event days with attendance exceeding 10,000 during the tournament. The Safeway Classical is the only golf tournament in Portland that draws PSE-level crowds.
Data Collection by Activity
The next few paragraphs describe data collected for each of the PSE event types in the Portland area.
Professional Sports
Portland has three professional sports teams: baseball, basketball, and ice hockey. The city does not have a professional football team. Event data for the professional teams are summarized in Exhibit 4-2.
| Sport | Team | League | Primary Venue | Average Number Of Event Days With More Than 10,000 Attendees |
|---|---|---|---|---|
| Baseball | Beavers | AAA* | PGE Park |
6 |
| Basketball | Trailblazers | NBA | Rose Garden Arena | 44 |
| Ice Hockey | Winter Hawks | CHL** | PGE Park | 0 |
| * AAA Minor Baseball League ** Canadian Hockey League |
||||
College Sports
The Portland State University football team plays at PGE Park. During the 2007 session the team had only one game with more than 10,000 in attendance.
Auto Racing
As discussed above, Portland is home to the popular annual Champ Car race held at the Portland International Raceway (PIR). The race is a three-day event with an average daily attendance of 11,500 people. According to officials at the PIR, there are no other race tracks in the Portland area that attract crowds of more than 10,000 people.
Golf Tournaments
The four golf courses that have hosted tournaments with greater than 10,000 attendees since 2000 in the Portland area were contacted for this study. The golf courses are:
- Oregon Golf Club
- Crosswater Golf Club
- Columbia Edgewater Country Club
- Pumpkin Ridge Golf Club
Additional comprehensive information on golf tournaments and their associated attendance was gathered from Peter Jacobson Productions (PJP), a sports marketing and event management company run by its namesake professional golfer and CEO.14
According to PJP, as of 2006 there was only one ongoing golf tournament occurring in the Portland area, the Safeway Classic at the Columbia Edgewater Country Club. There are usually four event days with attendance exceeding 10,000 during the tournament. As a result, an estimate of four event days with more than 10,000 attendants was used in this study. Information about golf tournaments in the Portland area is summarized in Exhibit 4-3.
| Golf Course | Tournament | Start Year | End Year | Duration (days) | Attendance by Day During Tournament (in thousands) | |||||||
|---|---|---|---|---|---|---|---|---|---|---|---|---|
| Mon | Tues | Wedns | Thurs | Fri | Sat | Sun | Total | |||||
| Oregon Golf Club | Fred Meyer Challenge | 1998 | 2002 | 3 | N/A | N/A | N/A | N/A | 50 | 50 | 50 | 150 |
| Crosswater Golf Club | JELD-WEN Tradition | 2003 | 2006 | 4 | N/A | N/A | N/A | 18 | 18 | 18 | 18 | 72 |
| Columbia Edgewater Country Club | Safeway Classic | 1970 | Continuing | 7 | 5 | 5 | 5 | 18 | 18 | 18 | 18 | 51 |
| Pumpkin Ridge Golf Club | US Women's Open | 2003 | 2003 | 7 | 3 | 3 | 3 | 15 | 15 | 15 | 15 | 69 |
Street Events
Street events in the Portland area include fairs, festivals, marathons, and protests. Information on street events was collected from the Portland Revenue Bureau, which issues permits for these events. According to the Revenue Bureau, an average of six street PSEs occur annually.
Expositions and Shows
As discussed earlier, most large exhibitions in Portland are held at the Oregon Convention Center and the Portland Metropolitan Exposition Center. The Oregon Convention Center is the larger of the two, averaging 41 PSEs with an attendance of over 10,000 people annually. The Portland Metropolitan Exposition Center in downtown Portland hosts about five PSEs per year, usually one concert and four expositions.
PSE Event Days Summary Matrix
The matrix in Exhibit 4-4 categorizes event days for PSEs in the Portland area by event type and venue location. Portland is host to approximately 187 PSEs annually. Accordingly, there is an average of about one PSE every two days.
 |
Affiliated Team/Event | Average Attendance | Rose Garden Arenad | Memorial Coliseum | PGE Arena | Oregon Convention Center | Portland Metropolitan Esposition Center | Street | Parks | Portland International Raceway | Coumbia Edgewater Country Club | Total |
|---|---|---|---|---|---|---|---|---|---|---|---|---|
| Professional Football | |
|
|
|
|
|
|
|
|
|
|
010 |
| Professional Baseball | Beavers | 8,000 | |
|
7 | |
|
|
|
|
|
7 |
| Professional Basketball | Trailblazers | 15,500 | 44 | |
|
|
|
|
|
|
|
44 |
| Professional Ice Hockey | Winterhawks | |
|
|
|
|
|
|
|
|
|
0 |
| College Football | PSU | |
|
|
1 | |
|
|
|
|
|
1 |
| College Basketball | PSU | |
|
|
|
|
|
|
|
|
|
0 |
| Auto Racing | Champ Car | 11,500 | |
|
|
|
|
|
|
3 | |
3 |
| Horse Racing | |
|
|
|
|
|
|
|
|
|
|
0 |
| Golf Tournaments | Safeway Classic | |
|
|
|
|
|
|
|
|
4 | 4 |
| Marathons | |
22,000 | |
|
|
|
|
4 | |
|
|
4 |
| Concerts | |
12,400 | 20 | 1 | 2 | |
1 | |
1 | |
|
25 |
| Parades | |
250,000 | |
|
|
|
|
1 | 1 | |
|
2 |
| Fairs | |
|
|
|
|
|
|
|
|
|
|
0 |
| Festivals | |
14,222 | |
|
|
|
|
|
38 | |
|
38 |
| Protests/Political Events | |
19,000 | |
|
|
|
|
1 | 1 | |
|
2 |
| Expositions and Shows | |
12,000 | |
|
|
35 | 4 | |
|
|
|
39 |
| Other-Cheerleading | |
10,000 | |
|
|
6 | |
|
|
|
|
6 |
| Other – Family Shows | |
11,000 | 2 | |
|
|
|
|
|
|
|
2 |
| Other –Soccer | Timbers | |
|
|
7 | |
|
|
|
|
|
7 |
| Other – Bicycling | |
|
|
|
|
|
|
|
3 | |
|
3 |
| Total | |
|
66 | 1 | 17 | 41 | 5 | 6 | 44 | 3 | 4 | 187 |
| Maximum Facility Capacity | |
|
20,500 | 19,980 | 19,000 | 10,000 | NA | NA | NA | 86,000 | NA | |
| Public Transportation (Y/N) | |
|
Y | Y | Y | Y | Y | Y | NA | Y | N | |
| Near Interstate (Y/N) | |
|
Y | Y | Y | Y | Y | Y | NA | Y | Y | |
| Type of Public Transit* | |
|
B, L | B, L | B | B, L | L | B, L | NA | L | NA | |
| Number of Parking Spaces | |
|
2,600 | 2,600 | 0 | NA | 2,500 | 0 | NA | 1,500 | 200 | |
Venue Location |
|
|
D | D | D | D | U | D | R | U | U | |
| * Response options are: B (Bus), L (Light
Rail), H (Heavy Rail) ** Response options are: D (Downtown), U (Urban), S (Suburban), R (Rural) |
||||||||||||
The number of venue-specific PSE event days with more than 10,000 attendees as a percent of the total number of PSEs with more than 10,000 attendees is summarized in Exhibit 4-5. There are on average approximately 187 PSE event days with attendance over 10,000 annually. Statistically, this is an average of 3.6 PSE event days per week, or one every 1.9 days. The majority of these events, 35 percent, are hosted at the Rose Garden Arena. The second most frequent host of these events is the Portland Park System, which hosts 24 percent of all PSEs with attendance over 10,000. In third place is the Oregon Convention Center, which hosts 22 percent of all PSEs with attendance over 10,000.
| Venue | Venue type | Number of PSE event days annually | Percent of Total (%) |
|---|---|---|---|
| Rose Garden Arena | Stadium | 66 | 35.3 |
| Memorial Coliseum | Stadium | 1 | 0.5 |
| PGE Park | Stadium | 17 | 9.1 |
| Oregon Convention Center | Convention Center | 41 | 21.9 |
| Portland Metropolitan Exposition Center | Convention Center | 5 | 2.7 |
| Street | Street | 6 | 3.2 |
| Parks | Parks | 44 | 23.5 |
| Portland International Raceway | Raceway | 3 | 1.6 |
| Columbia Edgewater Country Club | Golf Course | 4 | 2.1 |
| TOTAL | |
187 | 100 |
| Note: Due to rounding, the percentages may not add up to 100. | |||
The majority of PSEs with attendance over 10,000 take place in stadiums and convention centers. The three stadiums and two convention centers listed in Exhibit 4-6 hosted about 70 percent of all such PSEs.
| Activity Category | Activity | Number of PSE Event Days Annually | Percent of Total (%) |
|---|---|---|---|
| Professional Sports | Professional Football | 0 | 0 |
| Professional Sports | Professional Baseball | 7 | 3.7 |
| Professional Sports | Professional Basketball | 44 | 23.5 |
| Professional Sports | Professional Ice Hockey | 0 | 0 |
| Professional Sports | Other – Professional Soccer | 7 | 3.7 |
| College & High School Sports | College Football | 1 | 0.5 |
| College & High School Sports | College Basketball | 0 | 0 |
| College & High School Sports | Other | 0 | 0 |
| Racing | Auto Racing | 3 | 1.6 |
| Racing | Horse Racing | 0 | 0 |
| Racing | Other - Bicycle | 3 | 1.6 |
| Golf | Golf Tournaments | 4 | 2.1 |
| Concerts | Concerts | 25 | 13.4 |
| Marathons | Marathons | 4 | 2.1 |
| Parades | Parades | 2 | 1.1 |
| Fairs | Fairs | 0 | 0 |
| Festivals | Festivals | 38 | 20.3 |
| Protests / Political Events | Protests / Political Events | 2 | 1.1 |
| Expositions & Shows | Expositions & Shows | 47 | 25.1 |
| TOTAL | |
187 | 100 |
| Note: Due to rounding, the percentages do not add up to 100. | |||
Professional sports account for 27 percent of PSEs with attendance over 10,000. Concerts, festivals, and expositions, account for 13, 20, and 25 percent of PSEs respectively. These four categories combined account for about 85 percent of all PSEs with attendance over 10,000.
Traffic Impacts
Results of the congestion analysis for the Portland area are summarized in Exhibit 4-7.
| Congestion Category | Units | AM Peak (44%) | PM Peak (56%) | PSE Caused (4%) | PSE Caused (8%) | Totals |
|---|---|---|---|---|---|---|
| Average Delay per traveler | Hours | 16.8 | 21.2 | 0.8 | 1.7 | 38 |
| Wasted Fuel per Traveler | Gallons | 11.9 | 15.1 | 0.6 | 1.2 | 27 |
| Travel Delay | Hours | 14,893,805 | 18,766,195 | 750,648 | 1,501,296 | 33,660,000 |
| Excessive Fuel Consumed | Gallons | 10,622,566 | 13,384,434 | 535,377 | 1,070,755 | 24,007,000 |
| Congestion Cost | $ Million | 277 | 348 | 14 | 28 | 625 |
The annual delay per traveler in Portland is estimated to range between 0.8 and 1.7 hours per year as a result of planned special events, while the wasted fuel per traveler is between 0.6 and 1.2 gallons. The cumulative travel delay for Portland as a result of planned special events is between 751,000 and 1,501,000 hours per year, and excess fuel consumed is between 535,000 and 1,071,000 gallons per year. Finally, the congestion cost of these events is estimated to be between $14 million and $28 million dollars per year.
The previously determined attendance figures were used to assess more specific congestion effects in the Portland area. The 44 Portland Trailblazers professional basketball games per year have an average attendance of 15,500 people. That equals 682,000 attendees of professional basketball in the Portland area per year, or approximately 30 percent of all planned special event attendance in the Portland area.
The total annual travel delay for Portland as a result of professional basketball is between 225,300 and 450,300 hours. On a per game basis, given 44 games per year, this breaks down to between 5,120 hours and 10,200 hours of delay caused by each professional basketball game in the Portland area.
The excess fuel consumed in the Portland area due to professional basketball is between 160,500 and 321,000 gallons per year, which translates to between 3,650 and 7,300 gallons per game. The congestion cost is between $4 million and $8 million per year, or between $91,000 and $182,000 of congestion cost per professional basketball game.
A closer look at the characteristics of the Rose Garden Arena reveals many factors that help to reduce congestion caused by planned special events. Both buses and light rail are available and the Arena is located near an interstate, which provides a good access scheme for the events.