Assessment of Advanced Warning Signs for Flagging Operations
By
Steven L. Jones, Jr.
Assistant Professor
Department of Civil and Environmental Engineering
University of Alabama at Birmingham
120 Hoehn Building, Room 210B
1075 13th Street South
Birmingham, AL 35294-4440
T: 205.934.8462
F: 205.934.9855
And
Benjamin H. Cottrell, Jr.
Senior Research Scientist
Virginia Transportation Research Council
530 Edgemont Road
Charlottesville, VA 22903-2454
Telephone: (804) 293-1932
Facsimile: (804) 293-1990
Ben.Cottrell@VirginiaDOT.org
Abstract
The Virginia Department of Transportation (VDOT) and several other state departments of transportation have expressed interest in modifying the advanced warning sign for work zone flagging operations. The advanced warning sign is intended to alert drivers to the presence of flaggers and to prepare drivers to stop (if necessary) prior to reaching work zone operations. The current or existing flagger sign depicts a symbol of a worker holding a flag; the proposed sign depicts a worker holding a STOP/SLOW paddle. The purpose of this research project was to assess and compare the motoring public’s understanding of the existing and proposed advanced warning signs for work zone flagging operations.
The study consisted of a literature review and a survey of motorists. Over 3,600 multiple-choice surveys were successfully mailed out to randomly selected Virginia residents of which 38 percent were returned. The survey results indicated that the proposed sign was for the most part understood by Virginia drivers and appeared to be effective at conveying its message.
Key Words: flagger, advance flagger warning sign, flagging, traffic control device, work zones
Introduction and Problem Statement
The Virginia Department of Transportation (VDOT) and other state departments of transportation have expressed interest in modifying the advanced warning sign for work zone flagging operations. The general purpose of the advanced warning sign is to alert the motoring public to potential traffic flow interruptions caused by flaggers directing traffic in work zones. Specifically, the advanced warning sign is intended to alert drivers to the presence of flaggers who are ahead and to prepare the drivers to stop, if necessary, prior to reaching the flaggers in the work zone operations.
Currently, the advanced warning sign for flagging operations, W20-7a, displays the silhouette of a highway worker holding a flag. In practice, however, traffic in most work zones in Virginia is controlled with STOP/SLOW paddles instead of red flags. The 1993 Part VI of the Manual on Uniform Traffic Control Devices (MUTCD) was revised to state that "The STOP/SLOW paddle, which gives drivers more positive guidance than red flags, should be the primary hand-signaling device"(1). Therefore, the STOP/SLOW paddles have been the standard for work zone traffic control since 1987, following a three-year phasing-in period.
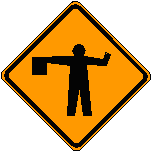
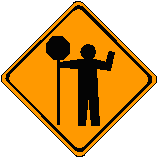
Although the traffic control symbol itself was changed, the applicable warning sign, W20-7a, was never updated to reflect the change in work zone traffic control practices. Therefore, it was proposed that the flagger sign W20-7a should be changed from the current symbol of a worker holding a flag to one depicting a worker holding a STOP/SLOW paddle. Examples of the original sign and the proposed W20-7a sign are presented in Figures 1 a and b, respectively.
In 1987, the Federal Highway Administration (FHWA) conducted a study in response to a petition to modify the W20-7a sign to display a worker holding a STOP/SLOW paddle instead of a flag. This FHWA in-house human factors study indicated that it was difficult for drivers to correctly identify the meaning of the new sign (2). The study showed, however, that drivers easily identified the meaning of the original W20-7a sign. A subsequent 1989 FHWA study also showed that drivers more readily understood the original W20-7a sign than the proposed sign showing a man holding a STOP/SLOW paddle (3).
| a. Original W20-7a Sign: Orange sign in a diamond shape of a man holding a flag. | b. Proposed W20-7a Sign: Same sign as original except man is holding a STOP/SLOW paddle. |
|---|---|
 |
 |
Part of the reason that drivers were unable to correctly interpret the meaning of the W20-7a sign with the STOP/SLOW paddle may have been the fact that the paddle was not widely used at the time of the unpublished 1987 FHWA study. The paddle sign has gained acceptance and increased in usage in work zone traffic control since the previous studies. As a result, increasing numbers of motorists have been exposed to this new sign. Therefore, it would be reasonable to assume that this familiarity will most likely result in more correct interpretations of the proposed sign’s meaning.
There is concern over the continuing discrepancy between what the motoring public sees on the existing advanced warning signs and the actual "flagger" they encounter in the work zone. A 1995 human factors study of older drivers reported as one of its key findings that signs should use representational rather than abstract symbols ( ). Currently, the depiction of a worker holding a flag rather than a paddle does not constitute an accurate representation of the traffic situation encountered by the driver. In addition, continued use of the original W20-7a sign has resulted in roadway workers in Virginia erroneously controlling traffic with flags in an attempt to comply with the advanced warning signs placed throughout the work zone.
Purpose and Scope
The purpose of this study is to examine the feasibility of modifying the W20-7a sign to reflect actual work zone conditions by depicting the STOP/SLOW paddle in lieu of the flag. An assessment and comparison of the motoring public’s understanding of the existing and proposed flagger signs were made.
Methodology
Questionnaire Development
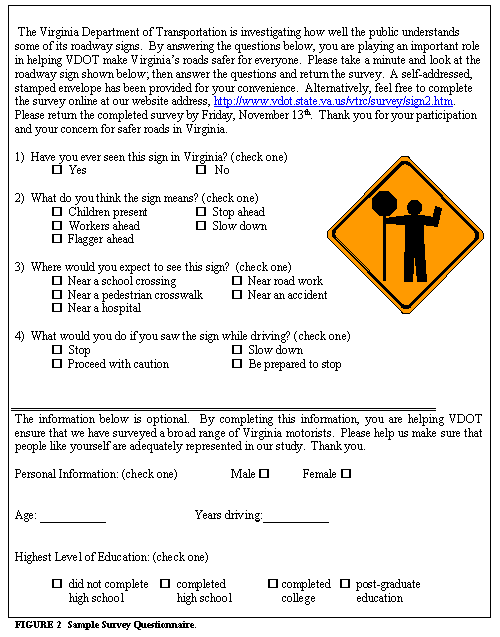
Two survey questionnaires were developed to ascertain motorists’ understanding of both the existing and proposed flagger signs. The questions used in the current study include close variations on three of the six questions used in the unpublished 1987 FHWA study. Each questionnaire contained a color image of the study sign and four study questions. In addition, the questionnaire included several questions to elicit demographic information from the respondents. The questionnaires were administered directly to participants–these face-to-face assemblies were called sample groups. The majority of questionnaires were part of a large mail-out survey. The two versions of the questionnaires contained identical questions, but differed in that those for the mail-out survey contained multiple-choice answers, while those administered to the study groups were open-ended to allow respondents to "write in" their answers. A sample of the multiple choice format questionnaire for the proposed sign is presented in Figure 2. The multiple-choice format was chosen for the mail-out survey to enhance ease and convenience for respondents with the intent of increasing the response rate. An open-ended format was used for the sample groups to provide the researchers valuable information as to what extent the multiple choice format influenced the responses to the mail-out survey. Prior to conducting the surveys, the questionnaires were pretested with VTRC employees to determine their effectiveness. The survey was then tested at a local adult driver’s education class.
Sample Groups
Particular attention was directed towards assessing the understandability of the proposed sign among younger and older drivers. The needs and responses of older drivers to traffic control are receiving much attention. Older drivers probably would have encountered many flagging operations over the years, whereas younger drivers most likely would have encountered few of these while driving. The open-ended questionnaire with the proposed sign image was administered to 116 students in driver education classes at three local high schools, 43 undergraduate students in an engineering class at the local university, and 50 older drivers at a local Senior Center.
Mail-out Survey
Self-administered survey questionnaires were distributed to a randomly selected population of Virginia residents. Statistical analysis was performed to identify the sample size necessary to provide an appropriate level of confidence in the survey results. Since there was considerable subjectivity inherent to the survey questions, it was decided that a +/- 4 percent error in the survey accuracy at the 95 percent confidence level would be acceptable. This condition resulted in a desired sample size of 600 survey responses. The researchers assumed a 25 percent survey return rate. The assumption was based on conventional wisdom among VTRC staff of a 10 to 20 percent return rates for mail-out surveys and the relative ease of the questionnaire used in the current study. Questionnaires were developed for both the existing and proposed signs. Therefore, the total number of responses desired was 1,200 (600 for each sign), requiring a target mail-out distribution of approximately 4,800 questionnaires.
Address List Development
An Internet-based telephone book was used to obtain addresses for 4,800 Virginia residents. This Internet database contains telephone and address listings from phonebooks throughout Virginia. The website provides a searchable interface to the listings in the database by last name, first name, and state. The listings in the database can be searched by the first letter of the first and last names.
A methodology to randomly select names and addresses from the database was developed. The method involved the development of a list of random number pairs. Each of the pairs contained two random numbers between 1 and 26, corresponding to the letters of the alphabet. For example, a number pair containing 1 and 2 would correspond to the letters A and B. For this example pair, "A" would be entered as the first letter of the last name and the "B" would be entered as the first letter of the first name. The database would then be searched for names and addresses of Virginia residents with last names beginning with "A" and first names beginning with the letter "B." For each search, 10 name and address listings were reported by the Internet search engine. These listings were then recorded and stored for use in the mail-out survey. A list of 10 names and addresses were obtained for each random number pairs until 4,800 listings had been recorded. The listings were checked for format, screened for repetition, and printed on mailing labels for distribution of the survey questionnaires. Screening of the initial addresses resulted in approximately 300 names and addresses being discarded due to incompleteness.
Response Analyses
A detailed analysis was performed after the sample group surveys were conducted and a sufficient number of responses to the mail-out surveys were received. The results of question 1 were tabulated (YES/NO) and analyzed along with demographic information reported with the surveys. The following coding from the 1987 unpublished FHWA study was used . The responses to the substantive survey questions (2, 3, and 4) were coded as correct, substantially correct, or incorrect where:
- correct–implies a clear understanding of sign meaning
- substantially correct–implies a substantive understanding of sign meaning
- incorrect–implies a total lack of understanding of sign meaning.
Results and Discussion
Mail-out Survey Response Summary
Approximately 4,500 survey questionnaires were mailed to randomly selected Virginia residents. Of the 4,500 total surveys mailed out, 813 were returned from the Post Office as a result of an insufficient address, lack of forwarding address, or other problems with locating the addressees. Therefore, only about 3,600 questionnaires actually reached their intended destination. A total of 1,383 questionnaire replies were received (759 contained the existing sign and 624 depicted the proposed sign). Only 20 responses were recorded on the survey websites. Using the number of questionnaires actually delivered, 3,600, the overall return rate for the mail-out survey was calculated to be approximately 38 percent.
Chi-square analysis was performed on the demographic information to ensure that the distribution of the various characteristics was the same for the populations responding to questionnaires pertaining to either the existing or the proposed sign. The null hypothesis, H0, for these analyses was that the distribution of the characteristics (gender, age, number of years driving, and education) were the same for both populations. It is concluded from these results that there is no statistical difference in the distribution of demographic characteristics between the two populations (i.e., those viewing the existing sign and those viewing the proposed sign) for each of the four characteristics.
Comparative Analyses
Survey Question 1–"Have you ever seen this sign in Virginia?"
This question was presented in a multiple choice format allowing respondents to choose either a "YES" or "NO" response. The percentages of each response are summarized in Figure 3 for both signs. Almost a quarter of the respondents viewing the existing sign indicated that they had never seen it. These responses may indicate that the respondents have not encountered the sign or simply do not recall having done so. Slightly more than one third of the respondents who viewed the proposed sign indicated that they had never seen the sign. Approximately 65 percent claimed that they had encountered the proposed sign (although it has not yet been used in Virginia). A possible interpretation of these results is that the motorists’ responses indicated that there was a similarity between the existing and proposed signs. Also, respondents may have perceived the proposed sign as being representative of the use of STOP/SLOW paddles that they have encountered while driving through flagging operations throughout Virginia. It is also possible that the 65 percent response may be, in part, a result of the respondents wanting to give the correct answer or to avoid providing the wrong answer.
Graphic: FIGURE 3. Distribution of Responses to "Have You Seen This Sign in Virginia for the Existing and Proposed Signs?" Data shown in table below.
| Yes | No | |
|---|---|---|
| Existing Sign | 77.6% | 22.4% |
| Proposed sign | 64.8% | .35.2% |
Survey Question 2 - "What do you think the sign means?"
Question 2 was intended to elicit how well respondents understood the meaning of each sign. Responses indicating "flagger ahead" were coded as correct, while responses of "workers ahead" or "slow down" were coded to be substantially correct. The substantially correct responses were interpreted as indicating that the respondent understood that the sign meant the driver is approaching a work zone and should exercise caution. The remaining responses, "children present" and "stop ahead," were coded as incorrect. In conjunction with the unpublished 1987 FHWA study, the "stop ahead" response was coded as incorrect because it was interpreted to be a potential safety problem if drivers were influenced to make an unwarranted stop upon encountering the sign. The percent distributions of correct, substantially correct, and incorrect responses to question 2 for the existing and proposed signs are shown in Figure 4. These percentages seem to indicate that the meaning of "flagger ahead" may be more successfully conveyed by the existing sign depicting the worker holding the flag than the proposed sign. However, it should also be mentioned that the presence of the word "flagger" in the list of possible choices may have biased the survey responses to question 2 for the existing sign, since it clearly showed a picture of a worker holding a flag. In other words, respondents may have simply deduced the correct answer by "matching" the symbol with the term flagger. The rate of substantially correct responses was similar for both signs. The rate of incorrect responses, however, was substantially higher for the proposed sign.
Graphic: FIGURE 4. Distribution of Answers to "What Do You Think This Sign Means For the Existing and Proposed Signs?" Data shown in table below.
| Accuracy of Answer | |||
|---|---|---|---|
| Sign | Correct | Substantially Correct | Incorrect |
| Existing Sign | 76.5% | 22.3% | 1.2% |
| Proposed Sign | 52.3% | 23.9% | 27.5% |
Survey Question 3 - "Where would you expect to see this sign?"
Survey question 3 was administered to ascertain whether or not motorists correctly anticipated the driving context in which the sign would be encountered. The percentage distribution of correct responses to this question for the existing and proposed signs is shown in Figure 5. The correct response was "near roadwork." There were no specific choices on the questionnaire that were to be coded as substantially correct. Although the questionnaire instructed respondents to check only one answer, some checked more than one in certain instances. Responses that included the correct answer in addition to an incorrect answer were coded as substantially correct, with the assumption that the respondent knew to expect the sign in a work zone, but thought it might also be used in other applications. Any response not containing "near roadwork" was coded as incorrect. It is clear from both survey questionnaires that most motorists correctly associated the signs with roadway work zones.
Graphic: FIGURE 5. Distribution of Answers to "Where Would You Expect to See This Sign for the Existing and Proposed Signs?" Data shown in table below.
| Accuracy of Answer | |||
|---|---|---|---|
| Sign | Correct | Substantially Correct | Incorrect |
| Existing Sign | 96.4% | 0.3% | 3.3% |
| Proposed Sign | 91.4% | 0.8% | 7.8% |
Survey Question 4 - "What would you do if you saw the sign while driving?"
This was considered the most important question in the survey. The previous two questions were intended to determine the level of knowledge motorists possessed about the signs. This allowed respondents to identify the probable driving action they would take after encountering each sign. Previous studies have addressed the relative importance of the driving response to warning signs as being more significant than their understanding of these signs (3, ). The response choices included one correct answer (be prepared to stop), two substantially correct answers (slow down and proceed with caution), and one incorrect answer (stop). The percent distribution of correct, substantially correct, and incorrect responses are shown in Figure 6 for both signs. Interestingly, the proposed sign garnered a larger percentage of responses in both the correct and incorrect categories.
Graphic: FIGURE 6. Percent Distribution of Answers to "What Would You Do If You Saw this Sign While Driving?" Data shown in table below.
| Accuracy of Answer | |||
|---|---|---|---|
| Sign | Correct | Substantially Correct | Incorrect |
| Existing Sign | 65.6% | 32.4% | 2.0% |
| Proposed Sign | 78.7% | 17.1% | 4.2% |
Statistical Analysis
Statistical analyses were performed on the response data for questions 1 through 4. Chi-square (C2) analysis was employed to test the null hypothesis, H0, that the distribution of correct, substantially correct, and incorrect responses was the same for both signs. The null hypothesis was rejected in the case of all four questions, confirming the differences apparent in the data.
For question 4 ("What would you do if you saw the sign while driving?") the data and C2 results suggested that the rate of correct responses for the proposed sign was statistically higher than the rate for the existing sign. A statistical comparison between the rate of correct responses was then performed The z test was then used to test the null hypothesis, H0, rate of correct responses for the existing and proposed signs are equal. Use of the z test requires the assumption that the sample population approximates the actual population and is characterized by a normal distribution. These conditions are generally satisfied with large sample sizes (6 ). The difference between these rates was calculated to be 0.13, indicating a 13 percent higher rate of correct responses for the proposed sign than the existing sign. The null hypothesis was rejected, and it was concluded that the rate of correct responses for the proposed sign was significantly higher than the rate for the existing sign. The z test was also performed for the incorrect responses, and for the combined correct and substantially correct responses. Although the differences for both tests were statistically significant in favor of the existing sign, at 2.2 percent, it was not considered practically significant. A difference of at least 5 percent was assumed practically significant.
Comparison with Previous Study
Table 1 displays selected results of both the 1987 FHWA study and this study for comparison. The results of the survey indicate that the meaning of the existing flagger sign, as specified by the FHWA, was more readily identified for the existing sign than the proposed sign that depicted the worker holding a STOP/SLOW paddle. Based on an interpretation of the sign as meaning "flagger ahead," the existing sign garnered 76.5 percent correct responses. Conversely, the proposed sign was correctly interpreted by 52.3 percent of the survey respondents. These results are in general agreement with those reported in the original FHWA study of alternative advanced warning signs for flagging operations.3 When presented with a possible choice of "traffic control personnel ahead" in lieu of "flagger ahead," 67 percent of the respondents in an additional survey correctly chose that answer.
Both signs were correctly identified as being associated with road work operations in the current study. In the 1987 FHWA study, 50 percent of the responses associated the paddle sign with driving situations other than roadway work zones or construction activity. More than 30 percent of the study subjects associated the paddle sign with a school crossing.3 Less than 8 percent of the survey respondents in the current study incorrectly identified the driving context in which the proposed paddle sign would be encountered. This suggests that the increased usage of the STOP/SLOW paddle over the decade since the original study has made drivers more aware of the paddle and its traffic control function.
With regard to what the drivers would do when they saw each sign, the original FHWA study reported that the paddle sign received 36 percent correct responses and the original flagger sign received 11 percent.3 The current study indicates that the correct driving response was identified for the proposed paddle sign by 79 percent of the respondents. On the other hand, the correct driving response was identified for the original flagger sign by 66 percent of the respondents.
| Which Study | Existing Sign | Proposed Sign | |
|---|---|---|---|
| Correct Sign Meaning | 1987 FHWA | 100 | 45 |
| This study | 76.5 | 52.3 | |
| Incorrect Sign Location | 1987 FHWA | 50 | |
| This study | 17.8 | ||
| School Crossing | 1987 FHWA | 30 | |
| This study | 8 | ||
| Correct Driver Behavior | 1987 FHWA | 11 | 36 |
| This study | 66 | 79 |
Survey Language
The Relationship between Sign Meaning and Expected Driving Behavior
Nearly 30 percent of the responses to question 2 for the proposed sign were coded as incorrect, indicating that a large percentage of respondents failed to correctly interpret the sign’s meaning. It was not entirely clear that a multiple-choice response of "stop ahead" necessarily indicated a lack of understanding of the sign’s purpose. It is unlikely that a driver would actually stop upon encountering an orange and black advanced warning sign.
The incorrect responses to question 2 on the signs’ meaning were reexamined in more detail. Of the 160 incorrect responses to the question, 145 (91 percent) were "stop ahead" and 15 (9 percent) were "children present." The distribution of responses to question 4 among those individuals providing "stop ahead" responses to question 2 was summarized. A clear majority of the incorrect "stop ahead" responses to question 2 (79.6 percent) were accompanied by correct "be prepared to stop" responses to question 4. Therefore, even though approximately 30 percent of the survey respondents indicated "stop ahead" as their choice for question 2, the majority of them indicated in the survey that they would have engaged in the preferred driving response to the proposed advance warning sign and thus would have prepared themselves to stop. The combination of these two answers suggest that what the respondents say they would do is correct, although what they say the sign means is incorrect.
Flagger Versus Traffic Control Personnel
If one sees an image of a person holding a flag, there is built-in bias in favor of a response of flagger ahead when asked about the sign’s meaning. This response may not be provided as readily when an image of a person holding a paddle is shown. In other words, the existing sign may have a better chance of being correct because the word flagger is in one of the multiple-choice answers.
The effect of word choice on the interpretation of the meaning (question 2) was further revealed through a supplemental mail-out survey. Approximately 200 additional proposed sign questionnaires were mailed out in the Charlottesville area and 71 completed surveys were returned. The questionnaires were identical to those used in the original mail-out survey, with the exception that the possible choice "flagger ahead" was replaced with the term "traffic control personnel ahead." More than two thirds of the respondents correctly answered to the revised questionnaire, where it stated, "traffic control personnel ahead," whereas only half responded "flagger ahead" to the original survey. These results indicate that the motorists were more likely to identify the symbol as connoting manual traffic control ahead rather than with the specific term flagger.
The Influence of the Shape of a Stop Sign
Regardless of the term used to identify work zone traffic control personnel or the meaning of the sign, a larger percent of the respondents indicated that they would be prepared to stop in response to the proposed sign rather than the existing sign (question 4). A possible reason that the proposed sign received more "be prepared to stop" responses than the existing sign is tied to the very reason that spurred the initial resistance to its usage. The unpublished 1987 FHWA study indicated that drivers interpret the octagonal shaped sign that the worker is holding as a "STOP" sign (3). In actual practice, the paddle contains a conventional (red and white) "STOP" sign and an orange and black "SLOW" sign on the reverse side. The fact that drivers may associate the silhouette as a "STOP" sign suggests that drivers may be more prepared to stop than if they had encountered a sign depicting a worker with a flag.
Concerns with the Choices for the Expected Driving Response
With respect to the language used in the survey questionnaire, there is a very subtle difference between the possible choices for the expected driving response (question 4). "Slow down," "proceed with caution," and "be prepared to stop" are all very similar responses. A few survey respondents actually checked all three answers and wrote a comment on the questionnaire form indicating that they considered the three choices to be redundant. It is plausible that a driver would slow down and proceed with caution in preparing themselves to stop.
Consequently, the "be prepared to stop" response is not the only correct response, but was only designated as such in order to provide a direct comparison to the unpublished 1987 FHWA study. A 1998 informational pamphlet on work zone safety published by the FHWA did not mention this term when describing the existing flagger sign’s meaning. The pamphlet states that: "The symbol means that a flagger is ahead directing traffic in the work zone. When you see this sign, it’s time to be cautious, be alert to conditions around you, slow down and watch for other directions or information"(7).
Comparing a Single Sign Versus a Series of Signs in a Work Zone
In this study, survey data were obtained on a single sign, either for the existing or the proposed advanced flagger warning sign. This approach was simple and made the mail-out survey easy. It was also used to allow a comparison with the unpublished 1987 FHWA study.
In work zones, a series of signs are used to inform and direct motorists. Figure 7 shows the traffic control layout for a typical flagging operation on a two-lane road in Virginia (8). The third sign, "Be Prepared to Stop," informs the motorists of what they are expected to do. The advanced flagger warning sign warns of a flagger ahead and identifies the traffic control device that will inform the motorists whether or not to stop ahead. The survey asked for responses to a single sign and not the entire context of traffic control in which the sign would be encountered. It is likely that the answers to the survey would have been influenced by the series of signs. The "Road Work Ahead" sign identifies the location or condition that is ahead. The "Be Prepared to Stop" sign is likely to affect the response regarding what drivers would do when they see the study sign. (This sign is not included in the typical layout for flagging operations in the MUTCD.)
Alternative Points of View
It is acknowledged that an argument in support of the existing sign could be made based on the survey data. For example, if emphasis were placed on the results of question 2 on sign meaning, the results would favor the existing sign. Given that the data may be interpreted in this manner, the survey results, at a minimum, imply that on balance, the proposed sign performs as well as the existing sign.
The logical argument about accuracy of the symbol depicted in the sign, that is, having the advance warning sign display the device that the flagger will be holding–would favor the proposed sign. Having the warning sign accurately depict the conditions ahead is desirable. Given the similarity between the existing and proposed advanced flagger warning signs, the influence of the series of signs that are encountered, the issues regarding survey language, and the accuracy of sign symbols–all of these may be viewed as key reasons for deciding in favor of the proposed sign.
Conclusions
- The proposed sign accurately symbolizes what the motorist will see based on previous research.
- The correct meaning of the existing sign was clearer to more respondents than the proposed sign. Designation of the word "flagger" as the only correct interpretation of the sign appeared to be biased in favor of the existing sign. Recognizing that the stop sign symbol is an important component of the symbol on the proposed sign, defining "stop ahead" as an incorrect response was considered debatable.
- More respondents associated the desired driving behavior with the proposed sign than the existing sign. Asking what drivers would do when they see a sign is a better measure than asking what the sign means.
- The proposed sign performs as well as, if not better, than the existing sign.
- The concept of only one "correct" driving response was questioned and the argument was made that the actual number of respondents providing suitable descriptions of their probable reactions to the proposed sign was greater than 95 percent.
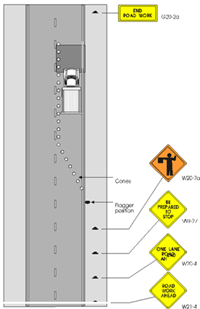 |
Figure 7 shows a two-lane road with a work zone marked by a series of cones protecting the work zone. The cones are preceded by a series of signs:
After this last sign, the wok zone begins. Its end is marked by a sign "End Work Zone". |
References
1. Federal
Highway Administration. Standards and Guides for Traffic Controls for
Street and Highway Construction, Maintenance, Utility, and Incident
Management Operations. Part IV of the Manual on Uniform Traffic Control
Devices (MUTCD). 1988 Edition of the MUTCD, Revisions 3. Washington,
DC., 1993.
2. Alicandri, E., Walker,
J., and Roberts, K. 1987. Comparison of Flagger Symbols. Federal
Highway Administration. McLean, VA. Unpublished data
3. Paniati, J. Redesign
and Evaluation of Selected Work Zone Sign Symbols. In Transportation
Research Record 1213, TRB, National Research Council, Washington,
D.C., 1989, pp. 47-55.
4. Swanson Transportation
Consultants, Inc. Symbol Signing for Older Drivers. Report FHWA-RD-94-069.
FHWA, U.S. Department of Transportation, 1997.
5. Stokes, R. W., M. J. Rys,
E. R. Russel, and J. Kerbs. Motorist Understanding of Traffic Control
Devices in Kansas. Report No. K-Tran: KSU 94-7. Kansas State University
and Kansas Department of Transportation. Topeka, KS, 1995.
6. Agresti, A. and B. Finally.
Statistical Methods for the Social Sciences. Second Edition. Dellen
Publishing, San Francisco. 1986.
7. Federal Highway Administration.
Get the Picture. Listen to the Signs. FHWA-SA-98-089. U.S. Department
of Transportation, Washington, DC. , 1998.
8. Virginia Department of
Transportation. Virginia Work Area Protection Manual. Richmond,
Virginia, 1996.