Work Zone Fatality Reduction Strategies
slide 1: Work Zone Fatality Reduction Strategies
NCDOT – WORK ZONE TRAFFIC CONTROL SECTION
MAY 23, 2012
Steve Kite, PE
[PDF version, 319 KB]
PDF files can be viewed with the Acrobat® Reader®.
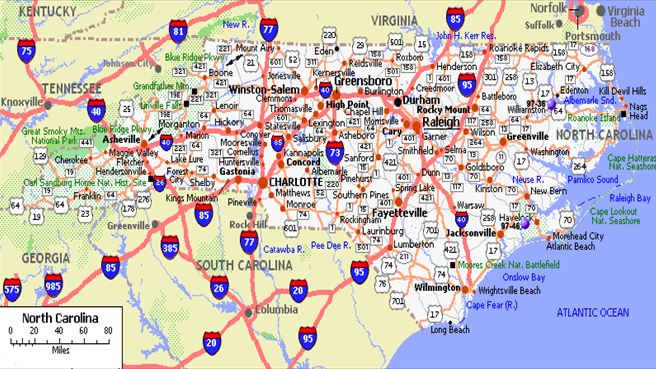
slide 2: Basic NCDOT facts
- 2nd largest state maintained road system in US, over 80,000 miles
- Over 1000 miles of Interstate
- Size is roughly 400 miles by 200 miles
- 3 Distinctly different geographical regions
slide 3: Why are we seeing a "downward" trend in WZ fatalities?
- Better drivers?
- Fewer drivers?
- Better Engineering/TMP's?
- Fewer Projects?
- Fewer "Significant" Projects
- More Law Enforcement in Work Zones?
- Better "Outreach" and Public Information?
- Better Coordination with Partners?
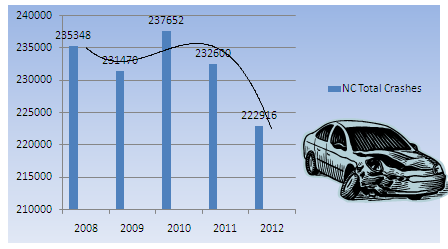
slide 4: North Carolina Total Crashes
slide 5: Work Zone Crashes
ii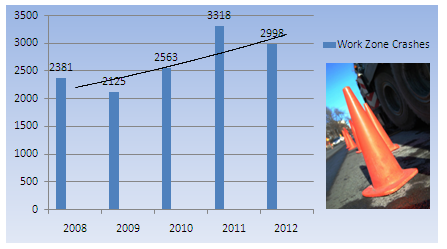
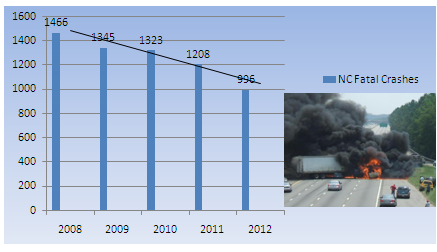
slide 6: North Carolina Fatal Crashes
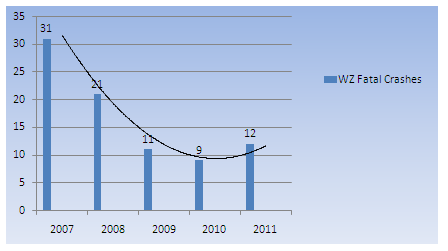
slide 7: Work Zone Fatal Crashes
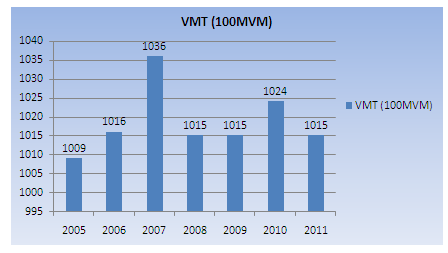
slide 8: Vehicle Miles Driven
slide 9: So...what factors are contributing to the WZ fatality reductions?
- Not a "unique" solution or strategy...it's a combination of multiple strategies and processes
- Let's face the reality...some "GOOD LUCK"!
slide 10: Work Zone Planning
- Identification of "Significant Projects" in the Scoping Process
- Investigating more "Accepted" Traffic Management Strategies to reduce Project Durations
- Using more "innovative" contracting approaches for the "Significant" Projects
slide 11: 1. Identification of Significant Projects in the Scoping Process
- This is a coordinated effort between the Work Zone Traffic Control Section, Planning Engineers and the Divisions
- This begins at the Scoping Timeframe
- It initiates more conversation/discussion about Traffic Management Strategy selections and Project Durations
slide 12: 2. Investigating more "Innovative" Traffic Management Strategies to reduce Project Durations and Cost
- Full Road Closures
- Partial Road Closures
- Cross-Over Strategies
- "System-wide" Improvements
- Utilization of more Department Owned Assets (Permanent ITS and IMAP Services)
slide 13: 3. Using more "innovative" contracting approaches for the "Significant" Projects
- Design/Build
- Letting larger projects instead of a series of projects
- Utilizing the Contractor/PEF Team approach to delivering projects faster with innovative designs
- Accelerated Construction to match the Traffic Management Strategy (i.e., full closure)
- "A+B" Bidding
- Incentive payment contracts for early completion
slide 14: Work Zone Management
- Utilization of Project Coordination Teams consisting of Incident Mgt, State Highway Patrol, Construction Personnel, Contractors, WZTCS, Division Traffic.
- Utilization of the "HAWKS" program to increase Law Enforcement in High Risk Work Zones
- Access/Availability to work zone crash information in a reasonable timeframe
- Better Public Information Outreach Efforts
- Enhancement of Speed Reduction Criteria to allow for "short term" speed limit reductions
slide 15: 1. Utilization of Project Coordination Teams for "Significant" Projects
- Utilization of Project Coordination Teams consisting of Incident Mgt, State Highway Patrol, Construction Personnel, Contractors, WZTCS, Division Traffic.
- These teams meet monthly to discuss on going issues related to trends in crashes, wz congestion, upcoming traffic switches etc.
slide 16: 2. Utilization of "HAWKS" Program
- "HAWKS" – Helping All Work Zones Keep Safe
- Made up of "off duty" Highway Patrolman
- 80% reimbursement by FHWA
- Coordinated with Resident Engineer's Office to alert them when their services are needed
- Projects selected based on prior crash history and historical data related to speeding
slide 17: 3. Access/Availability of WZ Crash Data
- WZ Crash Data is being supplied more timely and consistently
- This data is shared with Project Coordination Teams
- Discussion takes place about location and types of crashes currently being witnessed by Project Coordination Team
- Recommendations provided to Resident Engineer and the Division for possible incorporation
slide 18: 4. Outreach Efforts
- Leveraging the Rulemaking to increase public information through local media outlets
- Increasing the use and capabilities of the portable changeable message signs
- Posting more videos/public service messages on public media sites such as Facebook and Twitter
slide 19: 5. Enhancement of Speed Reduction Criteria
- Established separate criteria for short-term speed limit reductions versus long-term
- Revised criteria for speed reductions and speeding penalties
- Better enforcement of these and better "COMPLIANCE" by motorists of these.
slide 20: Can North Carolina maintain the Current Trend?
- No one knows for sure, but as the economy improves so will ridership and crashes will increase
- The biggest threat to overall highway safety is distracted driving through the use of cell phones and various other e-gadgets
- What will we do to combat these ongoing issues?