Reduced Work Zone Fatalities in California
slide 1: Reduced Work Zone Fatalities in California

[PDF version, 467 KB]
PDF files can be viewed with the Acrobat® Reader®.
slide notes:
Tell them my background and involvement with SHSP.
slide 2: California's Strategic Highway Safety Plan
- Teams formed in November 2005.
- More than 300 stakeholders.
- SHSP approved September 26, 2006.
http://www.dot.ca.gov/hq/traffops/survey/SHSP/SHSP-Booklet-version2_%20PRINT.pdf - Implementation Plan published April 4, 2008.
http://www.dot.ca.gov/hq/traffops/survey/SHSP/ISHSP-Final-04212008.pdf- 16 Challenge Areas, 152 Actions.
slide notes:
Who is part of CA14. How often do we meet. How do we meet.
slide 3: The SHSP is Data Driven
- Work Zone Challenge Area goal:
By 2010, reduce fatalities in California work zones by 10% from their 2004 level (109). - Each action was to be attainable, measurable, and focused on a known problem area.
slide notes:
UC Berkeley worked with us to supply data. But we really didn't have much. One thing we learned was that 26% of all work zone fatalities occur as a result of end of queue collisions.
slide 4: Original Actions Are All Complete
- 14.01 Joint work zone training for CHP and Caltrans.
- 14.02 Improve collection & analysis of work zone crash data.
- 14.03 Encourage use of dynamic merge systems to reduce end of queue collisions.
- 14.04 Permanently fund Slow for the Cone Zone campaign.
slide notes:
None.
slide 5: Original Actions Are All Complete
- 14.05 Encourage use of more and better mobile barriers and attenuators.
- 14.06 Increase work zone training for all workers.
- 14.07 Encourage use of full closures.
- 14.08 Develop lane closure data system.
- 14.09 Encourage use of Safety Edge.
slide notes:
None.
slide 6: Original Actions Are All Complete
- 14.10 Evaluate work zone language in driver handbook and recommend changes.
- 14.11 Change new product evaluation system to speed use of innovative products.
- 14.12 Develop typicals and guidance for bikes & peds in work zones.
- 14.13 Project specific websites.
- 14.14 Best practices for purchasing new technology.
slide notes:
None.
slide 7: Latest Data
- Actual number in 2010 was 41 equal to a 62% reduction.
- The total number of fatalities has fallen each and every year since 2007.
- New data suggests most crashes occur near activity area not the transition area.
- New data suggests most crashes are due to improper lane changes and following too close/ excessive speed.
slide notes:
None.
slide 8: What Worked?
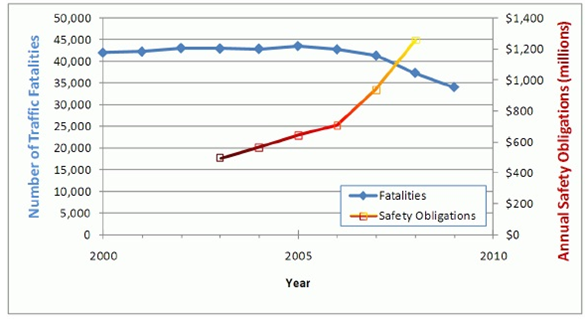
- Highway Safety Improvement Program (HSIP)
- SAIC study examined the nationwide reduction in roadway fatalities.
- Isolated trends due to seat belts, safer vehicles, etc.
- Found that for every $1 million obligated, societal costs of $24 million were saved.
slide notes:
None.
slide 9: What Worked?
- Importance of collaboration.
- 4 E's were essential.
- Participation by industry and community stakeholders.
- All contributed to a more effective plan, a more workable plan, and commitment across the board.
slide notes:
None.
slide 10: What Worked?
- Importance of Buy-In from Leadership
- Each agency commits resources up front to see it is completed.
- In some cases multiple agencies may contribute funding.
- As problems are encountered leadership helps find ways around them.
slide notes:
None.
slide 11: What Worked?
- Some actions became possible that were not without the SHSP.
- Multi-year funding for Slow for the Cone Zone.
- Interagency actions are more cooperative.
- Training for law enforcement in work zones.

slide notes:
None.
slide 11: What's Next?
- One new action approved: 14.15 Work Zone Tool Kit
- More in development:
- Transverse rumble strips.
- Continued and improved data collection.
- Speed reduction techniques for maintenance.
- Detailed data will help us identify problems and better target our efforts and resources.
slide notes:
None.
slide 12: Contact
Joe Jeffrey
Road-Tech Safety Services
(530)672-0222
joe@road-tech.com