Traffic Analysis Tools Volume IX: Work Zone Modeling and Simulation
A Guide for Analysts
Woodrow Wilson Bridge Reconstruction
Maryland State Highway Administration and the Virginia Department of Transportation
Woodrow Wilson Bridge Reconstruction
| Work Zone Characteristics | |
|---|---|
| Transportation Analysis: | |
| Approach | Sketch-Planning Mesoscale Microscale |
| Modeling Tools | QuickZone HCM CLV VISSIM CORSIM |
| Work Zones: | |
| Type | Type I |
| Network Configuration | Network |
| Geographic Scale: | |
| Work Zone Size | Small |
| Analysis Area | Metropolitan |
Overview
The replacement of the Woodrow Wilson Bridge (WWB), along Interstate 95 in the Metropolitan Washington, DC area, is an extremely large and complex construction project requiring the close coordination of numerous contractors and various state and local government agencies. The Woodrow Wilson Bridge carries upwards of 100,000 vehicles per day along Interstate 95 which spans the Potomac River. The Woodrow Wilson Bridge Project spans a 7.5 mile-long corridor extending from the MD 210 interchange in Maryland to Telegraph Road in Virginia, crossing over the Potomac River. The current 6-lane bridge is being replaced with a dual-span bridge that will more than double the number of traffic lanes. See Figure 34 for an overview of the construction site.
The management of the construction project primarily involves the Maryland State Highway Administration (MD-SHA) and the Virginia Department of Transportation (VDOT) who are responsible for overseeing daily operations of the construction site including scheduled lane closures. An important aspect to the replacement of the Woodrow Wilson Bridge is to maintain current roadway capacity during peak periods while construction takes place. This requires limited, if any, lane closures during peak periods and daylight hours. In general, any necessary lane closures were conducted at night to minimize the impact on drivers.
Due to the complexity of the project, the Woodrow Wilson Bridge Project is being completed under several phases over the span of more than a decade. In addition to the new bridge construction, a number of interchanges also have to be reconfigured both on the Virginia and Maryland sides to join to the new bridge alignment. With several jurisdictions involved, the long duration of the project, and 100,000 vehicles per day utilizing the bridge, traffic management during construction of the bridge and interchanges was a major concern. There were several types of work zones implemented throughout this project with which several different work zone modeling tools were used including the following:
- Lane Closure Analysis: CLV
- Roadway Operations Analysis: CORSIM
- Roadway Closure Analysis: QuickZone
Work Zone Characteristics
The Woodrow Wilson Bridge reconstruction project affected several miles of major roads and interchanges in two states including I-95/I-495 (Capital Beltway) from Maryland to Virginia, I-295, MD 414, and MD-210 in Maryland, and Telegraph Road, Route 1, and Washington Street in Virginia. To keep traffic moving throughout the longevity of the project, the construction work for the Woodrow Wilson Bridge project had to be completed in many steps instead of one large work zone. Work zone plans had to be developed for each step of this construction project and therefore, the Woodrow Wilson Bridge Project work zones are categorized as the most severe, Type I, work zones.
The Woodrow Wilson Bridge team faced many challenges in developing work zone plans, implementing detours, and maintaining traffic patterns while minimizing delays. In addition, the possibility of traffic delays and the visibility of this project made it imperative to provide accurate traffic information to commuters using the bridge during its reconstruction. The complex nature of the work zones on this project required extensive analysis of traffic impacts caused by work zones and traffic detours. The Woodrow Wilson Bridge team used several different work zone analysis tools to provide insight regarding traffic impacts and also predict delays to the public. Figure 34 shows the different work zone analysis tools used in this project.
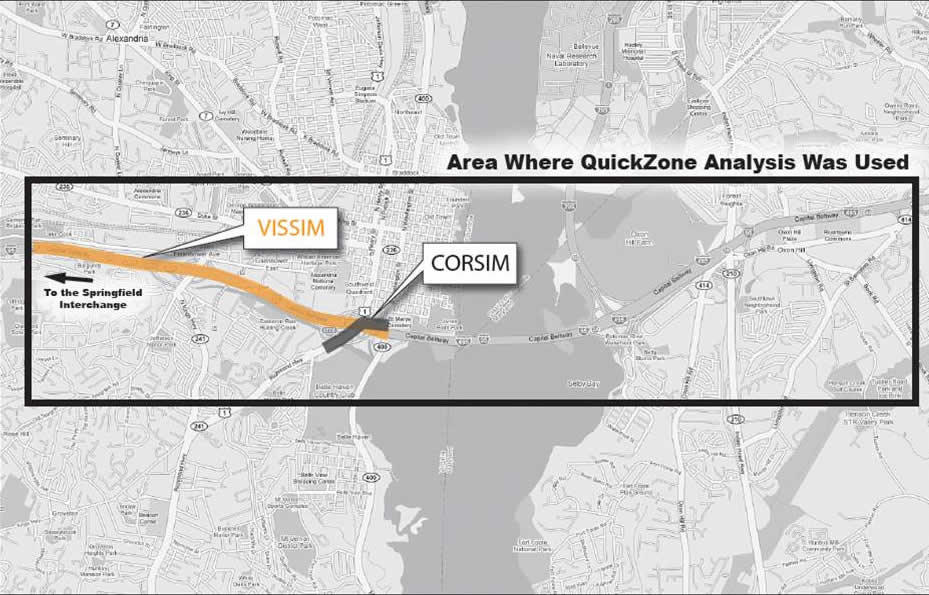
Figure 34 Analysis tools used for the Woodrow Wilson Bridge Reconstruction Project
Transportation Management Plan Strategies
Traffic engineers on this project had the challenge of dealing with designs and maintenance of traffic (MOT) plans from two different jurisdictions. In addition, Virginia and Maryland had different philosophies for their MOT plans. The MOT plans for the Maryland side were very detailed and utilized models to evaluate their MOT phasing for some of their contracts including Synchro, Critical Lane Volume (CLV) and Highway Capacity Software (HCS). In addition, they used CLV to obtain hourly and 15 minutes traffic volumes during the construction phase. Conversely, the MOT plans for the Virginia side were much more fluid and changed significantly during the construction phase. They used both Synchro and QuickZone analysis during the construction phase to evaluate their work zone impacts.
There were numerous work zone plans required for the Woodrow Wilson Bridge Project varying between a Type I and Type III work zone. For example, the first use of QuickZone was for a Type III work zone associated with the reconstruction of the Maryland 210 interchange. There were three Type 1 work zones occurring throughout the project which involved major traffic switches and disruption to the traveling public. The first was a full closure of the bridge during overnight hours in the spring of 2006. The second and third involved two major traffic switches during the summers of 2005 and 2006. The following will provide an overview of each of the four work zones mentioned previously.
- Fall 2001 MD 210/I-295 Interchange Reconstruction (QuickZone) — In the fall of 2001, a contractor for the Maryland State Highway Administration was in the process of constructing one of many new bridges as part of the replacement and refurbishment of the Woodrow Wilson Bridge at the MD 210/I-295/I-95 interchange just east of the Potomac River shoreline (Figure 35). The construction involved the demolition of existing bridges and the construction of new bridges. The plan included closing lanes during the overnight hours (midnight to 4:00am) and two temporary openings in the median barrier in order to divert traffic safely around the construction area while construction was taking place. This work zone plan configuration was scheduled to take between 4 and 6 months to complete.
The need for QuickZone arose when the contractor determined that to more efficiently utilize available resources, a four-hour window of construction would not be sufficient. The original work zone plan had lane closures occurring between midnight and 4:00am and the contractor estimated it would take 1.5 hours for work zone set up and take down, leaving 2.5 hours of actual production time. The analysis required a quick turn-around of multiple scenarios of when lane closures could take place without severely impacting motorists so that the contractor could extend lane closure durations. - Summer 2005 US 1 Traffic Switch (CORSIM) — During Summer 2005, the US Route 1 Interchange contract was completed and included new ramp connections to the bridge. A traffic switch was needed to move from the old ramp connections to the new alignment as seen in Figure 36. This was a major undertaking and detailed traffic information was needed to assess the impacts to traffic. The design of the new alignment was complex and included a flyoverramp from southbound Route 1 to the northbound ramp of I-95. The engineers used CORSIM to analyze the switch because there were ramp alignment questions that could be answered with this software. The analysis took approximately 4 months (from late 2004 to early 2005). They used count data for the ramps that were performed in 2003 and mainline count data that were obtained from cameras mounted at the site.
- Spring 2006 MD 210 Girder Placement (CLV Analysis) — In the spring of 2006, a contractor for the Maryland State Highway Administration was in the process of replacing the MD 210 Bridge that goes over the I-495 Beltway. As part of this work, the contractor needed to erect very large steel girders for the MD 210 Bridge. The contractor could not place the girders while traffic was moving because the work would be done above the Beltway (I-495). The original plan included 15 minute lane closures for the placement of these girders but due to their large size, it was clear that the work could not be completed in these short time spans. Instead, all lanes of the Beltway (I-495) in both directions approaching the Woodrow Wilson Bridge were temporarily closed overnight for several consecutive nights. The traffic engineers on this project developed a plan to detour traffic during the full closure as seen in Figure 37. It was very important that the Woodrow Wilson Bridge team analyze the impacts to the capacity of traffic based on the detour route. They needed to find out what the volume needs would be during the closure and therefore used CLV analysis to obtain the critical lane volumes and figure out how the detour would affect capacity.
- Summer 2006 Traffic Switch (QuickZone) — In the summer of 2006, the first of the two new WWB bridges was completed. A major traffic switch was performed on both the inner and outer loops of the beltway, as shown in Figure 38 and Figure 39, respectively, where all of the traffic needed to be switched from the old bridge to the new bridge alignment so that the old bridge could be demolished. There was pressure to provide an accurate assessment of the traffic impacts and relay those impacts to the public. The analysis was performed using QuickZone. QuickZone was chosen in part because it was very important to know accurate queues and delays due to construction and related those numbers to the WWB traffic call center. In addition, QuickZone was chosen because the switch would result in higher capacity and therefore it was expected that conditions would improve due to the switch.
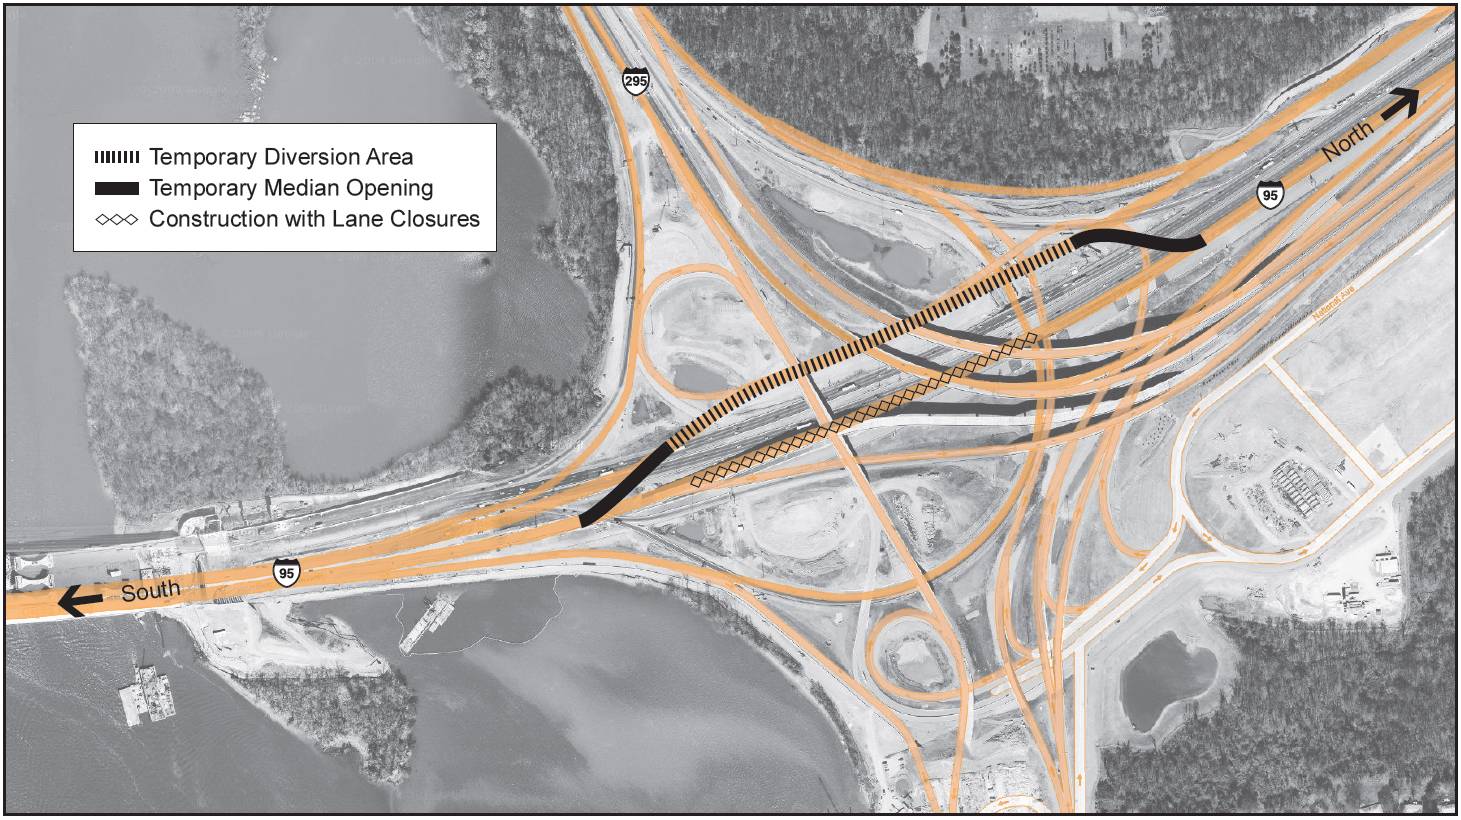
Figure 35 MD 210/I-295 Interchange Reconstruction
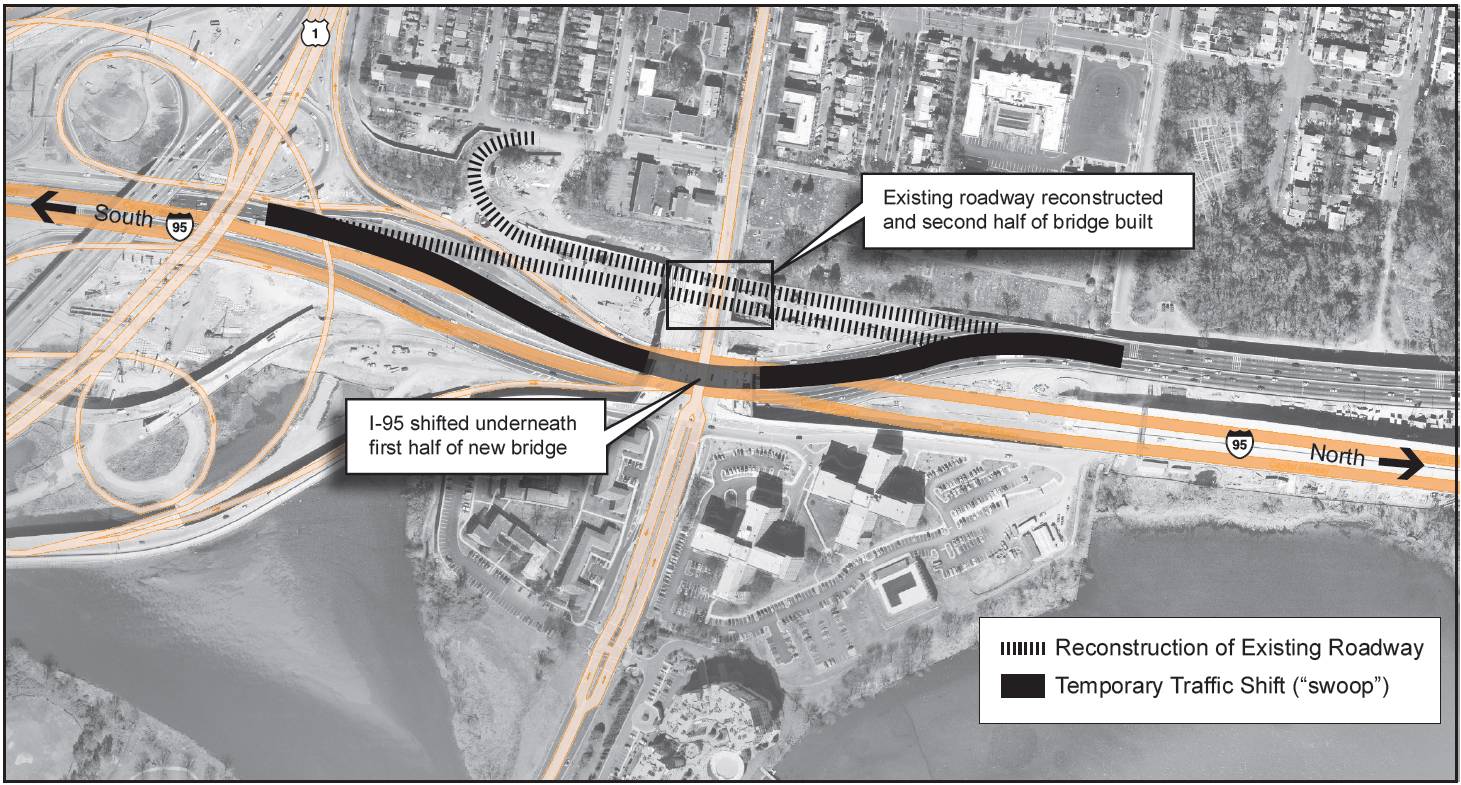
Figure 36 US 1 Interchange Traffic Switch Using CORSIM (Provided by Potomac Crossing Consultants)
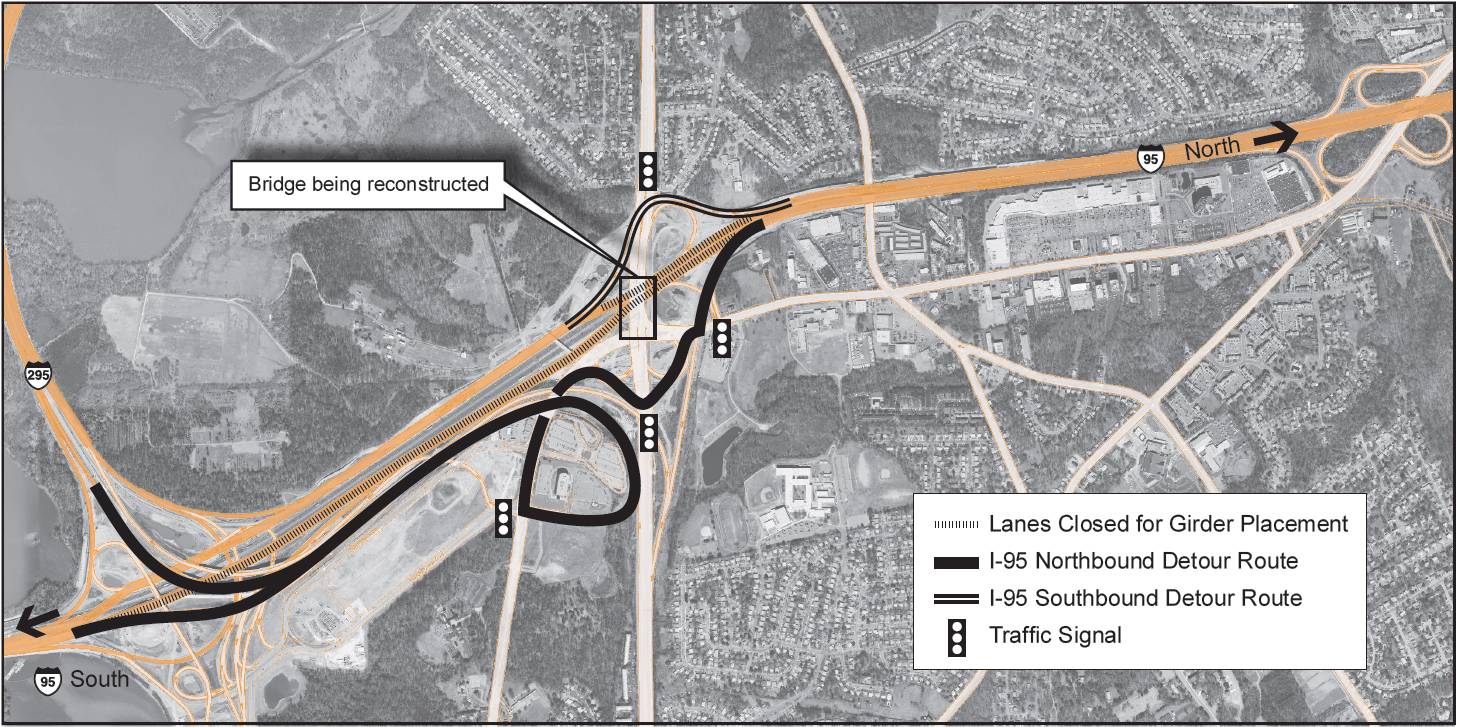
Figure 37 MD 210 Girder Placement Using CLV (Provided by Potomac Crossing Consultants)
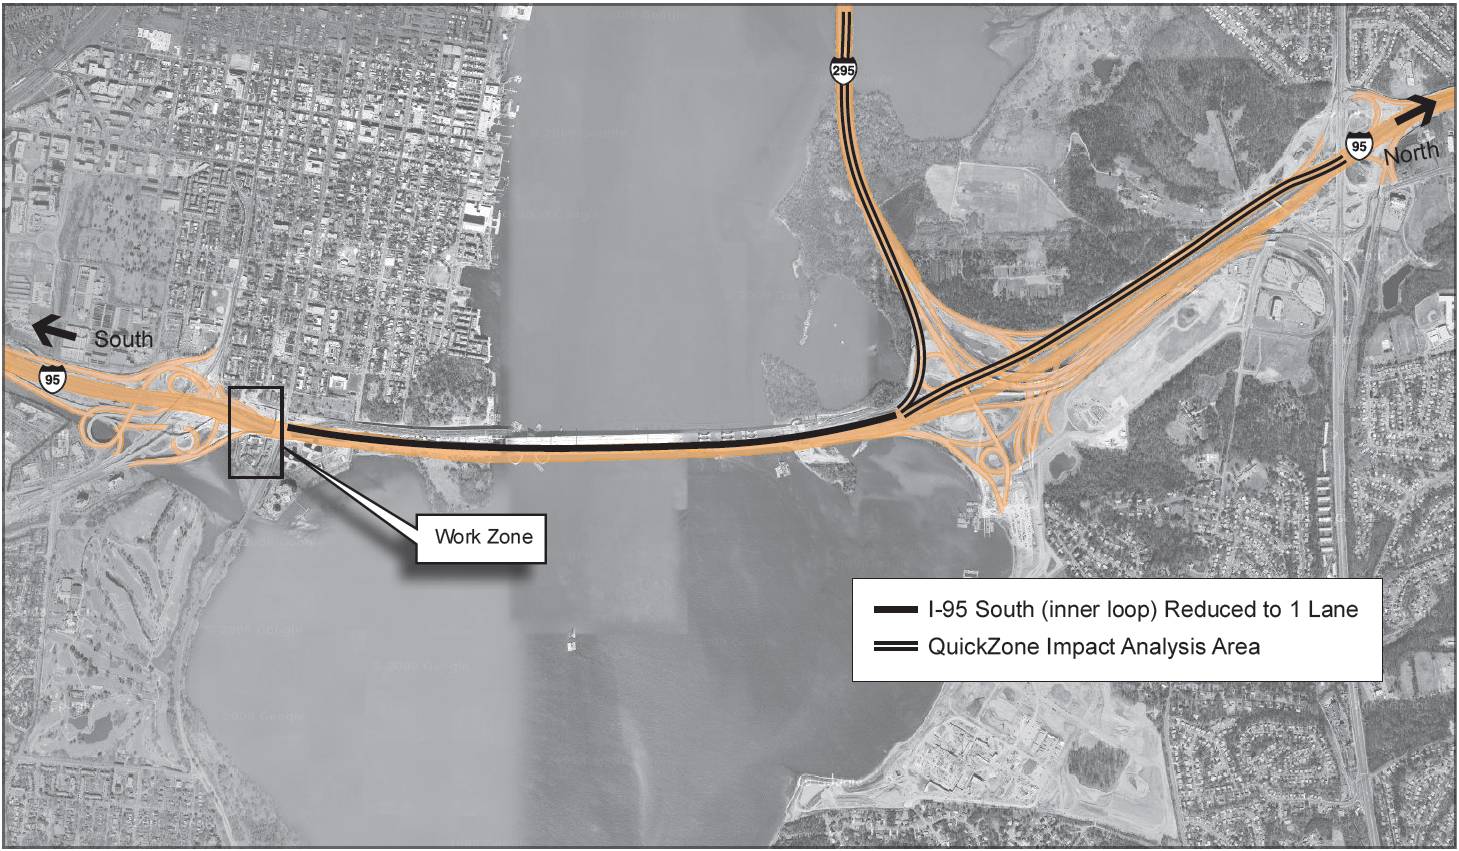
Figure 38 2006 Inner Loop Traffic Switch Using QuickZone (Provided by Potomac Crossing Consultants)
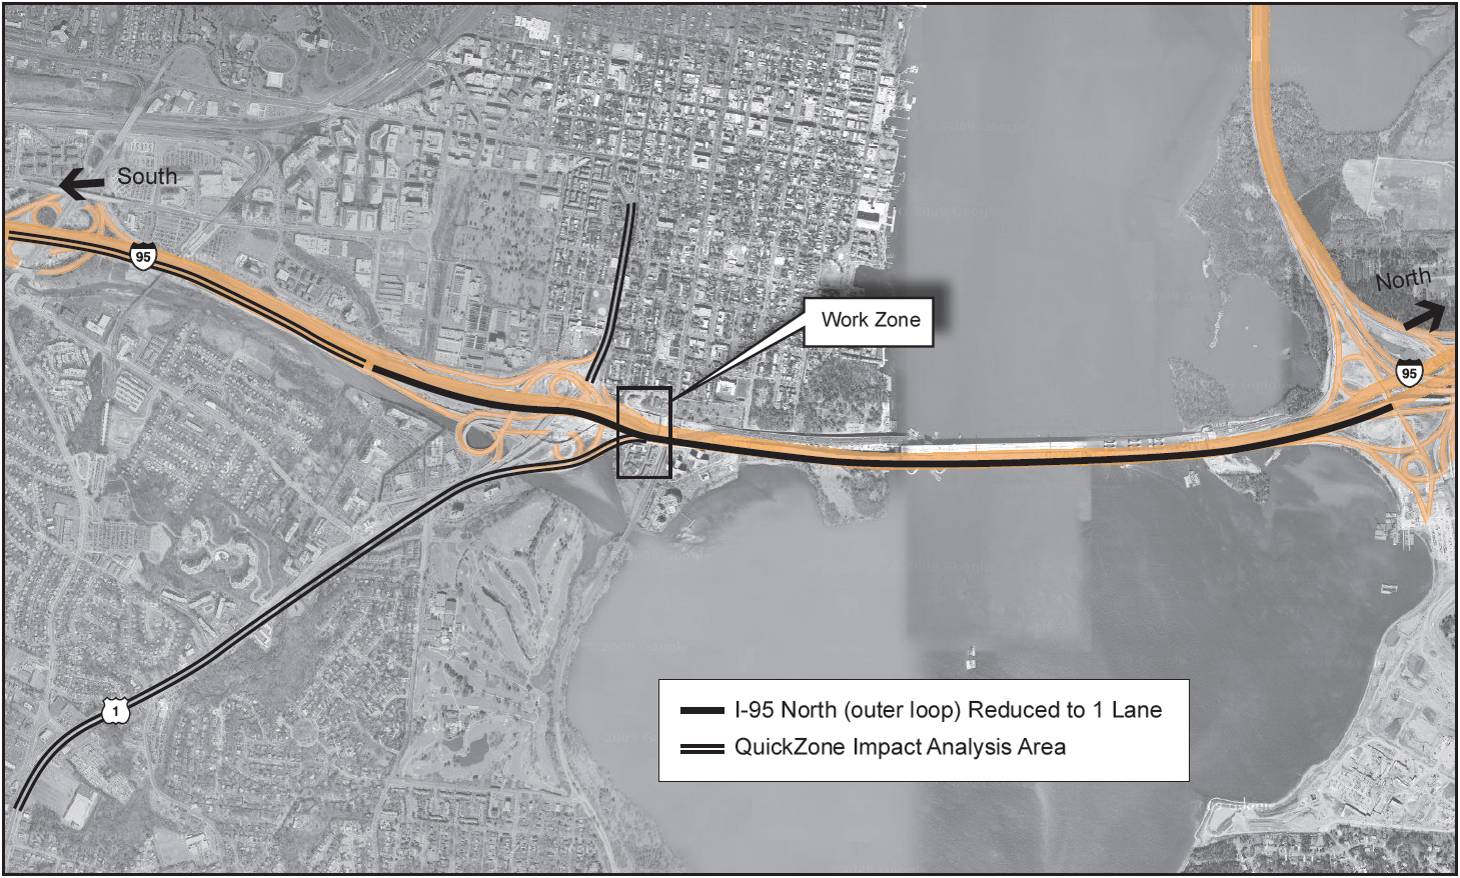
Figure 39 2006 Outer Loop Traffic Switch Using QuickZone (Provided by Potomac Crossing Consultants)
Data
Data collection was very important to the traffic analysts working on this project. Although data availability was scarce in the beginning, specifically existing volume data in Maryland, as the project continued, the analysts were able to obtain better data that was essential in the analysis of traffic impacts. These data include daily real time data on the beltway provided by Mobility Technologies, 24-hour intersection counts and tube counts taken for Virginia and Maryland, ramp data as recent as June 2007 and the entire network of Synchro files for Virginia provided by VDOT (NOVA district)
Demand data for the inner-loop was acquired from the various MD-SHA permanent traffic count stations set up prior to the construction site and available at the Maryland Roads web site (www.marylandroads.com). Demand data for the outer-loop was made available through special traffic counts conducted by the VDOT on the Virginia approach to the Woodrow Wilson Bridge. Lane capacities, lengths, and free-flow speeds were gathered from historical data.
Agency Resources
Although the management of the construction project primarily involved MD-SHA and VDOT, the joint vengture General Engineering Consultants (GEC) was hired to oversee the construction. This joint venture included Parsons Brinkerhoff, URS Corporation, Rummel Klepper and Kahl (RK&K) and several sub-consultants including 8 DBEs. GEC had on-site technical expertise with modeling software and therefore much of the simpler work zone modeling that was done periodically, such as QuickZone, was performed in house.
Work Zone Modeling Tools
In addition to the major work zones discussed previously in this case study, there were other work zone modeling opportunities throughout the project and a range of modeling tools was used to support decision-making. QuickZone was used extensively, approximately 3 to 4 times per year, to understand impacts of the open span of the bridge and discuss the impacts with the Port Authority. The analysts used QuickZone for mainline analysis but chose other software for portions of the analysis where turning movements were important. The QuickZone software is a sketch planning tool that was “developed to help state and local transportation agencies better understand and consider the impacts of work zones as they plan, design, and implement their highway projects”. This software can help estimate work zone delay and user costs, quantify corridor delays from capacity decreases in work zones, identify the impact of delay on different construction plan alternatives and estimate the impact of delay when developing mitigation strategies such as alternate routes, detours, lane closures.
Critical Lane Volume Analysis (CLV) is a planning tool that was used by the Maryland side to analyze level of service at individual intersections. CLV identifies levels of congestion at signalized intersections and it is useful because the results are easy to understand and to report to the general public. In the WWB project, hourly and 15 minute traffic volumes were provided using CLV.
Highway Capacity Software (HCS) is an operational tool that was used to model the expected added travel time that will be generated from the each construction zone. The outcome of this analysis can determine Level of Service (LOS) of the facility.
On the Virginia side, Synchro was used as a traffic signal optimization tool to understand the work zone impacts. Synchro’s outcomes include LOS, signal phasing improvements for alternate routes and detours during construction, and travel delay estimations.
For the more complex modeling, microscopic simulation tools were used including VISSIM and CORSIM. Both of these software packages can simulate the movement of individual vehicles using car-following and lane change theories. For VISSIM, a base network is set up to run test simulations under different scenarios during construction. It can evaluate delays of the multiple scenarios using variable speed limits. CORSIM outputs maximum and average queue lengths, determines LOS and provides estimations of delays in work zones.
Table of Contents | Previous | Next