2.0 Urban Freeway
2.1 Knoxville, Tennessee: I-40
Key Observations
- QuickZone can be utilized to predict likely delay impacts from a proposed full closure on a major interstate.
- The predicted delays brought to light the potential for extensive delays and helped Tennessee DOT to mobilize resources for demand management and public outreach prior to construction.
- A tiered modeling approach is a cost-effective strategy for using QuickZone. First, less detailed data is used to scope potential delays – then, enhanced travel demand and more detailed network models are employed to provide more refined estimates if necessary.
2.1.1 Overview
Connecting the mid-Atlantic region to the Midwest and central Southern states, Interstate 40 is a key east-west connection for a variety of road users ranging from freight operators to cross-country motorists. West of a key junction with I-81, I-40 carries interstate traffic to and through Knoxville Tennessee, including a series of major interchanges in the downtown area. In and around Knoxville on both I-40 and the half-beltway formed with I-640 (Figure 2.1.1), the combination of interstate and local travel demand produces recurrent delay in several locations in both morning and afternoon peak periods. In addition, summer travel demand to tourist locations to the east of Knoxville can result in near-capacity or congested conditions on various weekday and weekend afternoon and early evenings.
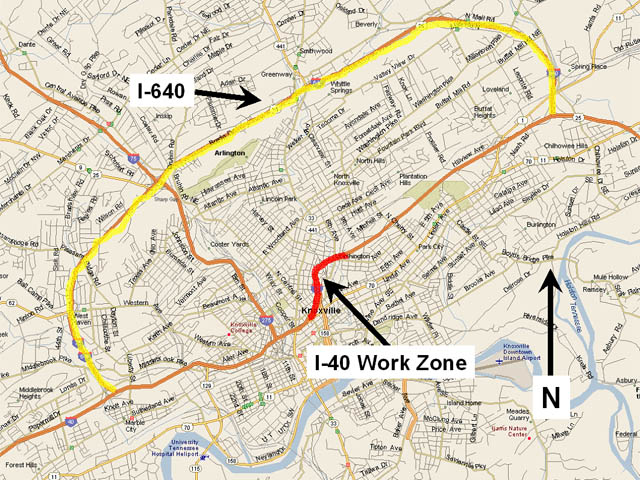
Tennessee DOT (TNDOT) identified a section of I-40 just east of downtown Knoxville as a candidate for major rehabilitation, and in 2004 began to consider various strategies to perform the needed roadwork considering construction costs, project duration and potential impact to road users. One option of interest for TNDOT was the use of a full closure to complete complex work on freeway interchanges without the maintenance of through traffic on I-40. This option had the advantage of reduced project duration, improved worker safety and potential cost savings over more traditional approaches. However, the impact on road users throughout the closure period was not clearly understood. In this case, TNDOT turned to the use of QuickZone to scope the potential delays to motorists in and around Knoxville during the periods when I-40 would essentially be shut down for through travel to both the east and west.
From the road network geometry in the metropolitan area, it was clear that the brunt of the diverted travel demand would have to be borne by I-640. This facility, like I-40 was already experiencing some recurrent congestion in 2004 with I-40 open at full capacity. TNDOT commissioned a traffic study to predict traffic volumes on I-640 for a prospective 2008 full closure on I-40. The study, performed by a consultant from the Knoxville area, used vehicle-matching technologies to identify through and local traffic volumes collecting field data in the first half of 2004. The results of this study, in combination with existing TNDOT data describing seasonal, day-of-week, and time-of-day distributions of travel demand were used by analysts to sharpen a picture of predicted travel demands on the I-640 facility during the construction season.
The role of QuickZone in this case study was to first perform a quick prediction based on current traffic volumes to identify if significant congestion was likely under the proposed full closure option. When it became clear that congestion was likely to be significant, more refined travel demand data and more detailed network geometry in QuickZone was applied to scope the likely delay impacts and to identify targets for the management of local and interstate travel demand to prevent lengthy delays on I-640 and at the I-40/I-640 interchanges. TNDOT is using the results of the study as they consider approaches to this major project and a potential public awareness campaign to prepare the community, freight operators and other stakeholders in advance of the actual construction activity.
2.1.2 Network Design
In this case study, two networks were constructed in QuickZone to model the I-40 closure. The first included both I-40 and I-640 and was used for the initial delay screening activity. A second more detailed model was constructed of just the I-640 detour including key bottlenecks at interchanges along its length in both east and west directions (Figure 2.1.2). Modeling the details of the bottleneck areas was important in identifying the capability of I-640 to effectively absorb diverted travel volume from I-40 during the proposed full closure period. For example, capacity of the off-ramp from westbound I-40 onto I-640 was estimated with consideration for features of the proposed travel movement, e.g., number of lanes, grade, ramp curvature and merge area length. Likewise, a capacity reduction was modeled at the intersection of I-640 and I-275 because of a narrowing of the I-640 as it passes beneath I-275.
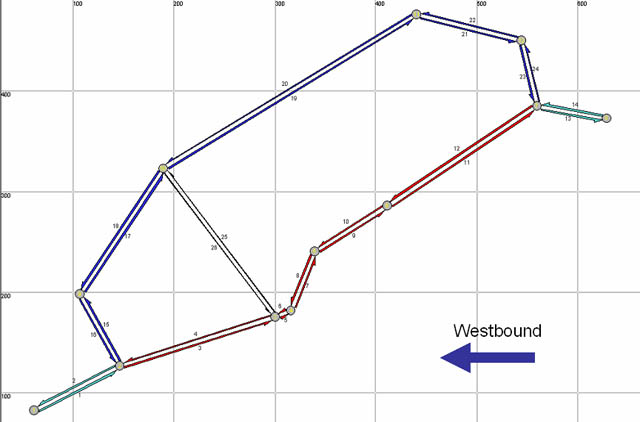
Figure 2.1.2 Knoxville, TN QuickZone Network
Given the potential disruption a full closure might have on the distribution of travel demand throughout the Knoxville area, TNDOT commissioned a traffic study to identify likely travel demand for I-640 given a full closure on I-40. Vehicle-matching technology was utilized to identify the current volume of through traffic traversing the length of I-40 in the Knoxville area in both eastbound and westbound directions. This characterization of current traffic patterns was combined with projected demand increases over the period 2004-2008 to arrive at average daily travel demand for I-640 given the full closure condition on I-40. QuickZone analysts utilized these average travel demand figures to determine likely hour-by-hour travel demand taking into consideration current prevailing distributions of travel demand on I-640 by time-of-day, day-of-week and month of the year (obtained from TNDOT permanent count stations as well as periodic count activities). These refined travel demand estimates were then applied with the detailed model of the I-640 diversion route in QuickZone to predict queue length and delay throughout the proposed full closure period.
2.1.3 Results
In the initial screening analysis performed with QuickZone, it became clear that I-640 would be unlikely to absorb a significant share of I-40 volume given expected 2008 travel demand conditions without serious congestion conditions developing during peak periods and on high-volume weekend conditions associated with the summer travel season. The predicted severity of congestion prompted TNDOT to consider a more detailed model of the I-640 detour route in QuickZone along with bringing into QuickZone the results of the more detailed I-40 closure traffic study completed in mid-2004.
The analysis of the more detailed detour model in QuickZone indicated that several key bottlenecks along the proposed diversion route would not support the combination of current travel demand and diverted travel demand from I-40. Queuing at these bottlenecks are predicted to generate significant congestion during morning and afternoon peak travel demand periods that would persist without dissipation in the mid-day period for most weekdays. In addition, heavy travel demand on the weekends in the summer would generate backups at some of the same bottlenecks with significant delays that would build and dissipate over a period of 6–8 hours.
Because of the severity and duration of the predicted delays, the QuickZone analysis was extended to consider the improvement of I-640 to reduce bottleneck effects at key intersections (like the one with I-275). Even with these improvements, it was clear that significant and potentially unacceptable delays would be likely unless travel demand management strategies could shift local and interstate road users away from weekday peak periods and summer weekend afternoons. Using QuickZone, the effectiveness of strategies aimed at reducing through truck travel as well as local and interstate passenger car values were analyzed. A range of target values for demand management were explored to realize some of the reductions in travel demand required to reduce delay to minimal levels. TNDOT is considering these targets as well as potential public outreach on the project as a result of the QuickZone analysis.
2.1.4 Contact Information
Brian J. Fouch, P.E.
Region Three Area Engineer
Federal Highway Administration – TN Division
640 Grassmere Park Road, Suite 112
Nashville, TN 37211
Brian.Fouch@fhwa.dot.gov
(615) 781-5765
Steve Allen
Transportation Manager 2
Mapping and Statistics Office
Suite 1000, James K. Polk Bldg.
505 Deaderick St.
Nashville, TN. 37243-0344
Steve.Allen@state.tn.us
(615) 741-2208
2.2 Maryland/Virginia Woodrow Wilson Bridge: I-95
 Key Observations
- QuickZone can be used to estimate delay and queuing on large construction project with high volumes.
- Impact to the traveling public was reduced since total duration of the construction project was reduced from an estimated 6 months to 2 months.
- Creation of an efficient dialog between the construction contractor and the Woodrow Wilson Bridge management team.
2.2.1 Overview
The replacement of the Woodrow Wilson Bridge, along Interstate 95 in the Metropolitan Washington, DC area, is an extremely large and complex construction project requiring the close coordination of numerous contractors and various state and local government agencies. The Woodrow Wilson Bridge carries upwards of 100,000 vehicles per day along Interstate 95 which spans the Potomac River. The current 6-lane bridge is being replaced with a dual-span bridge that will more than double the number of traffic lanes. The management of the construction project primarily involves the Maryland State Highway Administration (MD-SHA) and the Virginia Department of Transportation (VDOT) who are responsible for overseeing daily operations of the construction site including scheduled lane closures.
 An important aspect to the replacement of the Woodrow Wilson Bridge is to maintain current roadway capacity during peak periods while construction takes place. This requires limited, if any, lane closures during peak periods and daylight hours. In general, any necessary lane closures were conducted at night to minimize the impact on drivers. In Fall 2001, a contractor for the Maryland State Highway Administration was in the process of constructing one of many new bridges as part of the replacement and refurbishment of the Woodrow Wilson Bridge at the MD 210/I-295/I-95 interchange just east of the Potomac River shoreline (see Figure 2.2.1 below). The construction involved the demolition of existing bridges and the construction of new bridges. The plan included closing lanes during the overnight hours (12:00pm to 4:00am) and two temporary openings in the median barrier in order to divert traffic safely around the construction area while construction was taking place. This work zone plan configuration was scheduled to take between 4 and 6 months to complete.
The need for QuickZone arose when the contractor determined that to more efficiently utilize available resources, a four-hour window of construction would not be sufficient. The original work zone plan had lane closures occurring between 12:00pm and 4:00pm and the contractor estimated it would take 1.5 hours for work zone set up and take down, leaving 2.5 hours of actual production time. The contractor went to the Woodrow Wilson Bridge management team requesting more hours of production time to better utilize available resources. The request for more production time essentially meant that lane closure durations would have to increase. The request was sent to the Maryland State Highway Administration to analyze and make/provide feedback to the Woodrow Wilson Bridge management team.
The analysis required a quick analysis of multiple scenarios of when lane closures could take place without severely impacting motorists. The consultant chosen to conduct the analysis utilized MD-QuickZone for a number of reasons.
- QuickZone had the ability to analyze multiple scenarios very quickly.
- Maryland State Highway Administration had a customized version of QuickZone available that they were encouraging traffic engineers across to use for analyze work zone impacts.
- Results, namely delay and queue, were exactly the measures they needed to make a decision regarding the extension of the lane closure duration.
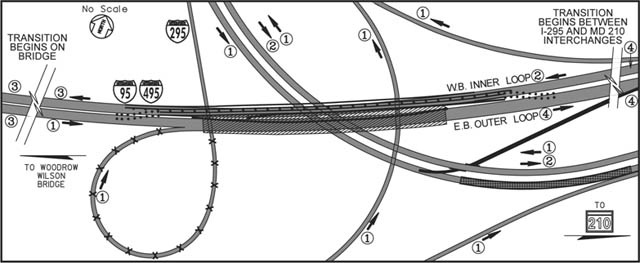
Figure 2.2.1 Woodrow Wilson Bridge Construction Diagram
2.2.2 Network Design
The QuickZone network for the Woodrow Wilson Bridge was complex in design due to the complex nature of the roadway geometry. The location of the construction included multiple roads coming together to form a complex interchange. In order to account for the total demand on the roads, the Woodrow Wilson Bridge QuickZone network includes 35 nodes and 53 links. Many of the links were the individual entrance and exit ramps along with the primary travel lanes of the outer and inner loops of the capital beltway. The network is shown in figure 2.2.2 below.
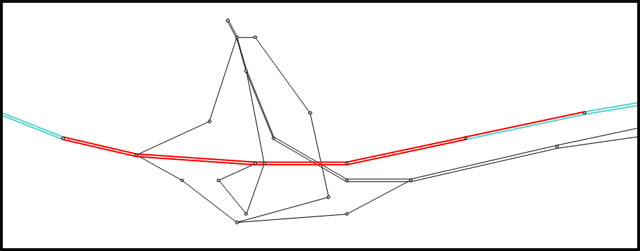
Figure 2.2.2 Woodrow Wilson Bridge QuickZone Network
Traffic volumes and demand data were available from both the Maryland State Highway Administration and the Virginia Department of Transportation. Demand data for the inner-loop was acquired from the various MD-SHA permanent traffic count stations set up prior to the construction site. The data is available to anyone interested via the Maryland Roads web site (www.marylandroads.com). Demand data for the outer-loop was made available through special traffic counts conducted by the VDOT on the Virginia approach to the Woodrow Wilson Bridge. Lane capacities, lengths, and free-flow speeds were gathered from historical data.
2.2.3 Results
The QuickZone analysis included multiple scenarios for extending the lane closure duration time and the number of lanes closed. These scenarios included beginning lane closures at 9 PM, 10 PM, 11 PM and 12 midnight and removing the work zone at 4 AM and 5 AM. The results of the analysis showed that there was very little impact to drivers if the lane closures began at 9 PM or 12 midnight and that opening all lanes up by 5 AM would be sufficient. These results were presented to the Woodrow Wilson Bridge management team, Federal Highway Administration and MD-SHA. As a result of this analysis, the contractor was given permission to begin lane closures at 9 PM and remove the lane closures by 5 AM.
At the time of the analysis, MD-QuickZone was a fairly new software program and had not been extensively used. An important aspect of trusting the results of QuickZone was to insure that the actual queue and delay that developed in the field were similar to the results generated by QuickZone. The Woodrow Wilson Bridge management team made the decision to monitor the queue and delay for the first week of construction. The results generated by QuickZone were very similar to those seen in the field.
The impact of the change in the work zone plan had very positive results. Overall, the impact to the traveling public was reduced since total duration of the construction project was reduced from an estimated 6 months to 2 months. The increase in production time to the contractor more than doubled (2.5 hours to 6 hours) resulting in better use of available resources and ultimately saving money on the overall construction project. Another important impact of using QuickZone was the creation of a dialog between the construction contractor and the Woodrow Wilson Bridge management team. The management team was in the position of weighing the interests of the construction contractor, who needed more production time, against that of the traveling public, who did not want unnecessary queuing and delay. QuickZone was a tool the management team could easily use to test out various work zone plan scenarios and determine the best compromise between the interests of the construction contractor and the public.
2.2.4 Contact Information
Andrew Lessner
QuickZone Analyst
Maryland State Highway Administration
7491 Connelley Drive
Hanover, Maryland 21076
alessner@sha.state.md.us
410-787-5864
Jawad Paracha
Transportation Engineer
Maryland State Highway Administration
7491 Connelley Drive
Hanover, MD 21076
(410) 787-5891
jparacha@sha.state.md.us
Marcelino Romero
IM/CM Coordinator
Woodrow Wilson Bridge Project
(703) 960-0146
romerom@wwbgec.com