1.0 Introduction
In all but a few high-visibility roadway construction and refurbishment projects, the "soft cost" of traveler delay is typically not considered when key decisions about project staging and duration are made. The 1998 Federal Highway Administration (FHWA) report "Meeting the Customer's Needs for Mobility and Safety During Construction and Maintenance Operations" identifies this issue and recommends the development of an analytical tool to estimate and quantify work zone delays. To this end, the FHWA sponsored the development of QuickZone, an easy-to-master analytic tool that allows for quick and flexible estimation of work zone delay supporting all four phases of the project development process (policy, planning, design and operations).
The overall goal in terms of ease-of-use for QuickZone is less than one hour to input and check a
QuickZone network, and less than three minutes to analyze the data and produce delay profiles over the project duration. Target users of QuickZone include state and local traffic construction, operations, and planning staff as well as construction contractors. QuickZone allows these users to:
- Quantify corridor delay resulting from capacity decreases in work zones;
- Identify delay impacts of alternative project phasing plans; and
- Support tradeoff analyses between construction costs and delay costs.
1.1 QuickZone 1.0
QuickZone development began in April 2000 using a rapid prototyping approach. This implies that a series of prototypes with limited capability be released to a set of beta testers for evaluation. The QuickZone Tool Review Committee, a sub-group of the FHWA Strategic Work Zone Analysis Team, was formed and drew from a user base of contractors, DOT planners and local agency personnel. The tool review committee was to help guide and evaluate the development of QuickZone Version 1.0 as well as beta test early versions of the software. The tool review committee responded not only in terms of look and feel of the product, but in terms of how they imagined using the tool.
For example, during feedback regarding Version 0.91 (February 2001), all of the respondents indicated that they would be a potential user of QuickZone and believed that QuickZone will address critical needs in their organization. They also indicated they would eventually use QuickZone for construction planning and work zone staging to evaluate highway design alternatives analysis for transportation management plans in life-cycle costing, and to select proper mitigation strategies and determine traffic control strategies. With this feedback provided in the early stages of development, the tool development effort reduced the risk of developing a tool that did not fit the needs of the target user.
The rapid prototyping approach enabled QuickZone to be developed in a relatively short time-frame. The total time from project inception to the wide release of QuickZone 1.0 was 24 months. However, beta versions were being actively used on projects by many users even before the final version was released. The following was the QuickZone Version 1.0 development schedule:
- Version 0.5 Beta—Distributed in July 2000 to the QuickZone Tool Review Committee members. Members are provided comments on look, feel and usefulness of QuickZone.
- Version 0.9 Beta—Distributed in October 2000 to the QuickZone Tool Review Committee members. Version 0.9 incorporated comments from Beta 0.5 and allowed members to input their own networks.
- Version 0.99 Beta—Widely distributed in June 2001 via the internet. Still receiving comments on this version.
- Version 1.0—Public release of QuickZone in June 2002 McTrans and PCTrans.
QuickZone Version 1.0 was made generally available in June 2002. Since that time approximately 109 licenses have been sold at a cost of $199. Sales of QuickZone have occurred across the United States to contractors, universities, and various state and local DOTs. QuickZone has also been purchased by users in foreign countries including Canada, South Africa and Japan. In addition, numerous training classes and seminars have been sponsored by FHWA and state DOTs to further promote the use of QuickZone. Figure 1.1 shows the geographic distribution of QuickZone sales throughout the United States.
1.2 QuickZone Partnership Program
Early in the development of QuickZone, it was clear that the varied needs of transportation agencies in modeling and assessing work zones could not be addressed by a single federal version of QuickZone. In order to develop QuickZone using the rapid-prototyping approach, QuickZone was written as a program within Microsoft Excel using the Visual Basic for Applications (VBA) programming language. This approach enabled QuickZone to be an open-source computer program. Therefore, to take advantage of QuickZone's open source code, and to encourage individual states to modify the underlying core code to create state-specific versions of QuickZone, the QuickZone Partnership Program was established.
The QuickZone Partnership Program takes advantage of QuickZone's open source code to both further improve the software and to provide state and local transportation agencies with a tool that best meets their needs. Under the QuickZone Partnership Program, the FHWA builds, maintains and distributes new Federal versions of QuickZone periodically as needed. Partner transportation agencies receive free versions of QuickZone to develop and support customized versions of QuickZone for use throughout their agency. Under the partnership program, the FHWA can include modifications made by individual partners into future version that are determined to be valuable to everyone.
The QuickZone Partnership Program includes seven state agencies and one division of FHWA, the Central Federal Lands Highway Division (CFLHD), as indicated in Figure 1.1. Two examples of the success of the QuickZone Partnership Program include MD-QuickZone and CFLHD-QuickZone. MD-QuickZone was developed in partnership with the Maryland State Highway Administration (MDSHA) and University of Maryland in 2001. The MDSHA had an ongoing project with the University of Maryland looking at capacity in work zones and trying to come up with a tool for estimating queues and delays. When MDSHA found out about QuickZone, they decided to combine the two efforts. MD-QuickZone included a state specific method to calculate capacity reductions in work zones and a work zone scheduler to further assist engineers in work zone traffic control plans. CFLHD-QuickZone was developed to specifically address the unique needs of the FHWA Central Federal Lands Highway Division. Many of the modifications made to develop these two partnership versions of QuickZone are included in Version 2.0.
1.3 Case Study Overview
QuickZone is a widely recognized and utilized tool. However, the success of QuickZone cannot measured only by the number of licenses sold, but rather by its impact on work zone planning, design and operations. In order to examine whether or not QuickZone was meeting the original goal, FHWA commissioned a series of QuickZone Case Studies to capture the uses and impact of the tool. In this document, eight highway construction projects are presented. The case studies selected here are just a few of the many applications of QuickZone. The eight sites selected to be a case study are intended to showcase the range of applications plus to highlight innovative modeling approaches using QuickZone. These case studies used various versions of QuickZone (V 0.99 Beta, V 1.0, MD-QuickZone and CFLHD-QuickZone) in a wide range of roadway locations. The case study locations are presented in Figure 1.1 marked with a triangle.
The case studies are located throughout the United States and Canada and include urban and rural applications. The roadway facilities include both high-volume, freeway applications with recurring congestion and low-volume, rural road applications where congestion is rarely a problem. In order to better organize the applications of QuickZone, each case study has been categorized into one of four areas described below. In each case study area there are two case studies.
- Urban Freeway—Road work planned or in-construction on higher volume roadways where recurring congestion is a problem and lane closures, if permissible, are severely restricted.
- Knoxville, TN: I-40—High volume roadway with major reconstruction scheduled. Current concepts include a full-closure of the mainline.
- Maryland/Virginia Woodrow Wilson Bridge: I-95—High volume roadway with peak periods lasting for five hours or more during the morning and evening. Limited time availability partial lane closures given the consistently high traffic volume through the work zone.
- Urban Arterial—Medium to high volume roads with signals and at-grade intersections. Recurring congestion may be a problem in which case lane closures are restricted depending upon traffic volume and time-of-day.
- Little Bras d'Or Bridge: Nova Scotia, Canada—Medium volume two-lane road. Major structural repairs to bridge required flagging operations.
- Reeves Street: Nova Scotia, Canada—Medium volume two-lane road. Intersection reconstruction required periodic lane closures on major route through Nova Scotia province.
- Rural High AADT—Higher volume rural roads (AADT greater than 1000) where congestion may be a concern if lane closure and flagging operations are conducted during peak periods.
- Yosemite National Park—High volume rural road through a major National Park destination. Roadway reconstruction may require periodic lane closures that coincide with peak demand.
- Zion National Park—High volume road through major National Park. Roadway milling/paving operations required closure of 1 of 2 entrance booth lanes during peak visitor hours.
- Rural Low AADT—Lower volume rural roads (AADT less than 1000) where recurring congestion is not a problem. Here, partial lane closures are permissible throughout the day, but impacts of periodic full closures or flagging operations on road users is poorly known.
- Beartooth Highway—Low volume two-lane rural road. Major reconstruction of entire facility requires full closure and flagging operations through day. Detour route is not feasible.
- Louis Lake Road—Low volume two-lane rural road. Major reconstruction of entire facility requires full closure for long durations. Possible detour route exists.
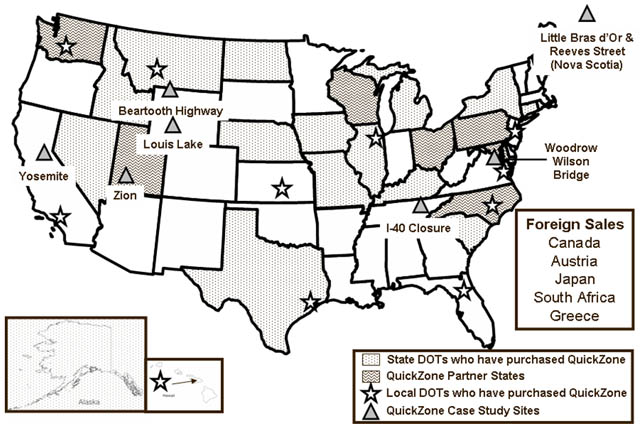
Figure 1.1 Geographic Distribution of QuickZone Sales and Case Study Location
Table 1.1 provides a summary of work zone characteristics of each case study. The case studies include a range of high, medium and low volume roads in both urban/suburban settings as well as rural locations. Traffic control options include partial closure, full closure, flagging and detours. Full closures include both long duration (1 or more days) and periodic (0 – 6 hours). Network types range from large and complex to small and simple. Finally, the case studies include examples of QuickZone being used for planning purposes—where the work zone and construction schedule are still being developed—and operations—where QuickZone is used to further refine a predetermined construction schedule.
| AADT | Traffic Control Elements | Quickzone Network Model | Purpose | Objective (for use of QuickZone) |
QuickZone Version | |||||
|---|---|---|---|---|---|---|---|---|---|---|
| Partial Closure | Full Closure | Flagging | Detour | Planning | Operations | |||||
| Urban Freeway | ||||||||||
| Knoxville, TN: I-40 | High | X | Long Duration | X | Large, Complex | X | Determine feasibility of full closures option for a congested urban freeway. | V 1.0 Summer 2004 |
||
| Maryland/Virginia Woodrow Wilson Bridge: I-95 | High | X | Medium, Complex | X Results of QuickZone verified in field |
Analyze additional construction staging strategies to maximize time for contractor in workzone without impacting motorists. | MD-QuickZone Fall 2001 |
||||
| Urban Arterial | ||||||||||
| Little Bras d'Or Bridge: Nova Scotia, Canada | Medium | X | Small, Simple | X Results of QuickZone verified in field |
Determine feasible construction times to limit impact on motorists. | V 0.99 Beta Summer 2001 |
||||
| Reeves Street: Nova Scotia, Canada | Medium | X | Small, Simple | X Results of QuickZone verified in field |
Justify additional cost of night work by quantifying delays expected from planned daytime roadwork. | V 1.0 Winter 2002 |
||||
| Rural High AADT | ||||||||||
| Yosemite National Park | High | X | Long Duration | X | Medium, Complex | X | Alternatives analysis comparing one-season and two-season construction phasing. | QuickZone-CFLHD Spring 2004 |
||
| Zion National Park | High | X | Small, Simple | X | Analyze various construction staging scenarios. | QuickZone-CFLHD Spring 2004 |
||||
| Rural Low AADT | ||||||||||
| Beartooth Highway | Low | Periodic | X | Large, Complex | X | Analyze overall construction impact on motorists resulting from multiple work zones. | QuickZone-CFLHD 2003 – 2004 |
|||
| Louis Lake Road | Low | Periodic | X | X | Large, Simple | X | Estimate economic loss and delays from a work zone with a lengthy detour. | QuickZone-CFLHD 2004 |
||
The case study summaries provide an analysis of how QuickZone was utilized for the eight case studies presented above. The analysis includes a listing of key observations that are important to how QuickZone was used for each project; an overview, which includes a description of the project location, to better orient the reader and provide context; a discussion on network design for each case study; an analysis of the results and how they were used; and finally, contact information. In addition to the eight case studies, a summary of other selected projects where QuickZone has been used is also provided.
previous | next