Work Zone Performance Measurement Using Probe Data
3. Case Studies
3.1 Maryland State Highway Administration
3.1.1 Background
Rationale for Project
This case study is based on a pilot project conducted by the University of Maryland (UMD) Center for Advanced Transportation Technology (CATT) and involves the development of a real-time performance monitoring tool specifically for work zones using data from the Regional Integrated Transportation Information System (RITIS). The Maryland State Highway Administration (MDSHA) recognized the opportunity to use probe data already integrated into RITIS to help measure work zone performance, as well as to improve planning and management of work zones, and contracted with CATT to help develop the proposed tool. The resulting work zone performance measure (WZPM) application will be able to both monitor a work zone in real-time and produce work zone performance measures based on historical data.
| The WZPM application can help comply with assessments of work zone impacts on mobility and safety that are required by the Final Rule on Work Zone Safety and Mobility. |
Part of the motivation for creating the tool was to help comply with requirements in the Final Rule on Work Zone Safety and Mobility that require state and local governments that receive federal-aid funding to assess work zone impacts on mobility and safety. SHA does not currently have formal work zone performance measurement processes in place. Therefore, this tool will give SHA the ability to obtain the necessary data and to measure and report work zone performance measures.
Research Objectives
This pilot project aims to accomplish a number of goals, including:
- Determine adequacy of third party probe data to support work zone performance measures
- Identify work zone performance measures and develop methodologies to assess them from available data
- Design a user interface "dashboard" that displays work zone performance measures in an effective manner
- Validate the work zone performance measures produced by the tool, both in terms of the accuracy of the performance measures and their adequacy to assess work zone performance
Throughout the project, input was gathered from potential MDSHA users to help identify ways to improve the proposed performance measures and the tool that produced and displayed them.
These objectives were pursued in the order presented in the list above, with the first objective listed was considered paramount – no other objectives could be achieved if the third party probe data was not adequate to support the needed performance measures.
Project Timeline
The UMD/CATT probe prototype project began in the fall of 2011 by identifying appropriate real-time and historical work zone performance measures and assessing the adequacy of probe data to support those performance measures. After appropriate performance measures were identified, UMD/CATT began designing a prototype user interface "dashboard" to display work zone performance measure information. This prototype dashboard was shown to potential users in October 2012 in order to obtain comments and suggestions for improvement. A second meeting with potential users was held in December 2012. In early 2013, UMD CATT began developing the WZPM application, which was available in prototype form in June 2013.
Data Sources
| The WZPM application can be readily adopted by any State that participates in RITIS. |
The WZPM application was developed around the data available in RITIS. The RITIS data covers a number of States and includes data from both fixed sensors and from a third party probe data provider. This is an important characteristic of the WZPM application – it can be readily adopted by any State that participates in RITIS and for which probe data is available.
3.1.2 Identifying Work Zone Mobility Performance Measures
One of the first steps in the UMD/CATT probe prototype project was identifying the work zone mobility performance measures that would be used. Three main mobility metrics were identified for work zones: delay, congestion, and queue length. These metrics were used as the basis for defining a number of programmatic performance metrics and for supporting an alert system. The remainder of this section describes these metrics and performance measures in more detail.
Defining a Work Zone
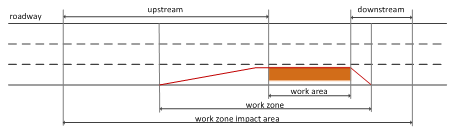
The UMD/CATT project decomposed a work zone into three segments: upstream, work area, and downstream, as shown in Figure 3. The work area is the area in which work is being performed. The work zone includes the area around the work area from the first warning of the work zone ahead (i.e., a warning sign or a flashing light on a vehicle) to either the "end of work zone" sign or the last work zone traffic control device. The work zone impact area consists of the work zone, plus the areas upstream and downstream of the work zone in which mobility and/or safety is impacted by the work zone. Work zone performance measures should be assessed over the work zone impact area, not just the work zone itself. In particular, the upstream and downstream areas should be large enough to capture shockwaves moving towards and away from the work zone.
Figure 3. The UMD/CATT Probe Prototype Definition of Work Zone Segments
Work Zone Mobility Performance Measures
The work zone performance measures considered in the UMD/CATT project were based on the guidelines in a primer on the subject produced for FHWA [6] and included:- Three basic mobility performance measures – delay, congestion, and queue length.
- Programmatic mobility performance measures that leverage the above performance measures, such as number of days with a queue, average queue duration, average queue length, maximum queue length, vehicle-hours of delay per work period, average delay per vehicle, etc.
- Alerts based on the basic performance measures, used to warn personnel that work zone mobility is below defined thresholds.
Approaches were defined to assess these performance measures from the RITIS probe data. These approaches are summarized in the topics below.
Delay
Vehicle work zone delay is defined as the time a vehicle spends in the area in which the work zone impacts traffic beyond what it would have spent under typical conditions for that date and time. Delay performance measures are computed by generating statistics based on the vehicle work zone delay. For example, the average delay is the average vehicle work zone delay computed over all vehicles exiting the work zone during a specified time period and the total delay is the sum of these vehicle work zone delay values. Probe data is particularly well suited for computing delay because travel time is a direct observation of most probe data systems.
Congestion
Congestion occurs when measured speeds (a) fall below historical speeds for the same location and time period and (b) fall well below a reference speed. Before this project, RITIS already included processes for identifying congested segments where the free flow speed was used for the reference speed and "well below" is defined as below 60 percent of the free flow speed. The UMD CATT team considered this definition as it applies to work zones and determined that it would be more appropriate to define "well below" for work zones as below 80 percent of the free flow speed. This conclusion was based on analyses that indicated a value of 80 percent could occur under either of the following two conditions:
- The congested portion of the work zone is more than half of the work zone length or
- The level of congestion in the congested portions of the work zone must be high, so that the level of service in the congested portion was LOS F.
When using probe data to measure congestion, the travel time observations generated by most probe data systems must be converted to speeds by taking the ratio of segment length to segment travel time. (Note that some probe data systems do report spot speed measurements, and it is anticipate that this may be more commonly available in future systems. See Appendix A for more information on the future of probe data.)
Queue LengthThe UMD CATT team developed the following formula for estimating the work zone queue length based on the ratio of the observed average speed and the free flow speed.
In this formula, the term α represents the ration of the average segment speed to the free flow segment speed. This formula is based on defining the queued region within a work zone as the region in which the observed speeds are less than 67 percent of the free flow speed. This formula provides a mechanism for estimating queue length based on observations of average speed. This avoids the need to directly observe the queue, which is difficult because the position of the queue can change quickly over time.
Programmatic Work Zone Mobility Performance Measures
The UMD CATT team also identified a number of programmatic performance measures that could be computed based on the three mobility performance metrics described above. The first set of performance measures only requires average speed or average travel time to compute. The general approach is to divide the day into intervals – typically the time interval for which the probe data vendor provides the data when probe data from a commercial vendor is being used. Delay is estimated directly from these travel times. The formula described above is used to estimate the length of the queue during each period. Queue events are identified by combining successive intervals with non-zero estimated queue length. The duration of each queue event is determined by the time period covered by the successive intervals that were combined. The queue length for a queue event is the maximum length of the queue during each event.
A number of programmatic performance measures can be computed from this information:
- Number of days when queuing occurred, computed by identifying the number of days during which a queue event occurred.
- Average queue duration, computed by averaging the duration of each queue event.
- Average queue length, computed by averaging the queue length for each queue event.
- Maximum queue length, computed by taking the maximum of the queue lengths for each queue event.
- Percent of time the queue length exceeds a specified threshold, computed by summing the interval lengths for the intervals for which the estimated queue length exceeds the specified threshold and dividing by the total time period for which observations were made.
- Maximum per-vehicle delay, computed by taking the maximum of the delay.
The second set of programmatic performance measures requires volume data, along with the travel time data available from probe data:
- Percent of traffic that encounters a queue, computed from the ratio of the sum of traffic volumes during queue events and total traffic volumes.
- Vehicle-hours of delay, computed by multiplying the average delay times the volume of vehicles that experience that delay.
- Average delay per entering vehicle, computed by averaging the delay values, weighted by the traffic volumes.
- Percent of traffic experiencing a delay that exceeds a defined threshold, computed from the ratio of the sum of traffic volumes for period where the average delay exceeds the threshold to the total traffic volume.
- Verifying Work Zone Mobility Performance Measures
The UMD CATT team verified these performance measures by applying them to three work zones: on Westbound I-70, east of Frederick, Maryland; on Northbound I-795, near Baltimore; and on Southbound I-97, south of Baltimore. For each of these work zones, archived data from RITIS was used to compute the performance measures and alerts that would have been generated if the proposed system was available when the work zone was active. The report [4] includes detailed information on each of these work zones and describes lessons learned in applying the performance measures to these work zones. These lessons learned are summarized below.
3.1.3 Aligning Work Zone Boundaries with TMC Segments
The probe data available through RITIS provided travel time estimates for TMC code segments, so the first step in applying that data to work zones was identifying the relationship between the TMC segments and the work zone location. Table 6 lists these relationships for the Westbound I-70 work zone for a right shoulder lane closure that occurred on May 8, 2012. In this table, the first column indicates the name of a TMC segment and the second through fourth columns indicate the portion of the indicated segment that is contained in the upstream, work zone, and downstream areas, respectively.
| The lack of alignment between the work zone boundaries and the TMC segments presents challenges when using third party probe data for work zone performance measures. |
The first thing to note about the information in this table is that it is necessary to split the TMC segments so that the resulting segments align with the work zone boundaries. For example, TMC segment 110P04196 is sub-divided so that the first 0.60 miles are considered part of the upstream area and the remaining 0.12 miles are considered part of the work zone. The traffic condition information for the sub-segments is inferred from the traffic condition information of the parent TMC segment. The average speed of each of the sub-segments of TMC segment 110P04196 is assumed to be the same as for the parent TMC segment. The travel time for each segment is computed by dividing the length of the sub-segment by this average speed.
| TMC Segment | Upstream | Work Zone | Downstream |
|---|---|---|---|
| 110+04489 | 3.45 | ||
| 110+04467 | 1.13 | ||
| 110P04195 | 0.63 | ||
| 110+04196 | 4.85 | ||
| 110P04196 | 0.6 | 0.12 | |
| 110+04197 | 3.33 | ||
| 110P04197 | 0.03 | ||
| 110+04198 | 2.15 | 1.2 | |
| 110+04199 | 0.26 | ||
| 110P04199 | 0.19 | ||
| 110+04200 | 0.91 |
| The large size of TMC segments, particularly in rural areas, may create problems when using commercial probe data for work zone performance measures. |
A related problem has to do with the size of the TMC segments relative to the size of the work zones. In the example above, the longest TMC segment has a length of 4.85 miles. TMC segments in rural areas can be even longer. If the length of a work zone is considerably less than the length of the TMC segment(s) that contain it, then travel time and average speed information for the TMC segment may not provide an accurate characterization of traffic conditions within the work zone.
Computing Work Zone Performance Measures
These relationships between the TMC segments and the work zone areas allowed UMD CATT staff to use the probe data available from RITIS to compute the work zone performance measures for each of the work zones described above. The general approach was to compute the work zone metrics for each of the TMC segments related to the work zone area, then sum the segment-based performance measures to generate performance measures for the work zone. Table 7 lists the performance measures computed for the Westbound I-70 work zone during one 6 hour 34 minute period when the work zone was active.
| Performance Measure | Unit | Upstream | Work Zone | Downstream |
|---|---|---|---|---|
| Length | Mile | 10.66 | 5.63 | 2.57 |
| Average Delay | Minute | 0.03 | 0.03 | 0.16 |
| Maximum Delay | Minute | 0.24 | 1.32 | 1.14 |
| Queue Duration | Minute | 330 | 135 | 394 |
| Average Queue Length | Mile | 0.06 | 0.06 | 0.34 |
| Maximum Queue Length | Mile | 0.52 | 2.15 | 2.04 |
| Percent Time Queue Length Exceeded 1 Mile | % | 0 | 0.25 | 2.03 |
| Source: Table 10 of the UMD CATT PM Final Report [4] | ||||
Congestion performance measures were also computed. In this particular example, no congestion alerts were generated and the work zone areas were in congested conditions 0 percent of the time. Similar results were reported for the other work zones, though congestion alerts were sometimes generated for the other work zones.
The vehicle speeds through the work zone were reviewed and compared to historic values and vehicle delays were computed to obtain some insights into the extent to which the performance measures characterized the traffic conditions that actually existed. The only concern identified was with regards to the queue-related performance measures; even though only small delays were observed, the queue performance measures were large. Consequentially, an alternate method for estimating the queue length was tried. Rather than applying the queue length formula to each TMC segment and summing the resulting segment queue length estimates across the work zone areas, the TMC segment values were combined for each work zone area before applying the queue length formula. Table 8 shows the difference in the results from the two different approaches. The rows with the Method column listed as "Segment" are the performance metric values computed applying the queue length formula to the TMC segments, then summing across the work zone areas. The rows labeled as "Connected" are values computed by first computing average speeds for each work zone area, then applying the queue length formula.
| Performance Measure | Unit | Method | Upstream | Work Zone | Downstream |
|---|---|---|---|---|---|
| Queue Duration | Minute | Segment | 330 | 135 | 394 |
| Queue Duration | Minute | Connected | 42 | 3 | 3 |
| Average Queue Length | Mile | Segment | 0.06 | 0.06 | 0.34 |
| Average Queue Length | Mile | Connected | 0 | 0 | 0 |
| Maximum Queue Length | Mile | Segment | 0.52 | 2.15 | 2.04 |
| Maximum Queue Length | Mile | Connected | 0.35 | 2.15 | 1.25 |
Based on these comparisons and similar comparisons for the other work zones considered, the UMD CATT team suggested that the "connected" approach resulted in a more stable measure of work zone queue lengths. The two methods produced similar results when estimating major queues. The first method often indicated the presence of minor, transient queue during times when the second method indicated no queue was present.
3.1.4 Displaying Work Zone Mobility Performance Measures
The UMD CATT team next developed a prototype dashboard display (see Figure 4) to summarize the mobility status of a work zone. This dashboard contains the following elements:
- The work zone name at the top left.
- A work zone activity summary on the left below the work zone name.
- A map of the work zone location to the right of the activity summary.
- A work zone speed summary at the bottom left.
- Work zone performance measure timelines at the top right.
- A speed heat map at the bottom right.
Figure 4. UMD/CATT Prototype Work Zone Performance Measure Application (Dashboard Concept)
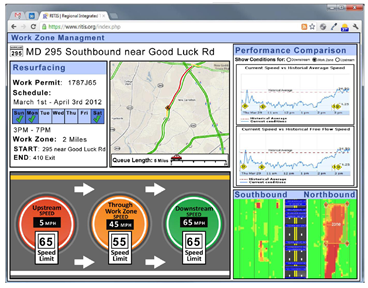
Source: Figure 47 of the UMD CATT PM Final Report [4]
This dashboard concept was used for the purpose of gathering input from potential users on the elements contained within it, and did not rely on real-time data feeds. A simpler dashboard that only included the work zone speed summary was connected to a real-time data feed to demonstrate the general capability of supporting a real-time dashboard.
3.1.5 Obtaining User Input
A meeting was held on October 25, 2012 with potential users to get feedback on the work zone performance measures and the dashboard concept. A number of potential uses for the WZPM application were identified, including:
- Field staff could use the tool to facilitate oversight of construction activities.
- Public Information Officers could use the tool to provide information to the public and when responding to complaints.
- Traffic operations personnel could use the tool to monitor and respond to traffic conditions in work zones.
A number of suggested improvements to the WZPM application were also identified during the meeting.
WZPM application portability and accessibility is key
The application should be accessible on many different platforms, including desktop and notebook computers, tablets, and smart phones.The WZPM application should show the real-time status of all work zones in the state
The dashboard concept focused on providing details for a single work zone. The suggestion was to provide a separate dashboard that provided a summary of all work zones.
The concept of alerts was viewed favorably, but might require some enhancements
Some suggested enhancements were to (a) enable the system to send automated text message, email, or voice mail alerts and (b) include incident information in the alert, when applicable.
The WZPM application should include access to weather and weather forecast information
Because of the potential for weather to impact work zone mobility performance, it was suggested that the WZPM application should include access to weather information, both when using the application to review real-time performance measures and to review historical performance measures.
Include a feature to facilitate comparisons of historical performance measures by day of week, months of year, etc.
This suggestion was focused on the ability of the WZPM application to support searches of archived data and provide capabilities such as comparing performance measures for a specified day of the week.
Participants also noted that the tool might be useful to other staff that were not represented at the meeting, including staff in construction engineering management, design/planning, and the Office of Traffic and Safety. So, a second meeting was held on December 13, 2012 to get feedback from potential user groups that did not participate in the first meeting. Some additional uses for the WZ PM application were identified, such as:
- The general public might find the tool useful, though the information available may have to be more limited and presented in a less technical manner.
- Public Information Officers might use the historic data to help them produce content for their monthly newsletters.
- The historic data could be useful when responding to contractors requesting an extension or change in their schedules.
- The historic data could be useful for preparing project documentation and bid documents.
Additional suggested improvements identified during this meeting include:
Include access to additional information
Work zone activity may have an impact on traffic, so it might be beneficial for the WZPM application to track where and when work zone activities are occurring. Displaying the work permit number and linking to the permit database could be useful. Information on posted speed limits would be useful, particularly when responding to complaints.
Enhance the mapping capabilities
The map is useful to see the extent of the potential impact. The ability to zoom in and pan the map and switch between map and satellite views would be useful.
Integrate accident information
Including a search tool to find incidents that occurred during lane closures and other work zone activities would be useful.
Enhance customization
Different users have different needs, so it might be useful if each user could customize the dashboard to better suit their specific needs.
The users also identified some potential limitations of the system, including:
- Automatic Speed Enforcement (ASE) can result in reduced speeds in work zones and, therefore, impact mobility performance.
- Obtaining required inputs could be challenging. Project engineers do not have time to enter work zone parameters into the WZPM application. Much of the original work zone information is already entered into the Emergency Operations Reporting System (EORS). When lane and road closures result from an incident, no permit is required and information about the closure may be difficult to track.
3.1.6 The Prototype Work Zone Performance Measure Application
By May 2013, a prototype version of the work zone performance measures application was available that addressed comments received during the meetings with potential users. Figure 5 depicts a new feature that addresses the suggestion to provide a summary screen that showed the real-time status of all the active work zones in the State.
Figure 5. Prototype Work Zone Performance Measure Application (Area-wide Summary Dashboard)
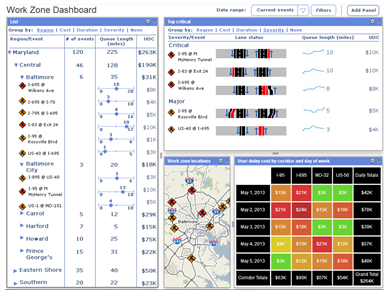
Source: Slide 11 of the UMD CATT WZ Probe Data Presentation [5]
In this screen, the panel at the left lists the active work zones in the State and provides summary information on each. The top-right panel lists critical work zones. The bottom middle panel maps the work zone locations. The bottom right panel summarizes the total mobility performance of all the active work zones in the State.
The tool also includes other features that accommodate some of the suggestions made. The Filters button at the top right can help a user search through the work zones. The Add Panel button allows a user to customize the dashboard.
Selecting a specific work zone brings up a dashboard (see Figure 6) that provides more detailed information about the selected work zone.
Figure 6. Prototype Work Zone Performance Measure Application (Project Level Dashboard)
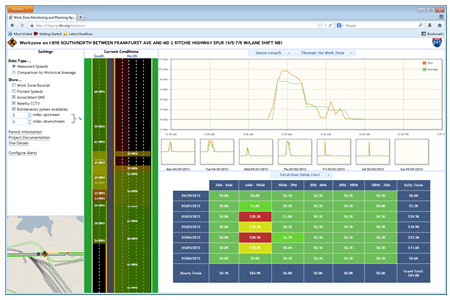
Source: Slide 12 of the UMD CATT Work Zone Probe Data Presentation [5]
Figure 7. Prototype Work Zone Performance Measure Application (Alert Configuration Tool)
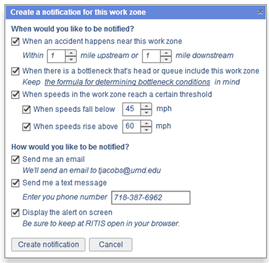
Source: Slide 13 of the UMD CATT Work Zone Probe Data Presentation [5]
This tool allows a user to customize whether they want to be alerted based on the present of an accident, a bottleneck, or if speeds go above or below a set amount. The user can choose one or more criteria for activating an alert (e.g., when an accident occurs, when a queue forms, when speeds cross specified thresholds) and one or more methods for distributing the alert (e.g., email, text message, on-screen notification).
3.1.7 Summary of Lessons Learned
The following list summarizes lessons learned related to the MDSHA work zone performance measures application developed by UMD CATT.
- The WZPM application can help comply with assessments of work zone impacts on mobility and safety that are required by the Final Rule on Work Zone Safety and Mobility. See Section 3.1.1.
- The WZPM application can be readily adopted by any State that participates in RITIS and has access to state-wide probe data. See Section 3.1.1.
- Currently available probe data is sufficient to support work zone performance measures. See Sections 3.1.2 and 3.1.4.
- There are challenges in using commercially available probe data for work zone performance measures related to the alignment of the TMC segment boundaries with the work zone boundaries. See Section 3.1.3.
- There are many potential uses of a work zone performance measures application, including helping oversee construction activities, to support traffic operations, to provide information to the public, to respond to complaints, to respond to a contractor request for an extension or schedule change, and to prepare project documentation and bid documents. See 3.1.5.
3.2 Other examples
In addition to the UMD/CATT example above, a number of other States have explored the use of probe data for work zone performance measures. Table 9 lists examples of such projects. Additional details on each of these projects are provided below the table.
| State | Experience with Probe Data Work Zone Performance Measures |
|---|---|
| 2009, Indiana | Used Bluetooth detectors for work zone travel time measurements to support a real-time travel time system for travelers. Used other Bluetooth detectors to log data for post processing. |
| 2011, Virginia | Compared Bluetooth travel time estimates versus benchmark data. Used commercial probe data to assess work zone performance measures for 15 work zones. |
| 2011, TTI | Conduced pilot tests on work zone performance measures that included some probe data and published the Work Zone Performance Measures Pilot Test report. |
| 2011, Minnesota | Used commercial probe data to estimate work zone travel times for a work zone traveler information system on I-35. |
| 2012, Texas | Deployed Bluetooth detectors to support travel time monitoring for an I-35 expansion project. These detectors were supplemented by other traffic monitoring technologies. |
| 2012, Wisconsin | Researchers used Bluetooth detectors to monitor vehicle movements within several work zones in order to examine route choice. |
| 2012, Maryland | Developed techniques for computing work zone performance measures from multiple data sources, including probe data. Details provided in the previous section. |
| 2013, Ohio | Use historic travel time data from a commercial vendor to track mobility impacts due to the Hoople Interchange Reconstruction project on I-75 near Cincinnati. |
| 2013, Utah | Obtained license for statewide historic travel time data from a commercial vendor and is exploring uses, including work zone performance measures. |
| 2013, USDOT | Conducted a Work Zone Performance Management Peer Exchange in Atlanta, Georgia that included a significant focus on the use of probe data to support work zone performance measures. |
More information on each of these examples related to work zone performance measures using probe data is provided below.
Indiana, 2009 [7]
In the summer of 2009, Indiana DOT resurfaced approximately 10 miles of I-65. Data collection was performed using a mix of semi-permanent and portable Bluetooth detectors. The semi-permanent detectors were deployed by retrofitting portable dynamic message signs with a Bluetooth antenna and provided near real-time data. The portable, standalone units were used for initial baseline data collection (before portable dynamic message signs were deployed to the work zone) and, periodically, on diversion routes. The portable units logged data for post-processing rather than providing data in near real-time.
Some of the lessons learned reported by Indiana DOT include:
- Retrofitting portable dynamic message signs with Bluetooth detectors was a cost-effective way to obtain work zone travel time measurements.
- The availability of work zone travel time measurements provided quantitative data that supported evaluation of alternative work zone traffic management techniques.
- The work zone travel time measurements could be used to support performance based contracting methods, such as specifying maximum delay times and including rewards and penalties based on observed delay times.
- The use of portable detectors on diversion routes allowed Indiana DOT to assess and improve the effectiveness of their work zone traveler information. One improvement was the use of dynamic message signs to display information about targeted alternate routes. Prior to implementing this approach, real-time delay information was displayed and few probe vehicles diverted. After specifying diversion routes on the signage, more than 30 percent of probe vehicles diverted.
Virginia, 2011
The Virginia Department of Transportation acquired probe vehicle based travel time data for 2010 from a commercial vendor. Fontaine and Edwards [8] used this data to calculate travel time reliability measures at 15 work zone locations based on monthly average travel times.
Some lessons learned include:
- The use of average travel time over a month instead of day-specific travel time smoothed out the hourly and daily fluctuations in travel time and may have reduced the effectiveness of the measurements.
- The TMC segments for which travel times were available do not necessarily line up with the work zone. Therefore, the measured travel time at the work zone location can be influenced by the travel time at non-work zone locations, which results in lower variability in travel time reliability measures.
- The probe data used relied primarily on data from commercial vehicles. The data quality appeared to sometimes suffer at night and on arterials when commercial vehicle traffic was light.
- The vendor appeared to use both real-time and historical data to produce their traffic condition data. Full road closures could result in an inaccurate picture of a work zone area if the vendor was unaware of the closure because the system seemed to default to historical observations when no real-time data was available.
Texas Transportation Institute, 2011 [9]
The Texas Transportation Institute conducted a study to validate work zone performance measures. The study considers exposure (volume through the work zone and vehicle-miles-traveled through the work zone), queuing, delay, travel time reliability, and safety measures in their study. Third party probe vehicle data was used as part of the study; specifically, large truck speed data obtained from FHWA Office of Freight Management. They monitored the following five work zone locations:
- I – 95, Lumberton, North Carolina
- I – 95, Philadelphia, Pennsylvania
- I – 405, Seattle, Washington
- I – 15/US95 Design-Build Project, Las Vegas, Nevada
- I – 15 Express Lane Project, Las Vegas, Nevada
This report identifies probe based methods as appropriate for collecting work zone travel time data and describes methods for computing performance measures from various data sources. The study included the use of truck transponder data that was used as a source of speed data for each of the work zones considered in the report. Because of the limited amount of truck transponder data available during this study, there were no specific lessons learned related to the usage of this type of data. They did note challenges related to differences between the end points of the work zone and the end points for the segments for which speed values were reported.
Minnesota, 2011 [10]
Minnesota DOT conducted a trial using commercial probe data to assess the accuracy of using commercial probe data for arterial travel times. The project also included the use of commercial probe data for real-time monitoring of travel times through rural work zones on I-35 between Minneapolis and Duluth. These travel times were converted to travel delays, which were used on variable message boards to inform travelers of delays. The resulting travel delay system was used for several months, but was then terminated because of concerns about the accuracy of the travel time data on Sundays.
Overall traffic on Sundays was heavy because of significant tourist / vacation travel to Northern Minnesota, so there was potential for work zone congestion on Sundays. However, the primary source of probe data for the vendor providing data for this project was from commercial vehicles and commercial vehicle traffic was light on Sundays. Having few probe observations available during times when congestion occurred resulted in inaccurate travel time data on Sundays.
The lessons learned from this project include:
- Probe data systems that rely on commercial vehicle traffic can be less accurate during times when commercial vehicle traffic is light. This can be particularly problematic if there are times when commercial vehicle traffic is light and overall traffic is heavy.
Wisconsin, 2012
Wisconsin DOT supported work zone diversion studies at two rural and two urban work zone sites. Bluetooth detectors were deployed in pairs, triples, and quadruples to help identify changes in route choice that occurred with lane closures. The project did demonstrate the viability of using Bluetooth detectors to collect route choice data. Several limitations were noted:
- The overall detection rate was low – from 0.3 percent to 5.7 percent at one site. This limits the number of route choice observations produced by the system. Presumably, these numbers will increase as Bluetooth devices become more common on vehicles.
- Not all vehicles with a Bluetooth system on board are detected by the roadside Bluetooth detectors. This reduces the effectiveness of tracking vehicles past multiple detectors – the more detectors that must be related, the lower the effectiveness. For example, if only 50 percent of vehicles with Bluetooth devices are detected, then only 25 percent of vehicles detected at the first detector of a sequence of three detectors would be detected at each of the subsequent detectors to produce a valid triple of observations.
Maryland, 2012
This is the case study describe in detail in Section 3.1.
Texas, 2012
Texas DOT announced plans to use a traffic monitoring system that integrates data from Bluetooth detectors and radar systems to monitor traffic on a 96-mile stretch of I-35 that is scheduled for 17 construction projects between 2013 and 2017. Portable solar-powered Bluetooth readers are used to collect data and are repositioned along the route as work progresses. The project is still in operation and lessons learned from the system are not yet available.
Ohio, 2013
Ohio DOT has a contract with a commercial probe data vendor for access to historical travel time data. The available historical data goes back to 2011 and data for the previous month becomes available at the end of each month. One of the applications for that data was production of mobility charts to track mobility impacts of the Hoople Interchange Reconstruction project on I-75 near Cincinnati. These charts compare the cumulative hours of reduced speeds through the work zone with historical values. An example is shown in Figure 8.
Figure 8. Ohio 45 mph Mobility Chart for the Hoople Interchange Reconstruction Work Zone
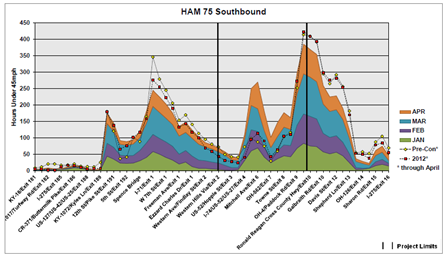
Source: Slide 5 of the Ohio DOT Mobility Charts presentation. [11]
In this example, the stacked line charts indicate the cumulative number of hours during which vehicle average speeds were below 45 mph for each month. The dotted lines represent the cumulative hours for the pre-construction years of 2011 and 2012. The vertical black bars represent the extent of the work zone. Note that the number of hours of reduced speed upstream and downstream of the work zone are similar to the historical values, while reduced speeds are much more prevalent within the work zone between Exit 4 and Exit 9 and, to a lesser extent, between Exit 1 and Exit 4. At Exit 6 (Mitchell Ave), the number of hours of reduced speed increased from about 100 hours in 2001 and 2012 to more than 250 hours in 2013.
Figure 9 shows a similar chart, but is for speeds reduced below 25 mph (i.e., for more severe mobility impacts). This chart shows a similar mobility impacts in and upstream of the work zone. Note that the upstream impacts extending back to Exit 1 give an indication of the queuing that formed upstream of the work zone.
Figure 9. Ohio 25 mph Mobility Chart for the Hoople Interchange Reconstruction Work Zone
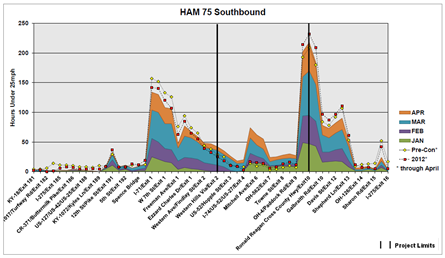
Source: Slide 6 of the Ohio DOT Mobility Charts presentation. [11]
Utah, 2013
In the summer of 2013, Utah DOT purchased a license to receive and use historical probe data from a third party vendor. The data is provided monthly for the preceding month and includes travel time information for arterials throughout the State. At the time of this report, UDOT had only just begun evaluating the data and how it could best be used. They did indicate that one usage they were considering was work zone performance measures.
USDOT, 20133
FHWA hosted a Work Zone Performance Management Peer Exchange in May 2013 where the purpose was to discuss work zone performance management and how best to quantify such work zone impacts. The meeting objective was to examine the status of performance management and measurement by industry leaders. This meeting facilitated necessary dialog between different states so that participants could learn from one another. Common challenges were also raised among the group, and several states DOTs reported on recent uses of probe data for work zone performance measure, including some of these described in the previous case studies. The following paragraphs describe some additional insights that were revealed during this peer exchange.
The cost of probe data is cheaper than installing detection infrastructure. VDOT gets a discount on real time data due to their membership in the I-95 Corridor Coalition; states in similar organizations may be able to receive similar discounts. Massachusetts tried to approach GPS companies to see if they would be willing to update their information when a work zone is present; they were not interested.
Bluetooth technology seems to be emerging in many states' practices. Agencies are using Bluetooth to determine travel times along segments, as well as segment speeds. They are using it to help to determine route choices as well. Wisconsin DOT ensures the accuracy of their variable message signs (VMS) by comparing speed data obtained from loops to Bluetooth data. Some deterrents from using Bluetooth data are that it is more like a 'cloud' than a 'point', and a signal can be detected more than once near a single Bluetooth detector device. Signals can also be interrupted by structures and buildings. The speed data obtained by Bluetooth devices applies to a segment, not a specific point. In Utah, agencies have learned that Bluetooth receivers can be programmed to collect either the first or last signal detection to avoid multiple counts of a single vehicle. In Virginia, they have seen a data trend that favors slower speeds, which is due to the fact that slower moving vehicles have a higher probability of being detected by a Bluetooth receiver.
At least one state (Utah) has experimented with using Bluetooth data to monitor performance for awarding performance incentives to contractors. Utah DOT conducted a test application of Bluetooth to determine whether managing contractor performance in this manner was feasible, as well as testing the validity of Bluetooth data. The incentives were based on anticipated road user costs. The project began with one week of Bluetooth data collection prior to the start of construction to set a baseline. Work zone scenarios were developed, and acceptable delay thresholds were chosen. Various warning messages could be displayed by contractors to aid them in meeting the delay thresholds. It was emphasized that agencies need to help contractors understand that Bluetooth (and other real time) data is there to help them, not to penalize them.
A report on the results of this peer exchange is scheduled for completion in September 2013. When completed, information about the report will be posted to the Work Zone Mobility and Safety Program website at http://ops.fhwa.dot.gov/wz.
3 This information was obtained from a summary written on the Work Zone Performance Management Peer Exchange, which was completed by FHWA. [ Return to note 3. ]