4. DATA COLLECTION METHODS
The development of work zone performance measures requires data about the project, work activities, crashes, and traffic operations. Project data will come primarily from the project plans or files, and daily inspector diaries. Crash data will most likely come from each state’s crash database, although an agency may choose to gather crash reports directly from law enforcement offices for key projects (such as is done by the Ohio DOT) and may have its field personnel collect additional data for some crashes that occur. Finally, to measure mobility impacts, some type of traffic operations data must be obtained. Two basic types of such data exist:
- Electronic traffic surveillance data of conditions (e.g., speeds) at particular points on the roadway, or of elapsed travel time along a particular roadway segment; or
- Manual observations of queue durations and lengths by field personnel during work activities.
A summary of the main options for collecting mobility-related data at a work zone is provided in Table 5. These options are described in greater detail in the sections that follow.
| Method | Permanent or Temporary Devices? | Electronic or Manual Data Collection? | Point Measures or Segment Measures? |
|---|---|---|---|
| Existing Transportation Management Center Speed Sensors | Permanent | Electronic | Point |
| Work Zone Intelligent Transportation Systems | Temporary | Electronic | Point |
| Automatic Vehicle Location (AVL) data | Temporary | Electronic | Can be either, depending on use |
| Automatic Vehicle Identification (AVI) data | Permanenta | Electronic | Segment |
| License Plate Recognition data | Permanent or temporary | Electronic | Segment |
| Cellular Telephone/Bluetooth Tracking data | Permanent or temporary | Electronic | Segment |
| Field Personnel Queue Documentation | Temporary | Manual | Segment |
a Portable AVI readers could be developed for temporary applications, if desired
ELECTRONIC TRAFFIC MONITORING
Conditions at a Particular Point on the Roadway
Traffic surveillance data obtained at a point location generally relies on spot sensors. These types of sensors can provide the following:
- Volume counts
- Speeds
- Detector occupancies
Sensors can be permanently installed or temporary, and may be fixed or portable. The sensors may be inductive loops cut into the pavement, video detection cameras1, or microwave radar detectors located next to or over the roadway. For work zone performance monitoring, it is generally desirable to have such sensors located at periodic intervals along the roadway segment where a work zone exists, including the length upstream where queues due to the work zone may extend. Examining the data from several sensors along the roadway allows estimates of such things as queue lengths and travel times (computational procedures for doing this are described in the next chapter). The quality of these estimates depends on the spacing between sensors and other factors.
In many urban areas, spot sensor data can be easily obtained via existing transportation management systems that have already been installed for general roadway monitoring purposes. Unfortunately, some work zone activities will interfere with the normal operation of these systems because of the need to move communication lines, turn off power to the sensors from time to time, pave over sensors, etc. If such activities are planned for the project or if the project is located where permanent sensors are not available, it is necessary to rely on alternative data sources. For example, a deployment of a portable work zone ITS can be used to gather and store traffic sensor data for work zone performance measurement, even if the system is installed primarily for other purposes such as incident detection and response or driver advisories (16). Also, portable traffic surveillance devices have recently been developed that allow traffic sensor data to be easily collected for use in work zone performance measurement. One such device is illustrated in Figure 3. The device consists of a rechargeable power supply, wireless communication capabilities, radar, and a global positioning system (GPS) antenna, all self-contained within a standard traffic drum. The vendors of this device gather the data from each device, process it, and post it to an Internet site for access by the highway agency personnel or whoever else has been authorized to access. A smaller subset of that data can also be made available for viewing on a public website as well.
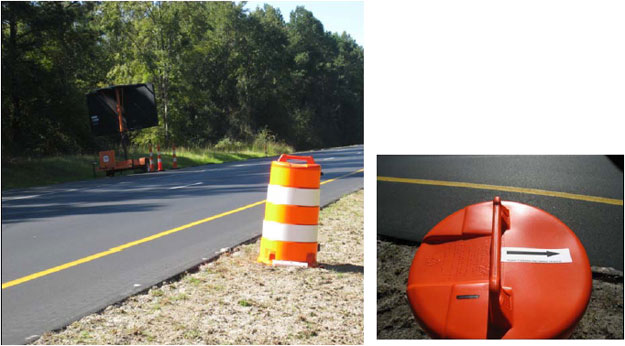
Figure 3. Illustration of a Portable Traffic Sensor Data Collection Device.
For both permanent and portable systems that rely on point measurements, the choice of sensor spacing will ultimately affect the accuracy of the analysis. A sensor spacing of one mile would yield an average queue length error of 0.5 mile, sensors spaced at 0.5-mile intervals would have an average queue length error of 0.25 mile, etc. Since queue lengths and delays are related, sensor spacing also affects the accuracy of estimated delays due to the work zone. The increased accuracy of closer sensor spacing must be balanced against the additional costs for more sensors and staff time to monitor and process the data. Also, it is more important to have sensor data over the entire length of congestion at a longer spacing than to have only a portion of the congestion that develops be monitored at a closer sensor spacing. Once a traffic queue extends upstream beyond the last sensor, it becomes impossible to estimate (even with a greater average error) the length of the queue or the delay that is generated.
Another unique data source that was examined as part of this pilot test effort was truck speed data obtained via transponders located within the trucks themselves. The database is used by private-sector companies to track freight movement. This is an example of automatic vehicle location (AVL) technology, which other types of private-sector fleet systems also use to monitor their fleet vehicle speeds and position. Transponders periodically upload vehicle position, direction of travel, and current speed via satellite to a database. The FHWA Office of Freight Management and Operations is sponsoring ongoing research on the use these data for freight performance measurement initiatives (17). For the work zone pilot test effort, available truck speed readings corresponding to the dates, times, and locations of work zone activity at the pilot tests were extracted from the overall database and “binned” in one-mile intervals along the roadway. Conceptually, this approach is similar to that of obtaining data at a point location and then assuming it represents conditions over some length (based on the distance between successive sensors). However, the selection of the roadway “bin” length must take into consideration the amount of truck traffic with transponders utilizing the roadway to allow for a large enough sample size that traffic conditions can be reasonably monitored. A drawback to the use of truck transponder data (as well as the segment-based travel measures discussed in the section below) is that it does not provide a way to obtain the traffic volume data necessary for estimating system-level impacts such as total vehicle-hours of delay and similar measures.
Travel Time Data along a Roadway Segment
Another traffic surveillance approach that can be used to monitor work zone mobility is the collection of vehicle probe data in the traffic stream to obtain speed and travel time information. A wide range of approaches exist on how such data can be obtained. These include:
- Automatic vehicle identification (AVI) technology
- License-plate recognition technology
- Cellular telephone tracking technology
- Blue-tooth tracking technology
It should be noted that, in addition to tracking current position and speeds at a point, AVL technology can also track instrumented vehicles continuously as they traverse a route and obtain elapsed travel times over a given roadway segment. Unfortunately, a very small portion of vehicles in a traffic stream will be outfitted with this type of technology. Furthermore, gaining access to that data from the fleet owners can be quite time-consuming, if access can be obtained at all.
Different than AVL technology, automatic vehicle identification (AVI) technology relies on antennae mounted at specific locations that can detect a uniquely-numbered sensor in a vehicle at each antennae location, and compute elapsed travel times between antennae locations. Electronic toll tag technology is perhaps the most common type of AVI system in use for this purpose. The real-time traffic map in Houston (see http://traffic.houstontranstar.org/layers/) relies on toll tags to estimate average freeway speeds throughout the region. The sensitivity of these data to changes in traffic conditions at specific locations along a route (such as at a work zone lane closure) depends on the spacing of the antennae used to track the vehicle probes, and the market penetration of the devices being monitored within the traffic stream. In some situations, it may be worthwhile to deploy portable antennae at strategic locations within and upstream of the work zone to capture AVI data and allow for a travel time measurement at a finer level of detail than would be possible by using travel time data over the longer segment length that is constantly being monitored. To be successful, this type of temporary supplemental deployment would need to occur prior to the start of the work zone so that comparable data was obtained before the start of construction.
Other technologies can also accomplish point-to-point travel time estimates, such as electronic license-plate recognition systems with plate number matching software. A license-plate recognition and matching system was successfully used for real-time travel time monitoring at a work zone in Arizona (18).
Most recently, researchers have been experimenting with the tracking of cellular telephone signals and/or devices that emit a Bluetooth signal as a way to obtain elapsed travel times (19, 20). These types of technologies are appealing to agencies because they do not require large investments in equipment to deploy. As with AVI and AVL systems, their effectiveness is dependent upon the level of market penetration and volume levels on the roadway segment. In addition, the accuracy with which the technology can pinpoint vehicle location influences the accuracy of the data that can be obtained. It should also be noted that, in some locations nationally, travel time data based on probe vehicles and other sources of travel-time data can be purchased from private-sector providers.
Regardless of the technology used, though, one primary drawback to using these types of probe systems is that they do not gather traffic volume data in any way. Consequently, traffic flows must either be estimated based on historical data or other information in order to estimate system-level impacts such as total vehicle-hours of delay.
MANUAL WORK ZONE MOBILITY MONITORING
Although there are various electronic traffic surveillance mechanisms available for use in monitoring work zone mobility impacts, a large number of work zone locations occur on roadways without such traffic surveillance capabilities. Furthermore, the functionality of spot-sensors and other technologies may actually be interrupted during construction activities due to the loss or relocation of power or communication lines, loss of structures to attach the sensors or antennae to, etc. Another approach to monitoring mobility impacts in work zones is to have personnel in the field document the duration and length of traffic queues that develop at the work zone. As stated earlier, the existence of a queue should be a key performance measure for work zones, as it pertains both to mobility concerns (queues create traffic delays) and safety concerns (the presence of queues is associated with increased rear-end crash potential). Direct monitoring and documentation of queues as a performance measure makes most sense at locations that normally have no congestion and queuing present. In this way, the queues that are documented can be attributed solely to the presence of the work zone. If queues and traffic congestion are normally present, some amount of “before” data will be required to factor out the pre-work zone impacts from what is observed during the work zone itself.
A simple form that can be used for documenting queue lengths by field personnel for this pilot test is provided in Table 6. The more detail that is gathered during each work zone activity that creates a traffic queue (generally, this will be periods when travel lanes are temporarily closed), the more accurate the estimates of the impacts upon work zone mobility. For the pilot test, field personnel were asked to measure or estimate queue lengths hourly as well as to document the times when queues began and ended for each work activity period. The personnel were asked to complete the form each work shift, regardless of whether queues developed, as a way to extract the other work zone exposure data of interest (hours of work activity and length of lane closures) and to verify that queues were monitored but just were not present during that particular shift. Although some field staff will faithfully document lane closure information during each work shift, previous studies suggest that the success of this practice varies widely from worker to worker (4).
Although the manual approach appears fairly simple, several questions remain unanswered as to its effectiveness for work zone performance measurement. First and foremost of these is whether field personnel can reasonably document queue conditions with enough accuracy and precision to be useful to agencies. Intuitively, the answer to this question likely depends on the level of importance given to the queue documentation task by field crew supervisors and managers, the workload of the person assigned to perform the documentation, and the extent of queuing itself.
SAFETY MONITORING DATA
The safety-related work zone performance measures listed in Table 4 imply the need for traffic volume data, project data, and actual crash data. Certainly, traffic volume data being collected through one of the electronic traffic monitoring methods for work zone mobility monitoring would be appropriate for work zone safety monitoring as well. If traffic volume data were not collected during the project, historical traffic counts or planning estimates of traffic volumes on the facility could be used as long as an assumption that traffic volume patterns on the facility were not changed by the work zone is reasonable. Project data would likewise be the same as is needed for work zone mobility monitoring.
The challenge exists with respect to work zone crash data. All states do have electronic crash databases that can be accessed to obtain crashes occurring in and around the limits of work zone limits over the duration of the project. Once that data is obtained, traditional crash rate computations can easily be made. However, timely access to crash data hampers many state DOTs for work zone safety performance measurement purposes. Many states have a six-month to one-year lag time in obtaining crash data. Such lag times limits analysis of work zone safety-related performance measures to post-project before-during comparisons performed months or years after a project has been completed. Given that the issue is one of safety data timeliness and not necessarily the data gathering techniques or computational procedures that challenge agencies, this pilot test effort focused exclusively on mobility-related work zone data acquisition, performance measurement computation, and interpretation.
| Date | Times of Work Activity | Times of Work Activity with Lane Closures | Queuing During Work Activity with Lane Closures | ||||||||||||||
|---|---|---|---|---|---|---|---|---|---|---|---|---|---|---|---|---|---|
| Time Begin |
Time End |
Dir of Travel |
Loc of Work |
Time Begin |
Time End |
Dir of Travel |
Loc of Clo- sure |
# Lns Clsd |
Time Q Starts |
Time Q Ends |
Q Lngth Hr 1 |
Q Lngth Hr 2 |
Q Lngth Hr 3 |
Q Lngth Hr 4 |
Q Lngth Hr 5 |
Q Lngth Hr 6 |
|
Notes:
Estimates of queue lengths approximately every hour are desired. However, the time can be adjusted slightly as necessary, as long as the reporting time is noted.
Locations of work and lane closures can be noted using mile markers, stations, etc.