Work Zone Rule Virtual Workshop (Presentation)
Printable Version [PPT 481 KB]
You will need the Microsoft PowerPoint Viewer to view this PowerPoint (PPT) file.
Contact Information: WorkZoneFeedback@dot.gov
Slide 1. Work Zone Rule Virtual Workshop
Rule State of the Practice Overview
Slide 2. Assessing the State of the Practice
- FHWA has identified several ways to assess the state of the practice and effects of the Rule:
- Review of 2008 Work Zone Self Assessment (WZSA) results
- Review of responses to five supplemental questions added to the 2008 WZSA
- Discussions with State and local agencies
Slide 3. What have we learned?
- Rule has brought about positive changes in practices and more focus on managing work zones, specifically in the following areas:
- Work Zone Policy
- Impacts Assessment
- Significant Project Identification
- Training
- TMP Development and Implementation
- Data Collection and Analysis
Speaker Notes:
The Work Zone Safety and Mobility Rule (Rule) has been effective since October 12, 2007. Since then, all States and local agencies that receive federal-aid funding have been required to follow the provisions of the Rule. The goal of the updated Rule is to encourage broader consideration of the safety and mobility impacts of work zones across project development, and the implementation of strategies that help manage these impacts during project delivery. Now that the Rule has been in effect for over a year, it is important to assess if changes are taking place in the way agencies manage and implement work zones that indicate that the goal of the Rule is being met. FHWA has identified several ways to measure the effectiveness of the Rule:
- Review of 2008 Work Zone Self Assessment (WZSA) results. FHWA has identified questions that relate directly to the Rule and is looking at the WZSA scores for these questions to see if there is a measurable increase that can be correlated to the Rule.
- Review of responses to a set of five supplemental questions added to the 2008 WZSA. These questions focus specifically on the Rule and are meant to help determine if the Rule has or has not caused change.
- Discussions with State and local agencies. FHWA will talk directly with work zone representatives from State and local agencies, as well as FHWA Division Offices, to learn more about the effects of the Rule. In addition, a series of webinar-based workshops will be held with the States and FHWA Division Offices in November and December 2008 and one component of these workshops will be to discuss the effects of the Rule.
Slide 4. 2008 WZSA Results
Largest increases were in practices related to Subpart J:
- Classifying projects based on impacts (Significant Projects) – 25%
- Training law enforcement personnel – 21%
- Establishing a policy to develop TMPs – 20%
Speaker Notes:
| Number/Topic | Question | Correlation to Rule | Change in Score |
|---|---|---|---|
| 4.1.1 Process to Determine Project Impact Type | Has the agency developed a process to determine whether a project is impact type I, II, III, or IV? | Policy – Are agencies including policy guidance and processes and procedures for identifying significant projects in their policies or as an extension of their policies? |
06–07: 12% |
| 4.4.9 Work Zone Training for Law Enforcement | Does the agency provide training to uniformed law enforcement personnel on work zone devices and layouts? | Training – Are more agencies now requiring training of law enforcement personnel? | 06–07: 21% 07–08: 21% |
| 4.1.6 Policies to Develop Transportation Management Plans | Has the agency established a policy for the development of Transportation Management Plans to reduce work zone congestion and crashes? | TMP – Are agencies more consistently and effectively developing TMPs? | 06–07: 20% 07–08: 20% |
| 4.1.4 Performance Measures for Work Zone Congestion and Delay | Has the agency established measures (e.g., vehicle throughput or queue length) to track work zone congestion and delay? | Data – Are agencies collecting and using operational data? Policy – Are agencies including performance standards/requirements in their policies to establish safety and mobility performance requirements for work zones? |
06–07: 13% 07–08: 17% |
Slide 5. WZSA Rule Supplemental Questions
- Supplemental question scoring scheme
| The Rule Has Caused Change | The Rule Has NOT Caused Change | Other |
|---|---|---|
|
|
|
Speaker Notes:
The 2008 Work Zone Self Assessment included five supplemental questions to determine if the Rule has caused a change in work zone safety and mobility. These questions, as well as the scoring scheme, were developed in early 2008 in coordination with the Operations Council Work Zone Working Group.
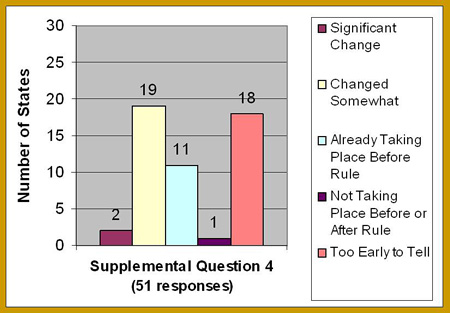
Overall, the supplemental questions show that agencies have experienced some change as a result of the Rule in their practices. The area experiencing the most change is the training provided to agency staff. The area experiencing the least amount of change is the expansion of work zone management beyond traffic safety and control to address mobility through the consideration and use of transportation operations and public information strategies as this practice was already taking place for almost half of the agencies prior to the Rule.
Slide 6. Work Zone Policy
- Biggest change – Agencies have pulled together several disparate policy documents and procedures/guidelines into one WZ policy/guidelines.
- Some agencies did not have a policy for MOT in work zones and have now developed one as a result of the Rule.
- 21 agencies (41%) have reported that as a result of their WZ Policy, they are taking a more consistent approach to planning, designing, and constructing road projects
Slide 7. Work Zone Policy (cont.)
- Many agencies mentioned they are now considering WZ impacts earlier in the project development process.
- Some agencies have established goals and measures for WZ performance (e.g., queues, delay time) as a result of the Rule.
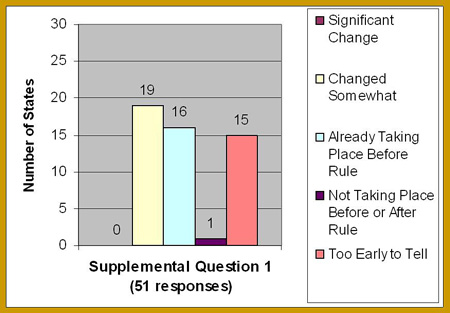
Slide 8. Impacts Assessment
- The agency is seeing enhanced consideration and management of WZ safety and mobility impacts – starting during planning and continuing through project completion
- 24 agencies (47%) experienced this as a result of the Rule
- 3 of those agencies cited the Rule as causing a significant change in this area
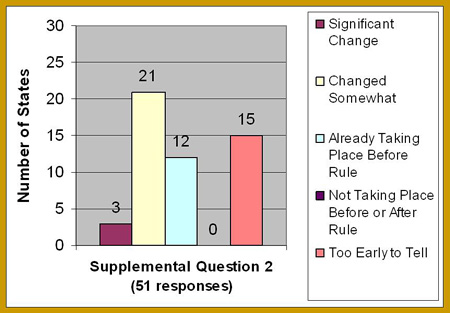
Slide 9. Impacts Assessment (cont.)
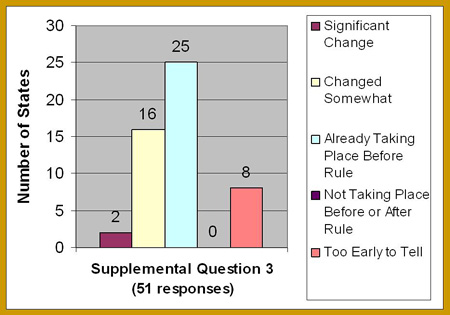
- While planning and designing road projects, the agency is expanding planning beyond the project work zone itself to address corridor, network, and regional issues – particularly when congestion is an issue.
- 19 agencies said the Rule had caused this to occur
- 17 agencies said the Rule had not caused change because most of those agencies (16) were already doing this
Slide 10. Impacts Assessment (cont.)
- Agencies also indicated that they are more often using analytical tools to determine WZ impacts
- 10 to 15% increase in score each of the past 2 years on the 2 related WZ SA questions:
- During planning to assess impacts of future construction/maintenance activities
- To assess impacts when developing TCPs
- 10 to 15% increase in score each of the past 2 years on the 2 related WZ SA questions:
Slide 11. Significant Project Identification
- Agencies are thinking more about project impacts and are more likely to have a process in place to classify projects based on expected impacts
- As a result, they are better able to assess and manage WZ impacts
- WZ SA shows a 25% increase in score between 2007 and 2008 in this area
- Several States said that they organize a team to develop the plan for mitigating the impacts of significant projects
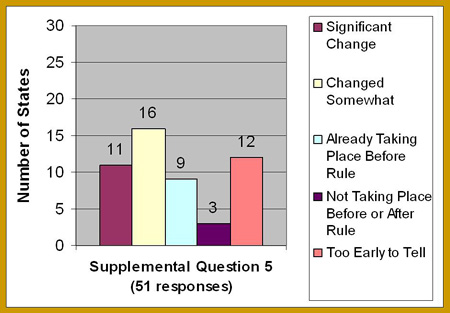
Slide 12. Training
Training has been significantly affected by the Rule
- 27 agencies (53%) said that as a result of the Rule they had updated/changed training for their staff (designers, planners, construction staff, etc.) to address broader consideration of WZ impacts and management in the scheduling, design, and implementation of projects
- 11 of those agencies said they had made significant changes in training
- WZ SA question on law enforcement training saw a 21% increase in score from 2007 to 2008
Slide 13. Training (cont.)
- The agency has updated/changed training for its staff (designers, planners, construction staff, etc.) to address broader consideration of work zone impacts and management in the scheduling, design, and implementation of projects.
Slide 14. TMP Development and Implementation
- Most agencies (90%) now have a policy for developing TMPs to help manage the WZ impacts of a project
- WZ SA shows a major score increase (20%) from 2006 to 2007 and again from 2007 to 2008
- Some agencies have developed TMP teams and tools
Slide 15. Use of TMP Strategies
- The agency is expanding WZ management beyond traffic safety and control to address mobility through the consideration and use of transportation operations (TO) and public information (PI) strategies.
Slide 16. Data Collection and Analysis
Increasing number of agencies report they are establishing measures and collecting data to track WZ congestion and delay
- Likely related to the addition of operational data to data provision when the Rule was updated
- Agencies establishing measures to track WZ congestion and delay increased 26% (from 23 to 29 agencies) between the 2007 and 2008 WZ SA, which continued a significant increase of the year before
- WZ SA indicates a 21% score increase between 2006 and 2007 and a 15% increase from 2007 to 2008 for the question on collecting data to track WZ congestion and delay
- Several agencies have started tracking queues