Project 1120-11-03
WIS 26 – Breezewood Lane
US 41
Winnebago County
Traffic Management Plan
Attachments
Attachment A – US 41 Traffic Study – Winnebago County Base Year 2005 Traffic Volume Network
Attachment B – US 41 Traffic Study – Winnebago County Year 2035 Traffic Operations Analysis
Attachment C – US 45 Detour Plan
Attachment D – WIS 21 Detour Plan
Attachment E – TRADAS ADT Volumes for July 2006
Attachment F – WIS 76 Detour Plan
Attachment G – CTH K Overpass Detour Plan
Attachment H – Witzel Avenue Overpass Detour Plan
Attachment I – US 41 SB Exit Ramp to WIS 21 Truck Detour Plan
Attachment J – US 41 Winnebago County Construction Schedule
Attachment K – Detail for Construction Access to USH 41
Attachment A – US 41 Traffic Study – Winnebago County Base Year 2005 Traffic Volume Network
MEMORANDUM:
USH 41 Traffic Study - Winnebago County
Base Year 2005 Traffic Volume Network
TO: Tom Buchholz/WisDOT Northeast Region
FROM: Andrea Guptail/CH2M HILL, Brian Roper/ CH2M HILL
CC: Rich Coakley / CH2M HILL
DATE: June 7, 2006
RE: Project LD. 1120-11-03, STH 26 - Breezewood Lane
Introduction
This memo summarizes existing traffic volumes within the study area. Figures depicting the traffic volumes are included in Appendices A-C. The study area extends from 1/2 mile south of the 5TH 26 interchange to 1/2 mile north of the Breezewood Lane interchange, a distance of 15 miles. The U5H 41 mainline, ramps, and crossroads between 5TH 26 and Breezewood Lane, are included with the following interchanges:
- STH 26
- STH44
- 9th Avenue
- STH 21
- USH45
- STH 76
- Breezewood Lane
In addition, traffic data was collected at the CTH E overpass and along frontage roads near the USH 45 interchange.
Traffic Data Collection
In the fall of 2005, traffic data were collected throughout the study area. Twelve-hour turning movement counts were conducted at thirty-three intersections by staff from TranSmart Technologies, Inc. (TranSmart).
Mainline, ramp, and crossroad data was collected by Traffic Analysis and Design, Inc. (TAD) staff using Peek ADR 1000 automatic traffic recorders and by WisDOT staff at Automatic Traffic Recorder (ATR) stations located on USH 41. TAD's mainline and ramp setups were meant to collect classification counts, while the crossroad locations only collected the total number of vehicles. Most of the mainline locations were recounted in May 2006.
Base Year Network Development
After the traffic data was collected, the individual values were reviewed for reasonableness and consistency. This process included comparison of daily, AM peak hour, and PM peak hour values to the 2004 Wisconsin Highway Traffic Volume Data book and to the 2000 base year network from the previous study. In addition, peak hour volumes from the turning movement counts were compared to the USH 41 ramp counts.
At the USH 41 mainline locations counted by TAD in the fall of 2005, the volumes were significantly lower than counts taken in previous years. Upon further review and discussion, it was determined that the setup used to collect classification data for both lanes simultaneously had unwittingly resulted in significant undercounting. As a result, the A TR data was used with the ramp volumes to synthesize the remaining mainline data. Many of these synthesized values were revised upward slightly after considering the factored recounts collected in May 2006.
This data was applied to the study network, with adjustments made as necessary to the individual values to achieve balanced traffic. The balanced AADT volumes for the mainline sections and ramps are shown in Appendix A. The AM and PM peak period traffic volumes for the mainline sections and ramps are shown in Appendix B. For the seven interchange crossroads and the two other locations, AM and PM peak period traffic volumes are shown in Appendix C.
Appendix A: Existing AADT Traffic Volumes Summary Figures
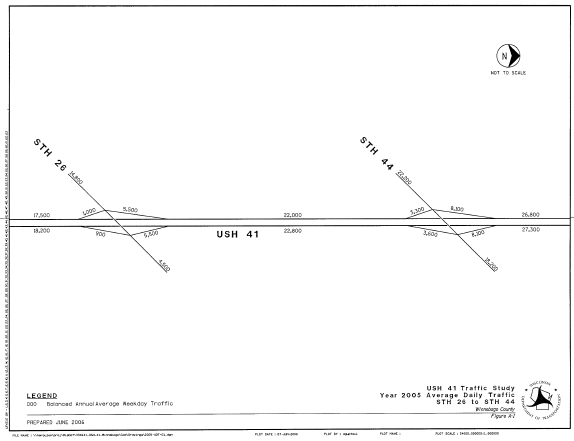
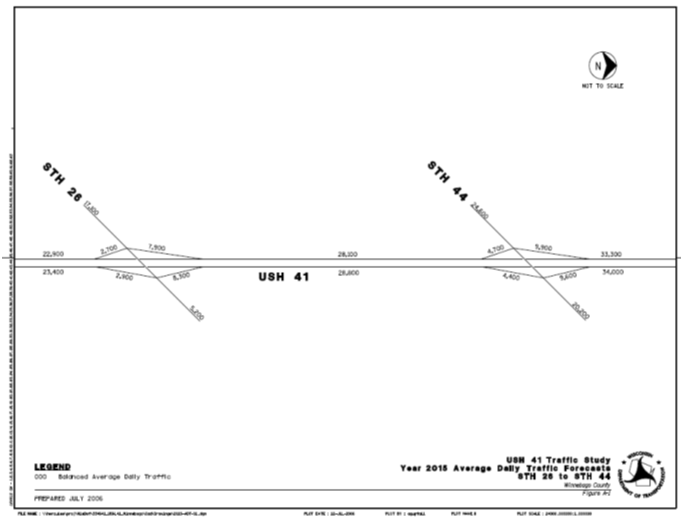
Summary: Appendix A of Attachment A shows the base year 2005 existing US 41 AADT volumes for the mainline sections and ramps. It includes images showing AADT for STH 26 to STH 44, 9th Avenue to USH 45, STH 76, and Breezewood Lane.
Image Description: The sample image below shows AADT for STH 26 to STH 44. AADT on the northbound lanes of US 41 between these two roads is 22,800 and on the southbound lanes it is 22,000.
Appendix B: Existing Mainline and Ramp AM and PM Peak Hour Volumes
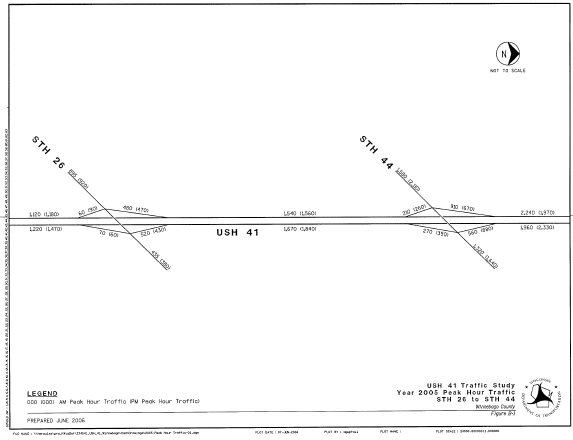
Summary: Appendix B of Attachment A shows the base year 2005 existing US 41 AADT volumes for the mainline sections and ramps during the AM and PM peak hours. It includes images showing AADT for STH 26 to STH 44, 9th Avenue to USH 45, STH 76, and Breezewood Lane.
Image Description: The sample image below shows AADT during the AM and PM peak hours for STH 26 to STH 44. AADT on the northbound lanes of US 41 between these two roads is 1,670 during the AM peak hour and 1,840 during the PM peak hour. On the southbound lanes it is 1,540 during the AM peak hour and 1,560 during the PM peak hour.
Appendix C: Existing Intersection AM and PM Peak Hour Volumes
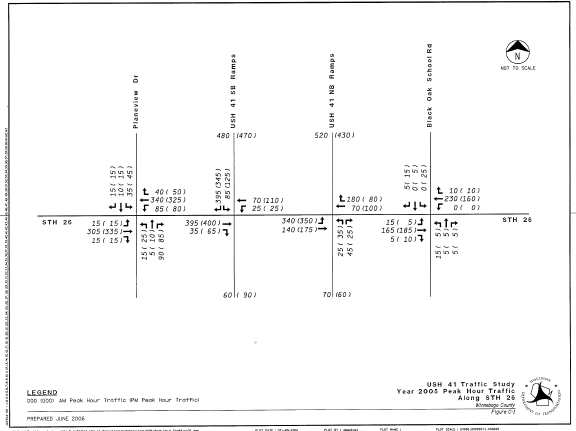
Summary: Appendix C of Attachment A shows the base year 2005 existing US 41 AADT volumes for the intersections during the AM and PM peak hours. It includes images showing AADT for intersections along STH 26, STH 44, 9th Avenue, CTH E, STH 21, USH 45, Fountain Avenue & Snell Road, STH 76, and Breezewood Lane.
Image Description: The sample image below shows AADT during the AM and PM peak hours for the intersections along STH 26. There are four intersections along STH 26. One of these intersections is to the US 41 Northbound Ramps and the other is to the US 41 Southbound Ramps. Northbound AM Peak Hour AADT on the road leading to the US 41 Southbound Ramp is 480 and PM Peak Hour AADT is 470. Northbound AM Peak Hour AADT on the road leading to the US 41 Northbound Ramp is 520 and PM Peak Hour AADT is 430.
Attachment B – US 41 Traffic Study – Winnebago County Year 2035 Traffic Operations Analysis
MEMORANDUM:
USH 41 Traffic Study - Winnebago County
Forecasted Traffic Volume Network
TO: Tom Buchholz/WisDOT Northeast Region
FROM: Andrea Guptail/ CH2M HILL, Brian Roper / CH2M HILL
COPIES: David Cipra/WisDOT Traffic Forecasting Section, Walt Raith/East Central Wisconsin Regional Planning Commission, Rich Coakley / CH2M HILL
DATE: July 14, 2006
RE: Project J.D. 1120-11-03, 5TH 26 - Breezewood Lane
Introduction
This memo summarizes forecasted traffic volumes within the study area. The U5H 41 traffic study corridor extends from 1/2 mile south of the 5TH 26 interchange to 1fz mile north of the Breezewood Lane interchange, a distance of 15 miles. The study includes freeway, ramp, and crossroad facilities at the following interchanges:
- STH26
- STH44
- 9th Avenue
- STH21
- USH45
- STH76
- Breezewood Lane
In addition, forecasted traffic was developed at the CTH E overpass and along the frontage roads near the U5H 45 interchange.
Traffic Forecasting Methodology and Assumptions
Existing Traffic Volumes
A common base year 2005 was used to develop forecasts along the USH 41 corridor. Existing peak hour and ADT volumes were obtained from traffic counts of the mainline segments and ramps and from intersection turning movements. These volumes were reviewed, adjusted, balanced, and subsequently established as accepted existing data.
The development of existing data was previously discussed in the USH 41 Traffic Study - Winnebago County Base Year 2005 Traffic Volume Network memorandum.
Existing Travel Demand Model
The corridor study limits are within the planning area covered by the East Central Wisconsin Regional Planning Commission (ECWRPC). As the regional Metropolitan Planning Organization (MPO), ECWRPC tracks data, applies travel demand models and coordinates with WisDOT's Traffic Forecasting Section (TFS) to develop forecasted data for the area. Currently, ECWRPC forecasts traffic to the year 2035 using a recently developed travel demand model which links the Fox Cities and Oshkosh urbanized areas. In contrast, forecasts for the previous corridor study completed in 2002 were to the year 2020 from two separate models.
Future Study Years
While establishing the scope of this project, two study years were designated for traffic projection on the corridor and at the interchanges. Given the estimated timing of construction, traffic forecasts were developed for the years 2015 (Construction Year) and 2035 (Design Year). Year 2015 traffic forecast figures are shown in Appendix B and year 2035 traffic forecast figures are shown in Appendices B and C.
The Year 2035 forecasts are mote comprehensive, encompassing AADT and peak period projections for mainline, ramps, and intersections in the corridor. In contrast, only AADT forecasts of the mainline corridor were developed for Year 2015.
Forecast Development
ECWRPC provided two sets of Year 2035 ADT forecasts from the regional travel demand model. One set represented the unadjusted model assignment, while the other set had been adjusted to compensate for the difference between the 2004 ground counts and the base year assignments. Coverage included freeway segments, ramps, and crossroads.
WisDOT's TFS also provided two sets of Year 2035 ADT forecasts for the mainline only. One set of forecasts was based on (but not the same as) the regional travel demand model. The other set had been adjusted to reflect professional judgment. In addition, the Year 2025 ADT and peak period forecasts prepared for the previous USH 41 corridor study were projected forward to Year 2035 to provide another point of comparison.
Year 2035 AADT forecasts for the USH 41 mainline and ramps were selected through a careful review of the various sources described above. The values were adjusted and balanced accordingly throughout the corridor. Year 2035 AADT forecast figures are shown in Appendix B. The Year 2015 AADT mainline forecasts were estimated by interpolating between the Year 2005 Base Network values and Year 2035 forecasts. Year 2015 AADT forecast figures are shown in Appendix A.
Year 2035 peak period forecasts for the USH 41 mainline and ramps were developed by applying the 30-year AADT growth rate to the balanced base year network. The resultant values were then adjusted and balanced accordingly throughout the corridor. Year 2035 peak hour forecast figures are shown in Appendix C.
Along the crossroads, the established Year 2035 ramp forecasts were used in conjunction with anticipated crossroad growth rates to generate peak period turning movement forecasts. The resultant values were then adjusted and balanced accordingly along each crossroad. Year 2035 peak hour forecast figures are shown in Appendix C.
The forecasts presented in this memo have undergone review by staff from WisDOT TFS and ECWRPC Both agencies have approved these forecasts for use in future operation analysis and design tasks.
Truck Percentages
Future pavement design calculations will require the estimate of truck percentages by axle classification for the construction and design years. For the USH 41 Traffic Study corridor, these percentages have been developed from existing and project-specific data. The percentages are applicable to both the construction and design year.
The USH 41 mainline truck classifications were based on the information contained in the 2004-Wisconsin Vehicle Classification Data book. Classification data was available for three segments along USH 41 within the USH 41 Traffic Study Corridor: north of STH 76, south of STH 21, and south of STH 26. For the remaining segments, the truck data was averaged between adjacent count locations. This information-is presented in Table 1.
USH 41 ramp and crossroad truck classification data was obtained from traffic counts taken in October and November of 2005. This information is presented in Tables 2 and 3.
Appendix A: Year 2015 AADT Traffic Forecasts Summary Figures
Summary: Appendix A of Attachment B shows forecasted AADT for 2015 for the mainline sections and ramps. It includes images showing forecasted 2015 AADT for STH 26 to STH 44, 9th Avenue to USH 45, STH 76, and Breezewood Lane.
Image Description: The sample image below shows forecasted 2015 AADT for STH 26 to STH 44. AADT on the northbound lanes of US 41 between these two roads is 28,800 and on the southbound lanes it is 28,100.
Appendix B: Year 2035 AADT Traffic Forecasts Summary Figures
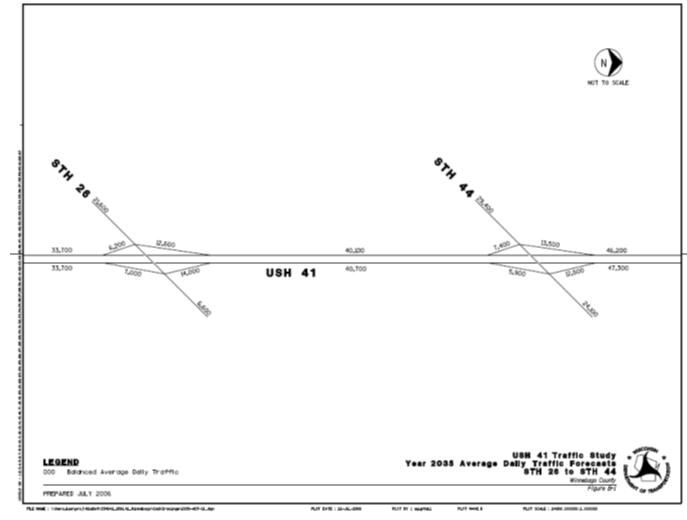
Summary: Appendix B of Attachment B shows forecasted AADT for 2035 for the mainline sections and ramps. It includes images showing forecasted 2015 AADT for STH 26 to STH 44, 9th Avenue to USH 45, STH 76, and Breezewood Lane.
Image Description: The sample image below shows forecasted 2035 AADT for STH 26 to STH 44. AADT on the northbound lanes of US 41 between these two roads is 40,700 and on the southbound lanes it is 40,100.
Appendix C: Year 2035 AM and PM Peak Hour Traffic Forecasts Summary Figures
Summary: Appendix C of Attachment B shows forecasted AADT for 2035 for the AM and PM peak hours for the mainline sections and ramps and for intersections. It includes images showing forecasted 2035 AADT AM and PM peak hours for STH 26 to STH 44, 9th Avenue to USH 45, STH 76, and Breezewood Lane and for intersections along STH 26, STH 44, 9th Avenue, CTH E, STH 21, USH 45, Fountain Avenue & Snell Road, STH 76, and Breezewood Lane. Image Description: The sample image below shows forecasted 2035 AADT for the AM and PM peak hours for STH 26 to STH 44. AADT during the AM peak hour on the northbound lanes of US 41 between these two roads is 3080 and during the PM peak hour is 3390. On the southbound lanes, AM peak hour AADT is 2900 and PM peak hour AADT is 2930.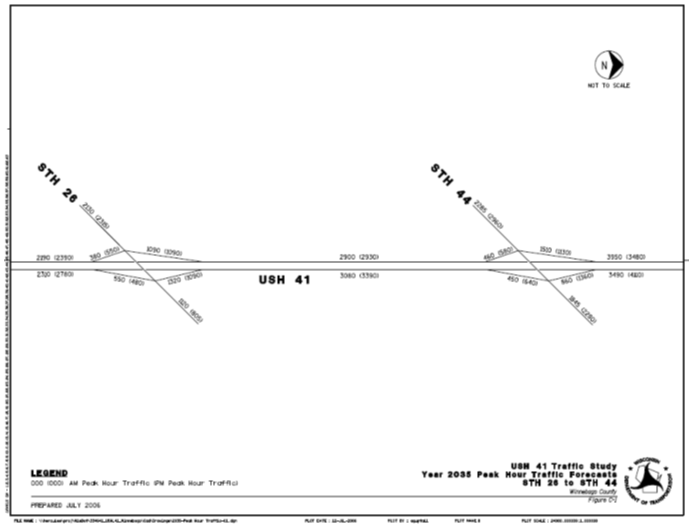
Attachment C – US 45 Detour Plan
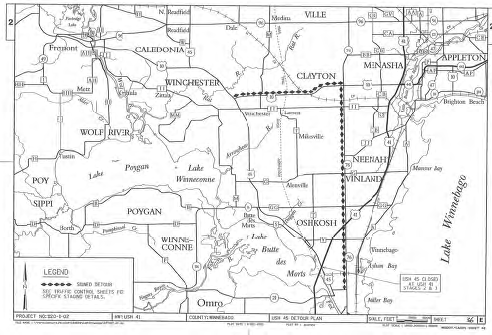
Summary: Attachment C is a map showing the detour plan for US 45.
Image Description: The map shows a signed detour route on highways 76 and 10 from Oshkosh to Clayton.
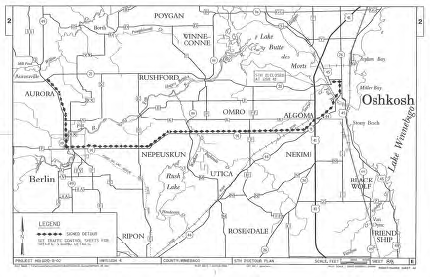
Attachment D – WIS 21 Detour Plan
Summary: Attachment D is a map showing the detour plan for WIS 21
Image Description: The map shows a signed detour route on highway 91 from Aurora, through Nepeuskun, to Oshkosh.
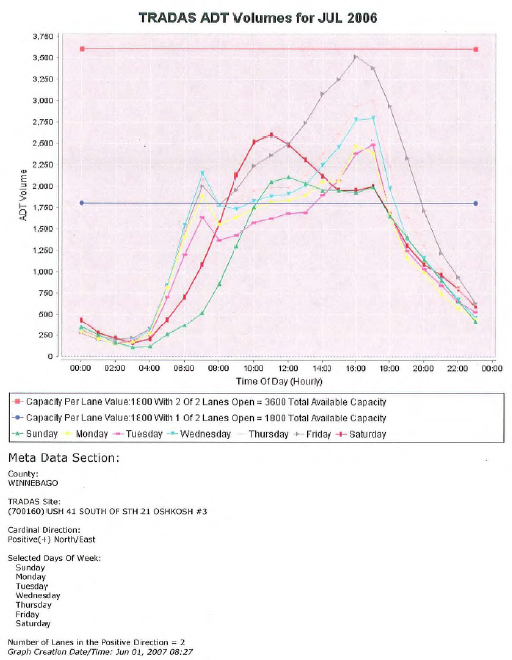
Attachment E– TRADAS ADT Volumes for July 2006
Summary: Attachment E includes four graphs showing TRADAS ADT volumes for July 2006 for US 41 south of STH 21 Oshkosh for North/East and South/West and for US 41north of STH 76 for North/East and South/West.
Image Description: The sample graph below shows TRADAS ADT volumes for July 2006 for US 41 south of STH 21 Oshkosh in the North/East direction. The graph shows that volume is near capacity with both lanes open at 4 pm on Friday and is above capacity on all days from 2-6 pm and on Monday, Wednesday, Thursday and Friday at 6 am with only one of two lanes open.
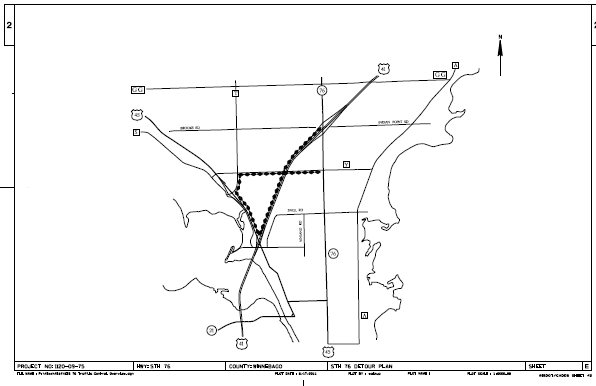
Attachment F – WIS 76 Detour Plan
Summary: Attachment F is a map showing the detour plan for WIS 76.
Image Description: The map shows a signed detour route on highway 41 and 45.
Attachment G – CTH K Overpass Detour Plan
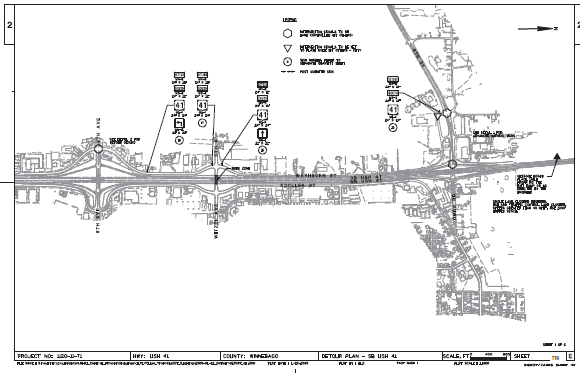
Summary: Attachment G is a set of six maps showing the detour plan for the CTH K Overpass on Southbound US 41.
Image Description: The sample map below shows a detour on Koeller Street, with signals at the intersection with the CTH K Overpass set to flash mode.
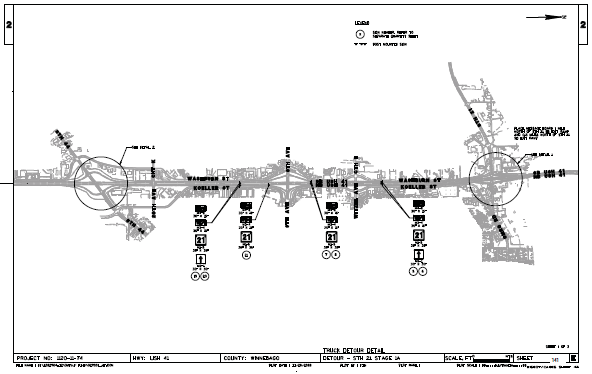
Attachment H – Witzel Avenue Overpass Detour Plan
Summary: Attachment H is a set of six maps showing the detour plan for the Witzel Avenue Overpass on Southbound US 41.
Image Description: The sample map below shows a detour on the 9th Avenue overpass, with the intersection signals to be hand controlled.
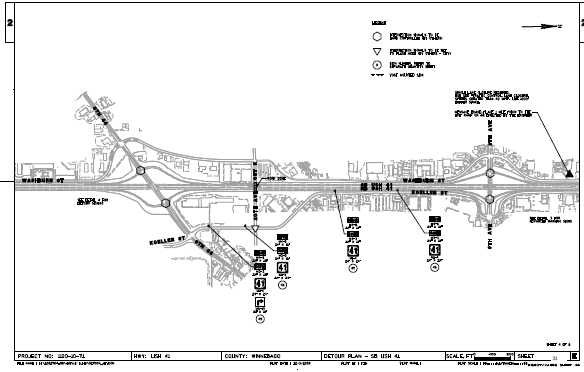
Attachment I – US 41 SB Exit Ramp to WIS 21 Truck Detour Plan
Summary: Attachment I is a set of three maps showing the truck detour plan for the US 41 Southbound Exit Ramp to WIS 21.
Image Description: The sample map below shows a detailed map of the truck detour plan for the US 41 Southbound Exit Ramp to WIS 21.
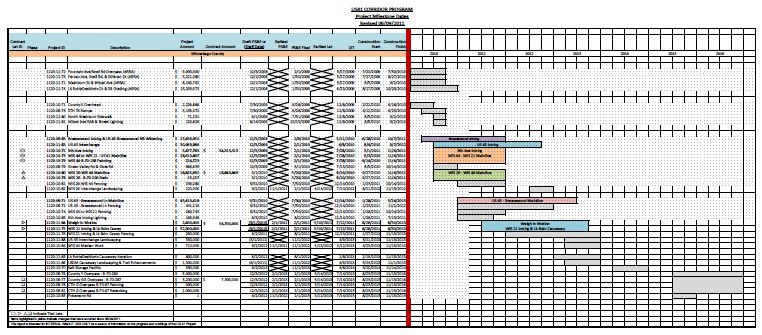
Attachment J – US 41 Winnebago County Construction Schedule
Summary: Attachment J is a GANTT chart showing the overall construction schedule for US 41 in Winnebago County.
Image Description: The GANTT chart includes the project ID, project description, project amount, contract amount, draft PS&E or (shelf date), earliest PS&E date, PS&E final date, earliest let date, let date, construction start date, and construction finish date for each individual project. The first construction start date is July 20, 2009 for the Fountain Avenue/Snell Road Overpass, and the final construction finish date is November 15, 2016 for the County Y Overpass, County GG Overpass, CTH G Overpass Painting, and CTH G Overpass Redecking.
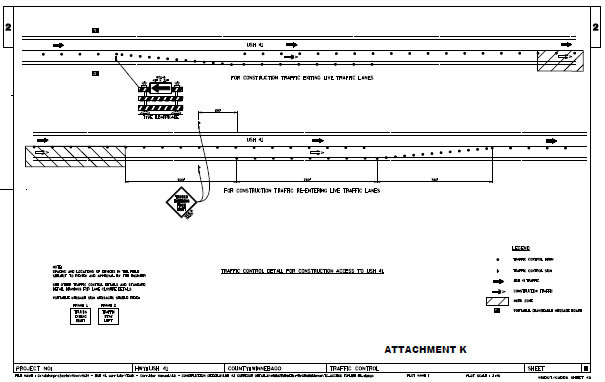
Attachment K – Detail for Construction Access to USH 41
Summary: Attachment K is a chart showing traffic control detail for construction access to USH 41.
Image Description: The image shows the placement of traffic control drums, traffic control signs, and portable changeable message boards along USH 41. It also shows where construction traffic will exit and re-enter live traffic lanes. It notes that frame 1 of portable changeable message signs should read, "Trucks exiting right," and frame 2 should read, "Traffic stay left."