Module 4: Work Zone Impacts Assessment
Printable Version [PDF 28.32MB]
PDF files can be viewed with the Acrobat® Reader®.
Contact Information: WorkZoneFeedback@dot.gov
slide 1
Module 4: Work Zone Impacts Assessment
![]()
narrator notes
This module focuses on a work zone impacts assessment process and benefits during the project development and delivery stages. An important part of TMP development is having a good understanding of what work zone impacts are likely for an upcoming project. This understanding is critical to identifying what strategies are needed for the TMP.
slide 2
About Module 4
- Overview
- Types of Impacts
- Why and When Assess Impacts
- Work Zone Impacts Assessment Process
- Exercise
narrator notes
Module 4 provides an overview of work zone impacts assessment, then discusses the types of impacts; why and when to assess impacts; and a process that can be used for work zone impacts assessment. The module will end with an exercise to help you apply what you have learned.
slide 3
Overview – Impacts Assessment
- Process of understanding safety and mobility impacts through all project phases
- Project development – Assess impacts and develop TMP
- Construction – Implement TMP and monitor the impacts; make adjustments, as needed
- Post Construction – Performance assessment
Assessments should be proportional to the type, size, duration, and complexity of the project.
narrator notes
Work zone impacts assessment is the process of understanding the safety and mobility impacts of a road project, whether new construction or a rehabilitation project. This is conducted during three project stages:
- During project development, the likely work zone impacts are estimated and where possible mitigated.
- During construction, the TMP is implemented and the actual impacts are gauged against what was expected. If actual impacts are greater than allowable, alternative work zone strategies may be implemented.
- Following project completion an assessment is helpful to determine what worked and what did not. The results of the assessment should be used to improve future TMPs.
The idea of conducting a work zone impacts assessment for every alternative may seem daunting. However, the assessment should be proportional to the type, size, duration, and complexity of the project. For many projects a qualitative assessment may be sufficient, with a quick identification and documentation of work zone impacts issues. The screening of small projects or those likely to have minimal impacts could be done with templates or simplified tools so that analysts can concentrate their efforts on projects that are likely to cause greater impacts.
slide 4
Overview – Goal
- Keep work zone impacts to an acceptable level
- Keep Agency from being surprised after project is underway
-> when it may be too late to add strategies that significantly reduce impacts
narrator notes
A good impacts assessment will consider potential impacts due to the work zone from the early stages of the project and will develop appropriate strategies to mitigate those impacts or at least keep them within the Agency thresholds.
It will also help keep the Agency from being surprised by unexpected traffic issues after the project is underway. Unexpected traffic issues can put the Agency in the news in undesirable ways, and are usually more difficult to fix once the project is underway.
slide 5
Overview – Basic Concept
- Determine expected impacts of project
- Acceptable? If yes, no problem
- Develop TMP (may only have TTC component)
- Unacceptable?
- Can strategies be found to mitigate impacts to acceptable level?
- Yes – develop TMP with those strategies
- No – consider changes to project scope if feasible, get any special approvals, determine strategies to best manage impacts, advise stakeholders of possible problems
- Can strategies be found to mitigate impacts to acceptable level?
- Acceptable? If yes, no problem
narrator notes
When the identified impacts are unacceptable, the TMP will be more comprehensive. If the impacts are acceptable, the TMP may only contain the temporary traffic control plan. This is a very basic TMP. When the anticipated impacts exceed acceptable levels or the Agency's thresholds, the design team needs to take additional steps to manage these negative impacts.
slide 6
Types of Impacts
narrator notes
Work zones can cause a variety of impacts that affect different stakeholders.
Worker safety is critical since workers are subject to the direct dangers of moving traffic. Motorist safety is critical as drivers are subjected to unfamiliar driving conditions in work zones. Work zone capacity reductions impact the mobility of traffic, including freight, leading to queues and delays that can reduce mobility.
The transportation network is impacted when a work zone can't serve all the demand, or detours traffic to surrounding roads. Depending on the location, size, and complexity of a project, a work zone can also impact the access, mobility, and safety of pedestrians, bicyclists, transit users, and business and property owners, as well as emergency services.
A work zone impacts assessment should consider all the potential impacts.
slide 7
Mobility Impacts – Examples
- Delay:
- Increased travel times
- Reduced quality of life issues
- Queues and complete stoppages
- Reduced throughput
- Freight Interference:
- Travel time reliability – biggest concern
- Delayed deliveries
- Unanticipated costs
- Emergency response
narrator notes
One of the key concerns of any work zone is the mobility impacts. Traffic delays and queues through a work zone can impact road users in many ways such as:
- Increased travel time for road users
- Increased time for emergency response
- Higher emissions resulting in reduced quality of life, and
- Aggressive driving as a result of longer queues.
Trucks carrying freight can also be delayed, resulting in delayed deliveries and unanticipated costs. Work zone mobility impacts can also delay construction vehicles trying to reach the job site, delaying delivery of materials and reducing productivity.
slide 8
Safety Impacts – Examples
- Road user exposure to hazards
- Will staging create safety hazards greater than existing?
- Worker exposure to traffic:
- Does staging allow for positive protection?
- Safe access/egress for work vehicles?
- Geometrics during phases
- Speed reduction necessary/considered?
narrator notes
Similar to mobility impacts, safety impacts need to be considered and managed or eliminated. Road users may encounter unsafe conditions due to:
- Lack of positive guidance within work zone,
- Signage and sign spacing not suitable to the prevailing speed,
- Sudden lane changes and other geometric changes,
- Inadequate worker protection, and
- Inadequate lighting for night work either for workers or at key driver decision points.
In some situations, such as where geometrics change, the speed limit may need to be reduced and accompanied by visible enforcement.
slide 9
Impacts May Differ by Area
Work Zone Impacts:
- Urban
- More detour routes
- More recurring congestion
- Variety of traffic
- Scheduling restrictions
- Right-of-Way restrictions
- Non-motorized issues
- Rural
- Fewer, longer detour routes
- Less recurring congestion
- Motorists unfamiliar with the road and the area
- Heavy vehicle composition
narrator notes
Work zones in different areas can lead to different impacts and challenges.
Urban areas have developed networks which may allow traffic to be detoured easier than in rural areas. But urban areas are also more likely to be congested and have more traffic modes such as pedestrians and transit, making the phasing of temporary traffic control a greater challenge.
Rural areas have fewer or longer alternate routes, making it difficult to detour traffic. Also in rural areas, it may be more difficult to inform motorists unfamiliar with the road and the area.
slide 10
Why Assess Work Zone Impacts?
Work zone impacts assessment helps to:
- Identify and understand expected impacts
- Compare project alternatives
- Determine if the project is significant
- Identify strategies to manage expected impacts
- Estimate costs and allocate appropriate resources
narrator notes
A work zone impacts assessment helps to identify potential work zone issues that could arise due to the proposed project scope and design and brings them to the attention of the Agency, project team, and other stakeholders. The assessment estimates the work zone impacts of various build options so they can be considered during alternatives analysis.
Once an alternative is selected, impacts assessment helps an Agency determine if the project is a significant project and identify strategies to manage the likely impacts. It also provides an opportunity for the Agency to estimate costs early, and thus helps to avoid any under allocation of funds for TMP implementation.
slide 11
Extent of Impacts Assessment
- Traffic analysis is usually conducted for:
- Existing conditions
- Proposed construction conditions/alternatives (affected roads)
- Traffic analysis of existing conditions helps to:
- Provide baseline to compare construction scenarios
- Identify extent of possible traffic backups and affected routes
- Traffic analysis of construction conditions helps to:
- Select alternative options/routes with least impact
- Design-Build – operational analysis done along with design
narrator notes
The extent of an impacts assessment is determined by Agency guidelines. A detailed assessment including traffic analysis is more often done for significant projects with moderate-to-major level of impacts. During analysis, existing conditions are compared with proposed work zone alternatives to determine where traffic delays or queuing may occur. This type of analysis allows the work zone designer in modeling his design prior to implementation and so identify the level of impacts on various routes and locations.
In Design-Build projects, the construction proceeds along with the design. In such cases, often the operational analysis is done along side the design, within a few weeks of actual construction. The inclusion of clear processes and procedures in the contract requirements are needed to ensure that the Contractor undertakes impact assessment, identifies any negative impacts, and implement strategies to alleviate those impacts.
slide 12
Need for Early Impact Assessment
- Start impacts assessment early in project development
- This helps to:
- Identify issues/problem areas
- Consider WZ impacts in design alternative analysis
- Ensure MOT alternatives analysis is done along design alternatives analysis
- Choose a design alternative that alleviates many WZ impacts
- Ensure TMP development and implementation costs are included in the project budget
Helps in selecting the best project option.
narrator notes
Beginning work zone impacts assessment early in the life of a project can significantly increase the chances of successful traffic management for the project.
An assessment of work zone impacts during the early planning stages of the project will help identify issues or uncover problem areas that should be considered during project development. This provides the Agency with an opportunity to evaluate the work zone impacts along with the design alternatives analysis, which can lead to the selection of a design alternative that alleviates many of the work zone impacts. This also helps to allocate adequate funding in the project budget for TMP implementation.
slide 13
Need for Early Impact Assessment
- Difficult to change options at a later stage due to issues such as:
- Affecting the chosen preferred alternative
- Environmental impact study already done
- Need for additional analysis
- May incur additional costs
narrator notes
Another key reason to consider work zone impacts early is because it enables the project team to include maintenance of traffic in the alternative analysis, when most options are available. If this is not done, and the Agency finds out later that the preferred alternative that was chosen has too many work zone impacts, it will be difficult to change options. Later, time and money may have already been invested in right of way or an environmental impact study, making the Agency reluctant to change alternatives and incur additional delay and cost.
slide 14
Early Impact Assessment - Example
11th Street Bridge Reconstruction, Washington, D.C.
- Considered MOT and impacts from the preliminary stages
- Resulted in design alternative that alleviated many work zone impacts
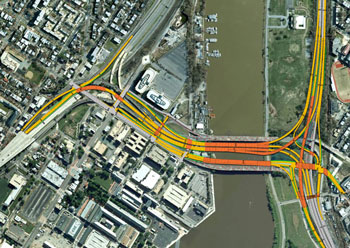
Approximately 70% of the project has minimal impact to the existing roadway network.
narrator notes
This is an example of a design build project where many of the impacts were eliminated during project development. By considering maintenance of traffic, or MOT, impacts from the preliminary stages, the project team was able to propose a design alternative that alleviated many of the potential work zone impacts. The solution, which builds approximately 70% of the improvements "off-line" and away from traffic, significantly reduced impacts to all stakeholders, including road users, the surrounding community, businesses, and government agencies. This was made possible by considering maintenance of traffic and impacts from the conceptual stages of the project and working with all affected stakeholders.
slide 15
Work Zone Impact Assessment Process
narrator notes
There are four general steps in assessing the impacts of work zones during the project development stages. Keep in mind that your Agency may use different terminology or a different number of steps to capture the basic concepts laid out in these four steps. These steps lead to identifying strategies for the TMP. Identification and selection of strategies will be discussed in Module 5.
The following slides expand on each of the four steps of impacts assessment.
slide 16
1. Compile Project Information
- Type of data to be collected:
- Project Scope
- Roadway & Traffic Characteristics
- Other Factors
- How to gather data:
- From several previous years' projects
- Transportation planning or traffic studies conducted in area
- Field data collection as needed
Begin data-gathering process in early scoping stage.
narrator notes
Data gathering is the initial step in the impacts assessment process and should begin in the early scoping stages of the project. Historical data can be used in many cases, such as data from past construction projects or transportation planning or traffic studies. Based on what data is available, additional data collection may be required. This effort should be included in any scope when the contractor or consultant is developing the TMP.
This data is important for establishing a baseline for comparison of future conditions. For example, modeling the future construction conditions may indicate a queue of 2 miles more than non-work zone conditions. This may be unacceptable and lead to looking at alternate strategies.
slide 17
1. Compile Project Information
- Roadway Characteristics include:
- Roadway classification
- Number of lanes
- Other geometric characteristics
- Urban/suburban/rural
-
Traffic Characteristics include:
- Volumes (vehicles, bicycles, pedestrians, trucks)
- Speed (posted/recorded 85th percentile)
- Volume/Capacity
- Percent trucks
- Queue length (baseline)
- Peak traffic hours
- Intersection Control
- Signal Timing Data
- Crash Data
narrator notes
The extent of the data to be collected depends on the size, location and complexity of the project. Projects in heavily congested urban areas may need the most data gathering parameters. Projects in rural areas with limited access may have fewer parameters.
slide 18
1. Compile Project Information
- Other Factors:
- Resident and business concerns
- Maintenance of traffic (MOT) issues
- Other planned projects in close proximity
- New land use development
- Special events
narrator notes
As part of any assessment it is important to identify other factors that can affect the project and traffic management in and around the work zone.
It is crucial to gather resident and business concerns on access issues. A public involvement strategy identified during the preliminary stages of the project will assist in this process.
Identifying any maintenance of traffic issues during the early scoping stages will help to uncover any problem areas and identifying strategies to mitigate those issues.
Identifying any planned projects nearby, including utility projects, is vital to avoiding conflicts such as lane closures that affect alternate routes. Failure to identify other planned projects can lead to conflicts in roles and responsibilities, scheduling, and traffic plans.
Depending on the project location, there may be a need to identify special sources of traffic, such as new developments or major events. Significant planned developments like the opening of a hotel or major retail store can create major access issues. Similarly, special events such as a baseball or football game can have 90,000 fans exit the stadium in a short time. These situations can affect project work days and schedule.
slide 19
2. Determine MOEs and Select Analysis Approach
- What is the Agency aiming for in work zone performance?
- Avoid queues? Limit queues to 1 mile?
- Prevent increase in crashes?
- Keep additional delay under 15 minutes?
- Selected MOEs should track with Agency goals:
- Policy goals
- Significant project criteria
- Agency performance measures
- Format for providing traveler info
narrator notes
The measures of effectiveness, or MOEs, that are important to the Agency should form the basis for what measures are used in impacts assessment. For example, if the Agency's work zone policy limits queues to one mile, then the impacts assessment needs to determine if queues are likely to stay within that 1 mile criteria.
Other sources of MOE are what criteria the Agency uses to define a significant project, or how it reports traveler information. For example, if the Agency reports expected work zone delays through its traffic management center, then it would make sense to generate that estimate of delay during impacts assessment.
slide 20
2. Determine MOEs and Select Analysis Approach
- MOE selection based on:
- Project characteristics
- Data collected
- Agency goals and policies/procedures
- MOEs may include:
- Crashes
- Travel time
- Delays
- Queue lengths
- Level of service (LOS)
- Volume to capacity ratio (V/C)
- Congestion/user cost
- Other MOEs in Agency policy
narrator notes
The selection of MOEs and analysis approach generally depend on project characteristics such as the size and duration of a project and whether it is expected to cause major disruption, the available data, and Agency policy and procedures.
Some common MOEs used by Agencies are maximum queue lengths or delays as a mobility goal, and no increase in crashes as a safety goal. To determine if a delay criteria will be met, the analyst would need to assess expected work zone travel time against current or baseline travel time without the work zone. Another commonly used measure is the volume to capacity ratio because this gives the analyst a quick initial idea of whether congestion is likely to be an issue.
It is important to determine as early as possible within the planning stages, what MOEs will be evaluated and the methods and tools that will be used to assist in the assessment.
slide 21
2. Determine MOEs and Select Analysis Approach
- Impacts Assessment Approaches:
- MOT Alternative Assessment – macro level assessment that helps to select the best work zone option
- Phasing Analysis of Selected Option – micro level assessment that helps in identifying any impacts associated with each phasing of the selected work zone option
narrator notes
There are basically two impacts assessment approaches, one at a macro level and the other at a micro level. MOT alternative assessment is a macro level analysis which helps to select the best option to go forward with, while the phasing analysis is a micro level analysis which helps to identify the impacts associated with each phasing of the selected work zone option.
slide 22
2. Determine MOEs and Select Analysis Approach
- Analysis tools to be considered depend on:
- Project type:
- Reconstruction
- Paving
- Bridge work
- Level of complexity
- MOEs
- Road/network type:
- Corridor
- Roadway network
- Freeway
- Freeway surface street interchange
- Project type:
narrator notes
The type of tools to be used for an assessment should always be proportional to the type, size, and complexity of the project, as well as the type of roadway and the chosen MOEs.
For many small projects with minimal expected disruption, a qualitative assessment of impacts may be sufficient. For significant projects an Agency may use decision support tools, such as modeling programs, while for less complex projects it may have developed checklists and flowcharts to assist in the analysis and decision making process. Some Agencies use a simple spreadsheet tool that performs volume to capacity calculations to provide an initial or macro assessment of likely impacts. The results of that initial assessment may determine if an Agency performs a more detailed assessment.
Ultimately, Agency guidelines govern how extensive an assessment should be for a project.
slide 23
2. Determine MOEs and Select Analysis Approach
- Tools include:
- Highway Capacity Software
- Quick Zone
- QUEWZ
- Congestion Construction Cost (CO3)
- Construction Analysis for Pavement Rehabilitation Strategies (CA4PRS)
- Lane closure analysis/charts
- SYNCHRO
- Quadro
- DYNASMART- P
- VISSIM
- CORSIM
narrator notes
When using analysis tools, projects on major corridors may require more complex tools like CORSIM or VISSIM to accurately assess impacts. Various States have also developed their own unique work zone tools. For example, Michigan uses the Construction, Congestion, Cost tool and California uses the Construction Analysis for Pavement Rehabilitation Strategies tool.
slide 24
3. Assess Impacts of Alternatives (Macro Level)
- MOT Alternative Assessment—helps select the best work zone option:
- Comparison of MOT options for each design alternative
- Potentially reduce number of work zone options
- May involve:
- High-level, qualitative analysis
- Detailed quantitative analysis
- Document potential impacts of each option
Benefit—Selection of Best Option
narrator notes
The objective of this step is to get a first-hand understanding of the potential work zone impacts of each design alternative. The assessment can be quantitative or qualitative, based on the project. Screening of small projects or those likely to have minimal impacts could be done with templates or simplified tools or charts so that more detailed analyses can focus on projects that are likely to cause greater impacts. A comparison with lane closure charts developed by the Agency or with past similar projects can be helpful in this assessment.
The result of this screening-level assessment may be a summary-level list of the potential work zone impacts for each alternative, such as increased right-of-way costs, reduced access to neighboring businesses, high utility relocation costs.
Documentation of the impacts and key factors for each MOT alternative is important to selecting the most suitable option and avoiding duplication of effort as the project progresses.
slide 25
3. Assess Impacts of Alternatives (Macro Level) — Example
MOT Alternatives Assessment—compares different options and helps identify best option
Replacement of I-94 bridges over Riverside Drive, MI
- Options considered:
- Detour of existing I-94 traffic to other routes
- Construction of a temporary bridge
- One lane with alternating traffic on Riverside Drive during construction
- Part-width construction – selected option
narrator notes
Four alternative traffic control schemes were evaluated for replacing the I-94 bridges over Riverside Drive project: detouring traffic; constructing a temporary bridge, operating one lane with alternating traffic, or doing part-width construction of the bridge.
Detouring I-94 traffic was not feasible because detouring high volumes to existing routes would result in unacceptable delays and congestion on the surrounding road network.
Constructing a temporary bridge was cost-prohibitive because of the steep grades and existing interchanges close to the bridge.
The third option was to keep one lane open with alternating traffic on Riverside Drive during construction. This alternative would potentially increase project construction duration to two construction seasons and was not selected.
The fourth option was to do part-width construction with two 11-ft lanes with 1-ft shy distance in each direction at all times for I-94, while closing Riverside Drive and detouring that traffic. This option was considered the best considering cost, traffic volumes, and project duration.
slide 26
3. Assess Impacts of Alternatives (Macro Level) — Example
Ohio DOT MOT/PLC Policy
narrator notes
This example shows the results of a lane closure analysis on an Interstate in Ohio. The orange color indicates the times when lane closures are not permitted on that particular segment of highway.
The analysis was done using Ohio DOT's online Permitted Lane Closure system. The system was developed for each segment of Interstate highway in Ohio based on Ohio DOT's maintenance of traffic policy and its queue limits. This tool helps designers understand what the available lane closure options are for a particular segment of road so that can be factored into the design.
slide 27
4. Assess Impacts of Selected Alternatives (Micro Level)
- Phasing Assessment – Compare each proposed phasing with existing conditions
- Perform Traffic Analysis – existing and proposed construction phasing:
- Model mainline, detour routes, alternate routes
- Compare with agency thresholds
Consider other adjacent roadways affected by construction when doing the analysis.
narrator notes
A micro-level analysis is important because it provides a comparison of baseline or existing conditions with work zone traffic conditions that would be in place during construction. Negative impacts, such as unacceptable traffic delays as defined by the Agency, can be mitigated prior to construction, or at a minimum road users can be informed well in advance of the planned activity.
The next slides provide examples of this type of analysis.
slide 28
4. Assess Impacts of Selected Alternatives (Micro Level) — Example
- Comparison of future work zone traffic with existing conditions
| Locations | Existing | Phase 1 | |||||||
|---|---|---|---|---|---|---|---|---|---|
| Approach | V/C Ratio | Delay | Queue Length 95th (ft) |
LOS | V/C Ratio | Delay (sec) | Queue Length 95th (ft) |
LOS | |
| Benning Road and Oklahoma Avenue | EB | 0.31 | 3.2 | 19 | A | 0.31 | 4.3 | 31 | A |
| WB | 0.38 | 12.7 | 136 | B | 0.38 | 12.7 | 136 | B | |
| NB | 0.25 | 23.0 | 107 | C | 0.25 | 23.0 | 107 | C | |
| Intersection LOS - A | Intersection LOS - C | ||||||||
| Benning Road and Minnesota Avenue | EB | 0.28 (L-0.34) |
14.7 | 68 (L-85) |
B | (L-0.41) 0.36 (R-0.20) |
36.2 | (L-144) 249 (R-98) |
D |
| WB | 0.56 | 24.2 | 166 | C | 1.04 | 93.7 | 454* | F | |
| NB | 0.17 (L-0.26) |
11.6 | 70 (L-68) |
B | 0.17 (L-0.26) |
11.6 | 70 (L-68) |
B | |
| SB | 0.40 (R-0.08) |
21.3 | 161 (R-19) |
C | 0.38 (L-0.10) |
22.5 | 161 (L-40) |
C | |
| Intersection LOS - B | Intersection LOS - C | ||||||||
narrator notes
This example project was small in scope and the Project Engineer was able to simply retime the signals and remove the anticipated traffic delays. Delays were reduced from 93.7 seconds to 22.7 seconds, and level of service was maintained at level C rather than dropping to level F.
Understanding the traffic impacts often leads to identifying simple, relatively low cost strategies to reduce or even eliminate the impacts, sometimes with minimal effort.
slide 29
4. Assess Impacts of Selected Alternatives (Micro Level) — Example
- Solution to mitigate impacts can be as simple as modifying signal timing
narrator notes
The example project was small in scope and the Project Engineer was able to simply retime the signals and remove the anticipated traffic delays. Delays were reduced from 93.7 seconds to 22.7 seconds, and level of service was maintained at level C rather than dropping to level F.
Understanding the traffic impacts often leads to identifying simple, relatively low cost strategies to reduce or even eliminate the impacts, sometimes with minimal effort.
slide 30
4. Assess Impacts of Selected Alternatives (Micro Level) — Traffic Analysis Tool Example
- Oregon Work Zone Traffic Analysis Tool:
- Determine safe times for lane closures
- Determine mobility impacts – delay estimates
- 5–15 minutes per analysis
- Output includes:
- Lane closure charts
- Delay estimates
- Roadway profile
- Straight-line diagrams
- Horizontal curve table
- Vertical grade table
- Vertical type table
Delay Estimates by WZTA
narrator notes
Oregon DOT's Web-Based Work Zone Traffic Analysis Tool makes Oregon's highway data available via the Internet. Available traffic data include Average Daily Traffic, average truck percentage, horizontal curve and vertical grade, and more. The tool can be used to predict hours of the day when lanes or shoulders can reasonably be closed and the approximate delay that would develop during such closures.
A sample delay chart generated by the tool is shown here. The chart gives an estimate of the delay by month of year and time of day. The chart is color coded. For example, blue indicates an anticipated delay of 1-3 minutes per vehicle, and green indicates 3-5 minutes delay per vehicle.
slide 31
4. Assess Impacts of Selected Alternatives (Micro Level) — Traffic Analysis Tool Example
- Construction Analysis for Pavement Rehabilitation Strategies (CA4PRS)
- Decision-support tool for practitioners
- Helps Agencies and Contractors select more efficient and economic highway construction strategies
- Estimate construction schedule, analyze traffic delay, and compare agency cost
narrator notes
The Construction Analysis for Pavement Rehabilitation Strategies tool, referred to as CA4PRS, is an example of a schedule and traffic analysis tool that helps Agencies and Contractors determine effective, economical rehabilitation strategies. CA4PRS helps planners and designers find an optimal balance between pavement design, construction constraints, traffic operations, and budget during the planning and design of rehabilitation projects.
slide 32
4. Assess Impacts of Selected Alternatives (Micro Level) — Traffic Analysis Tool Example
- Caltrans I-15 Devore Reconstruction
- Project Characteristics:
- Pavement reconstruction in both directions
- 3.4-mile segment of I-15 with heavy commuter traffic
| Construction Alternative | Schedule Comparison | Cost Comparison ($M) | Max. Delay (Min.) | |||
|---|---|---|---|---|---|---|
| Total Closures | Closure Hours | User Delay | Agency Cost | Total Cost | ||
| Continuous (24/7) Closure | 2 | 400 | 5.0 | 15.0 | 20.0 | 80 |
| 72-Hour Weekday Closure | 8 | 512 | 5.0 | 16.0 | 21.0 | 50 |
| 55-Hour Weekend Closure | 14 | 770 | 14.0 | 17.0 | 31.0 | 80 |
| 10-Hour Night Time Closure | 220 | 2,200 | 7.0 | 21.0 | 28.0 | 30 |
narrator notes
This is an example of a CA4PRS analysis done for a pavement reconstruction project on Interstate-15 in Devore, California. Based on the analysis, which considered schedule, delay, and Agency costs, the alternative of a one roadbed continuous closure was selected as the best option. This option helped to save the Agency significant cost as well as minimize road user delays.
slide 33
4. Assess Impacts of Selected Alternatives (Micro Level) — Crash Analysis
- Analysis of existing high-crash locations may indicate potential:
- "Hot" spots
- Critical corridors
- Analysis based on:
- Number of crashes by intersections and/or project area
- Percentage of crashes by type or contributory factors
- Crashes per MVMT, level of severity and/or severity rate
narrator notes
A preliminary analysis of crash data within a project area may indicate potential "hot" spots or any area of crash concentration. The analysis can use MOEs such as the number of crashes, percent of crashes, or crashes by traffic volume or severity.
Monitoring identified hot spots or critical corridors is important to ensure work zone activities don't result in additional crashes.
slide 34
4. Assess Impacts of Selected Alternatives (Micro Level) — Crash Analysis
- Example – Michigan historic crash analysis
- Uses Transportation Management Systems (TMS) database
- Four years of crash data
| Crash Type | Crash Count | Percentage |
|---|---|---|
| Fixed Object | 124 | 22.71 |
Animal |
97 | 17.77 |
| Rear-End Straight | 74 | 13.55 |
| Miscellaneous 1 Vehicle | 73 | 13.34 |
| Side Swipe Same | 59 | 10.81 |
| Overturn | 51 | 9.34 |
| Other Object | 35 | 6.41 |
| Side Swipe Opposite | 12 | 2.20 |
| Angle Straight | 10 | 1.83 |
| Head-On | 5 | 0.92 |
| Rear-End Right Turn | 2 | 0.37 |
| Dual Left Turn | 1 | 0.18 |
| Angle Turn | 1 | 0.18 |
| Backing | 1 | 0.18 |
| Hit Parked Vehicle | 1 | 0.18 |
narrator notes
Michigan DOT's crash analysis during project development includes a historic review of crash data for the construction area using its Transportation Management Systems database. In the example shown, four years of crash data for 2001 through 2005 was analyzed. This baseline was included in the TMP and allowed project staff to effectively monitor work zone crashes during construction.
slide 35
4. Assess Impacts of Selected Alternatives (Micro Level) — Other Impacts
- Community/business accessibility
- Other nearby projects
- Public transportation
- Commercial vehicles
- Utility locations
- Special events access
- Emergency vehicle access
- Evacuation Routes
narrator notes
In addition to traffic impacts, there are a host of other impacts that can affect a project and cost resources in terms of time and money. These impacts need to be considered as the TMP is developed.
slide 36
How Should Results of Impacts Assessment Be Used?
- Identify critical issues to address in development of TMP
- Identify strategies for the TMP that will minimize impacts
- Formulate policies
narrator notes
The results of the impacts assessment guides the development of the TMP and helps in identifying strategies to mitigate negative impacts for particular projects. Impacts assessment and TMPs can also provide information to update Agency policies and procedures related to work zone safety and mobility.
slide 37
In Summary, Work Zone Impacts Assessment…
- Leads to identification and understanding of potential impacts
- Brings work zone considerations into project alternatives analysis
- Enables more effective selection of TMP strategies to manage impacts
- Provides information for a more accurate cost estimate
- Targets resources to projects with greatest need
narrator notes
To review what we learned in this module, work zone impacts assessment enables better and earlier identification and understanding of potential impacts and consideration of those impacts throughout project development – from project scoping and alternatives analysis through the selection of TMP strategies and implementation during construction.
Having a good understanding of impacts from the early stages of a project will yield a more accurate project cost estimate and enables the Agency to assign resources more effectively.
slide 38
For More Information
FHWA has several guides available:
- Work Zone Impacts Assessment: An Approach to Assess and Manage Work Zone Safety and Mobility Impacts of Road Projects
- Traffic Analysis Toolbox Volume VIII: Work Zone Modeling & Simulation: A Guide for Decision Makers
- Traffic Analysis Toolbox Volume IX: Work Zone Modeling and Simulation – A Guide for Analysts
To access these and other references, visit: http://www.ops.fhwa.dot.gov/wz/traffic_analysis/index.htm.
narrator notes
FHWA has developed several resources to assist in work zone impacts assessment. Additional information on these documents and other references can be obtained by visiting the website listed on the slide.
slide 39
Exercise
narrator notes
Now that you have completed Module 4, this exercise will provide you with an opportunity to apply what you have learned.
slide 40
Exercise Questions
Turn to page 194 in the Participant Workbook for the exercise
- What are work zone traffic control alternatives that you would consider for the project?
- What are some of the factors to be considered while choosing the alternative?
- Do you have enough data to make a decision about a traffic control alternative? If not, what other data would you need?
To access the Participant Workbook, visit: http://www.ops.fhwa.dot.gov/wz/resources/final_rule/tmp_examples/tmp_training/tmp_workbook.pdf.
narrator notes
Please turn to page 194 in Appendix C in the Participant Workbook. After reading the exercise narrative, please answer the questions on this slide.
slide 41
Exercise Discussion
Turn to page 207 in the Participant Workbook for a discussion of the answers
narrator notes
Once you have completed responding to the questions, turn to page 207 in the Participant Workbook for a discussion of the exercise answers.
previous | next