Description of Slide 50. FLow Rates: NB 101 @ Golden Gate Bridge, Labor Day Weekend, Sunday 2005 vs 2006, EB Bay Bridge Closed
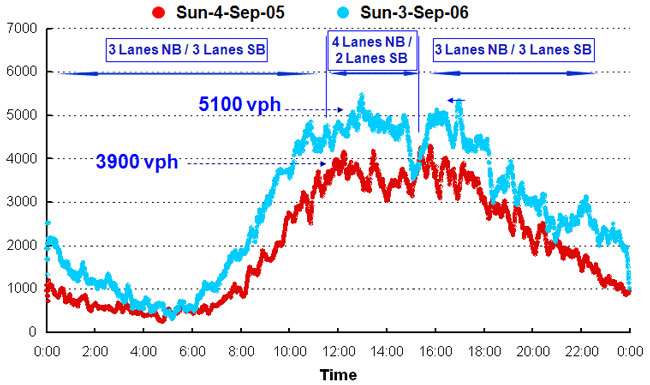
Graph showing flow rates for northbound 101 at Golden Gate Bridge for a 24-hour period on Sunday, September 4, 2005, and Saturday, September 3, 2006, with the eastbound Bay Bridge closed. In both 2005 and 2006, three lanes were northbound and three lanes were southbound from 12:01 to 11:30 A.M., four lanes were northbound and two lanes were southbound from 11:30 A.M. to 3:30 P.M., and three lanes were northbound and three lanes were southbound from 3:30 to 11:59 P.M.
The graph shows a decrease in flow from 1,000 vehicles per hour (vph) in 2005 and 2,000 vph in 2006 at 12:01 A.M. to 250 vph in 2005 and 2006 at 5 A.M., increasing to 3,900 vph in 2005 and 5,100 vph in 2006 at 1 P.M. and 5 P.M. and decreasing to 1,000 vph in 2005 and 2,000 vph in 2006 at 11:59 P.M.