Description of Slide 49. FLow Rates: NB 101 @ Golden Gate Bridge, Labor Day Weekend, Saturday 2005 vs 2006
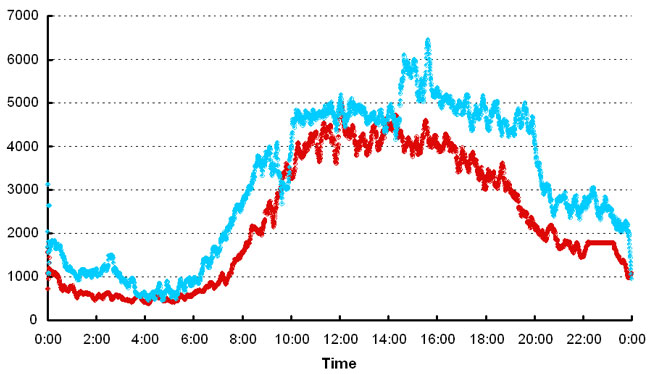
Graph showing northbound 101 flow rates at the Golden Gate Bridge for a 24-hour period on Saturday, September 3, 2005, and Saturday, September 2, 2006. The graph shows a decrease in flow from 1,000 vehicles per hour (vph) in 2005 and 2,000 vph in 2006 at 12:01 A.M. to 250 vph in 2005 and 2006 at 4 A.M., increasing to 4,500 vph in 2005 and 6,500 vph in 2006 at 4 P.M. and decreasing to 1,000 vph in 2005 and 2,000 vph in 2006 at 11:59 P.M.