Work Zone Data in Ohio (Presentation)
Printable Version [PPT 1.1 MB]
You will need the Microsoft PowerPoint Viewer to view this PowerPoint (PPT) file.
Contact Information: WorkZoneFeedback@dot.gov
Slide 1. Work Zone Data in Ohio
Dave Holstein, Administrator
Office of Traffic Engineering
Slide 2. Work Zone Data in Ohio
- Why do we worry about work zone data:
- We can use it to learn from and improve; and
- 23 CFR 630 Subpart J requires it: "Shall continually pursue improvement of wz safety and mobility by analyzing work zone crash and operational data from multiple projects…."
Slide 3. Work Zone Data in Ohio
- 3 Categories of WZ data in Ohio:
- Historic Data (primarily crash)
- Near Real-time (also crash)
- Real-time (mobility/speed)
Slide 4. Work Zone Data in Ohio
- 3 Categories of WZ data in Ohio:
- Historic Data (primarily crash)
- Near Real-time (also crash)
- Real-time (mobility/speed)
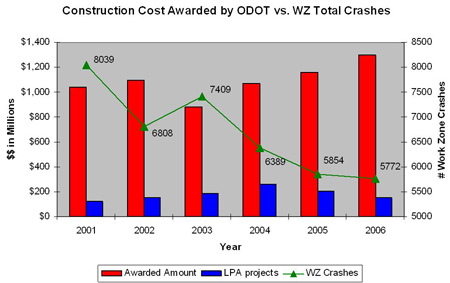
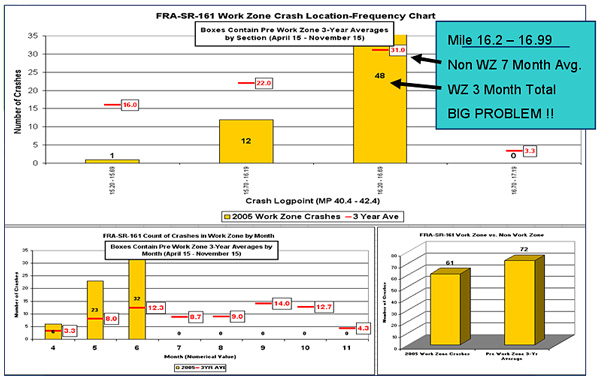
Slide 5. Work Zone Data in Ohio – Historic
- Tells how we are doing with safety…
Slide 6. Work Zone Data in Ohio – Historic
- Tells how we are doing with safety…
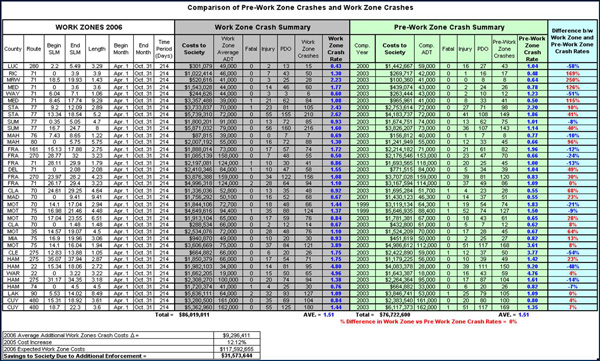
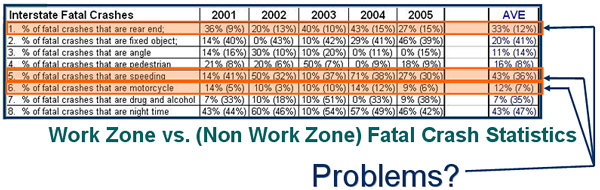
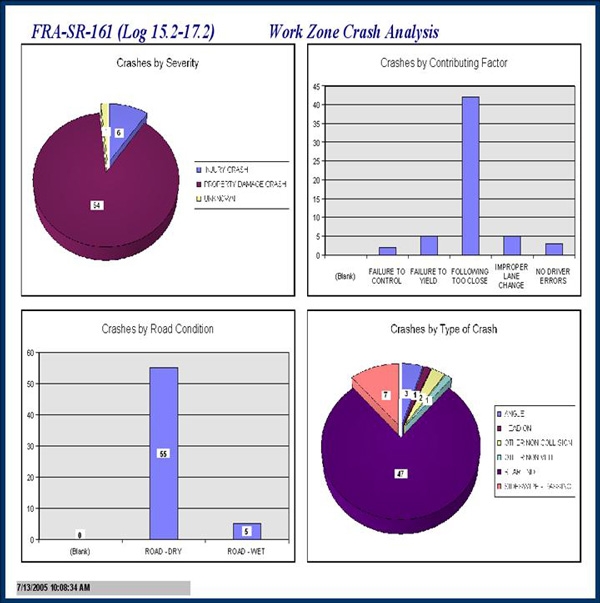
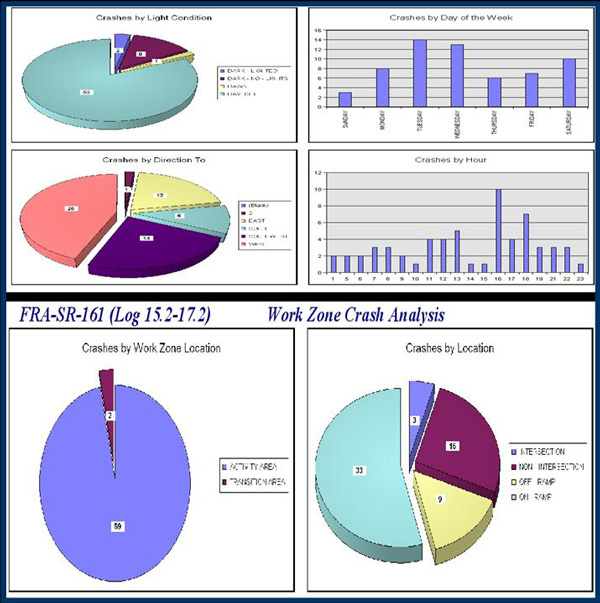
Slide 7. Work Zone Data in Ohio – Historic
2006 Example of Work Zone vs. Pre-Work Zone Crash Rates (Previous slide)
Slide 8. Work Zone Data in Ohio – Historic
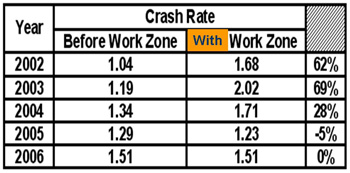
- Tells how we are doing with safety…

Slide 9. Work Zone Data in Ohio – Historic
- Tells how we are doing with safety…
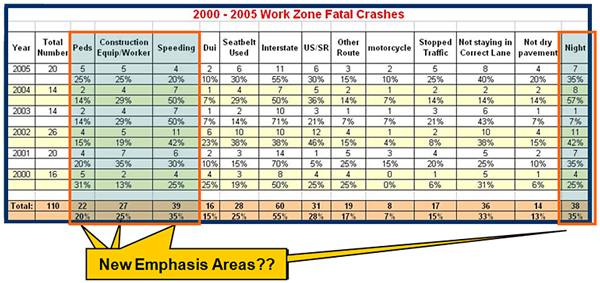
Slide 10. Work Zone Data in Ohio – Historic
- Tells how we are doing with safety…
Slide 11. Work Zone Data in Ohio
- 3 Categories of WZ data in Ohio:
- Historic Data (primarily crash)
- Near Real-time (also crash)
- Real-time (mobility/speed)
Slide 12. WZ Data in Ohio – Near Real-Time
Finds Problems in the Field in Time to Make Changes
Slide 13. WZ Data in Ohio – Near Real-Time
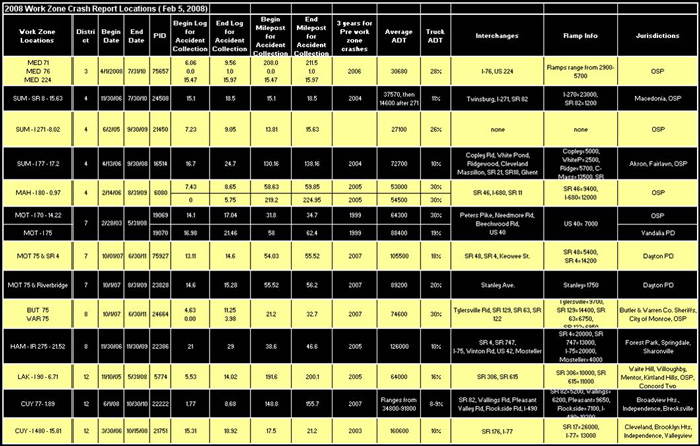
Slide 14. WZ Data in Ohio – Near Real-Time
2008 Work Zones Monitored for Crashes
Slide 15. Work Zone Data in Ohio
- 3 Categories of WZ data in Ohio:
- Historic Data (primarily crash)
- Near Real-time (also crash)
- Real-time (mobility/speed)
Slide 16. WZ Data in Ohio – Real-Time
- New effort in Ohio
- LEASING speed & travel time information
- Contract advertised and awarded (low bid) separately from the construction project
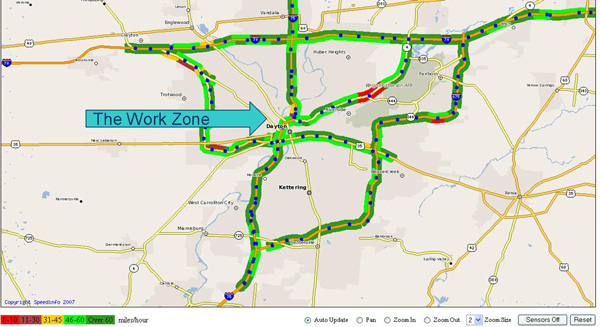
- First Deployment is in Dayton Ohio to support I-75 reconstruction project
Slide 17. WZ Data in Ohio – Real-Time
- Dayton construction project has potential to effect entire region so speed/travel time information is being gathered for alternate routes as well as the zone itself.
- Total Cost = $132,000/year (entire Dayton metro area)
- 100 Sensor Locations @ $110/month
- Just data; no equipment; no electric; no communications
Slide 18. WZ Data in Ohio – Real-Time
- Small scale example:
- 8 mile work zone
- Sensor spacing ½ mile in transition area and 1 mile in work area
- Approximately 10 sensors covers both directions (depending on median width and mounting locations – worst case 20 for both directions)
- Cost = $1,100/mo (10 sensors)
- Gives real time data via cellular broadband that can be used internally or externally via the web
Slide 19. WZ Data in Ohio – Real-Time
Slide 20. Work Zone Data in Ohio
Questions?
Thank You
Dave Holstein
State Traffic Engineer, Ohio DOT
614-644-8137
Dave.holstein@dot.state.oh.us