Work Zone Performance Measurement – Safety
slide 1: Work Zone Performance Measurement – Safety
Work Zone Performance Management Peer Exchange Workshop
May 8, 2013
Atlanta, Georgia

slide 2: Safety-Related Performance Measures
Safety impacts commonly measured as
- Crashes
- Safety Surrogates
- Worker Accidents
slide 3: Work Zone Crash Performance Measures
- # Crashes or change in # of crashes
- Per time period(s) of interest
- Change in crash rate per vehicle mile traveled
- Per time period(s) of interest
- Aggregated across projects
- Change in % distribution of crashes by severity, type, manner of collision, etc.
- Change in crash costs
slide 4: Crashes
- Existing Agency Data Sources
- Statewide traffic crash records database entries
- Crash report forms (hard-copy or electronic)
- TOC incident database entries
- Emergency response/service patrol dispatch logs
- Future Sources
- Agency-collected work zone crash information
- Connected vehicle initiative data
slide 5:
| Data Source | Key Considerations and Trade-offs |
|---|---|
| Statewide Crash Records Database |
|
| Electronic or hard copy crash report forms |
|
| TOC operator incident logs |
|
| Dispatch Logs of Emergency Response or Service Patrols |
|
| Agency-collected crash and work zone database |
|
| Connected vehicle data |
|
slide 6: Tracking Crash Frequency Trends
Case 1:
- Work zone on roadway that normally experiences 5 crashes per month
- Have had 7, 3, 10, 7 crashes in past 4 months during work zone (+40%, -40%, +100%, +40%)
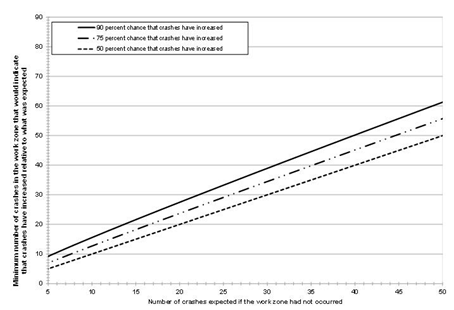
slide 7:
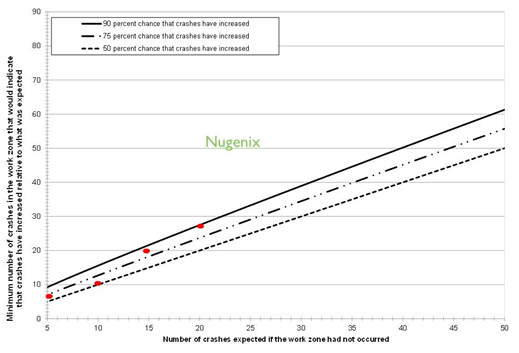
slide 8:
| Typical Number of Crashes | Actual Crashes in Work Zone | Change for Month |
|---|---|---|
| 75 | 90 | 20% |
| 75 | 100 | 33% |
| 70 | 100 | 43% |
| 60 | 80 | 33% |
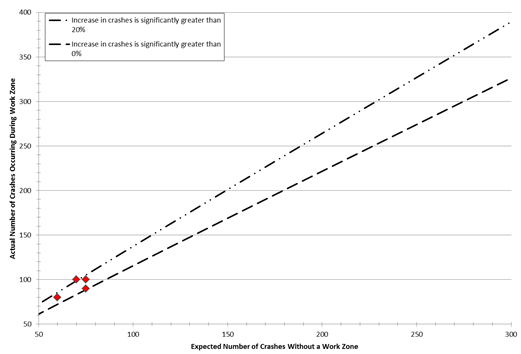
slide 9:
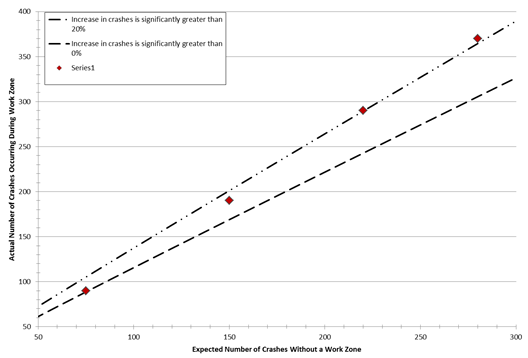
slide 10:
slide 11: Work Zone Safety Surrogate Performance Measures
- Speeds
- Compliance percentage
- Variance
- Change in emergency response dispatches
- Work zone inspection scores
- Frequency of erratic maneuvers
- High deceleration rates
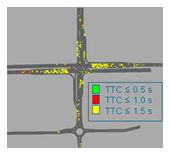
- Short times-to-collision (headways)
- Forced merges
slide 12: Safety Surrogates
|
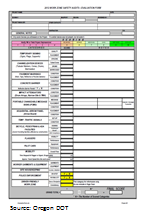 Source: Oregon DOT |
|
|
slide 13:
| Data Source | Key Considerations and Trade-offs |
|---|---|
| All data types |
|
| TOC or work zone ITS speed sensor data |
|
| Speed data collected with hand-held radar or lidar |
|
| Travel times through the work zone |
|
| Videotaped traffic behavior |
|
slide 14:
| Data Source | Key Considerations and Trade-offs |
|---|---|
| Work zone inspection scores |
|
| Traffic simulation output (analyzed with SSAM) |
|
| Connected vehicle data |
|
slide 15: Worker Accident Performance Measures
- Frequency of worker accidents
- Worker injury rates per hours of work
- Distributions of injury types, contributing factors
slide 16: Worker Accidents
- Existing Agency Data Sources
- Agency or contractor worker injury records
- State worker compensation commission accident statistics
- Bureau of Labor statistics database
- Future Sources
- Connected vehicle initiative data
slide 17:
| Data Source | Key Considerations and Trade-offs |
|---|---|
| Agency or contractor worker injury records |
|
| State worker compensation commission statistics |
|
| BLS, OSHA worker accident statistics |
|
| Agency-collected work zone crash and accident database |
|
slide 18: Discussion
- Are there other Safety-related measures you have thought about using in your agency? Why are you considering those?
- How would you use these or other safety measures to decide how to modify your agency's current policies or practices?