Work Zone Performance Measurement - Mobility
slide 1: Work Zone Performance Measurement - Mobility
Work Zone Peer Exchange
May 2013
Atlanta, GA

slide 2: Mobility-Related Performance Measures
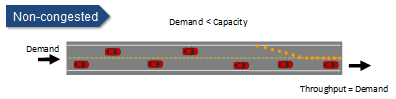
Mobility impacts commonly measured as
- Throughput
- Delays
- Travel times
- Travel time reliability
- Vehicle queues
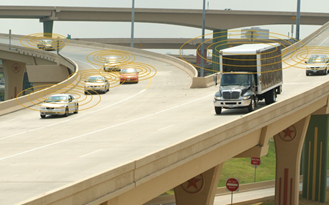
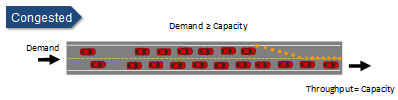
slide 3: Throughput Performance Measures
- Reduction in maximum vehicle throughput flow rate
- Overall
- During certain work tasks
- When work zone inactive
- Maximum person throughput flow rate
slide 4: Throughput
Existing Agency Data Sources
Work Zone Specific Throughput Data
Person Throughput Data
|
|
slide 5: Throughput
Potential Future Data Source
- Connected vehicle technology (sufficient market penetration of V2V and V2I technology will be needed).
slide 6: Throughput
slide 7
| Data Source | Key Considerations and Trade-offs |
|---|---|
| All data types |
|
| TOC sensor data and toll facility usage data |
|
| ATR station data |
|
| Agency AADT estimates |
|
| Work Zone ITS Data |
|
| Mechanical counters or manual counts |
|
| Manual collection of person/vehicle occupancy levels |
|
| Manual or electronic collection of pedestrian throughput |
|
| Connected Vehicle Data |
|
slide 8: Travel Time and Delay Performance Measures
- Average unit travel times (or changes in unit travel times)
- Corridor-based (when multiple work zones)
- During specific periods or work tasks
- Average delays per vehicle
- Percent of time when delays exceed threshold
- Total delay (veh-hrs)
slide 9: Travel Time and Delay Measures (cont’d)
- Time required to convey delay information to travelers
- % of projects exceeding delay thresholds
- Maximum value
- Allowable duration
- % of travelers experiencing delays
- Corridor or region-wide
- In a specific project
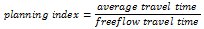
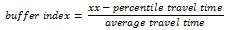
slide 10: Travel Time Reliability Performance Measures
- Change in "xx"-percentile travel times
- Project
- Corridor or route
- Change in planning time index
- Change in buffer index
slide 11: Delay, Travel Time, Travel Time Reliability
Existing Agency Data Sources
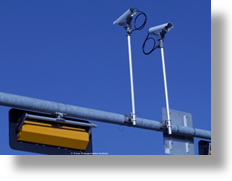
- TOC spot speed sensor data
- TOC tracking of vehicles through use of cameras
- TOC point-to-point travel time data using AVI, AVL, or license-plate recognition technology
Work Zone Specific Travel Time and Delay Data
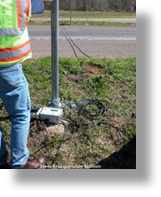
- Data extracted from a work zone ITS deployment
- Portable point-to-point travel time data collection devices
- Manual spot speed sampling using radar or lidar devices
- Travel time runs through the work zone
- Estimation of travel time delays from observed queue length data
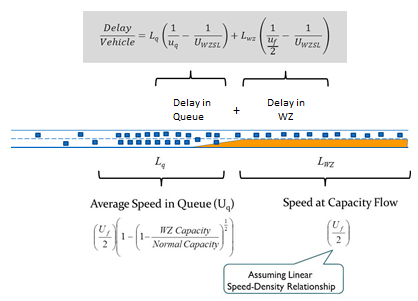
slide 12: Delay Estimation from Observed Queue
slide 13: Delay, Travel Time, Travel Time Reliability
Potential Future Data Source
- Travel Times from Bluetooth Address Matching
- Private (3rd Party) Sources of Travel Time and Speed Data
- Connected vehicle technology
slide 14
| Data Source | Key Considerations and Trade-offs |
|---|---|
| TOC spot speed data |
|
| TOC point-to-point travel time data |
|
| Work zone ITS Data |
|
| Portable point-to-point travel time data collection |
|
| Manual spot-speed data |
|
| Manual travel time data collection |
|
| 3rd party travel time and speed data |
|
| Bluetooth data |
|
| Connected Vehicle Data |
|
slide 15: Traffic Queue Performance Measures
- Average queue duration
- Overall
- During certain times or tasks
- % of time when queues occur
- Overall
- Those exceeding a threshold level
- Maximum queue length
- Project
- Combined along route or corridor
slide 16: Traffic Queue Measures (cont’d)
- Average queue length
- Overall
- During certain phases or work tasks
- % of projects with queues exceeding thresholds
- Maximum length
- Maximum duration
- % of travelers experiencing a queue
slide 17: Traffic Queue Data Sources
Existing Data Sources
- Speed data extracted from a work zone ITS deployment
- Observation of queues from a permanent or work zone TOC
- Observation of queues by field personnel at the work zone
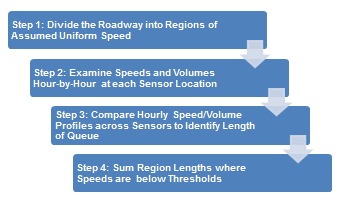
Queue Length Estimation from Spot-Speed Sensors
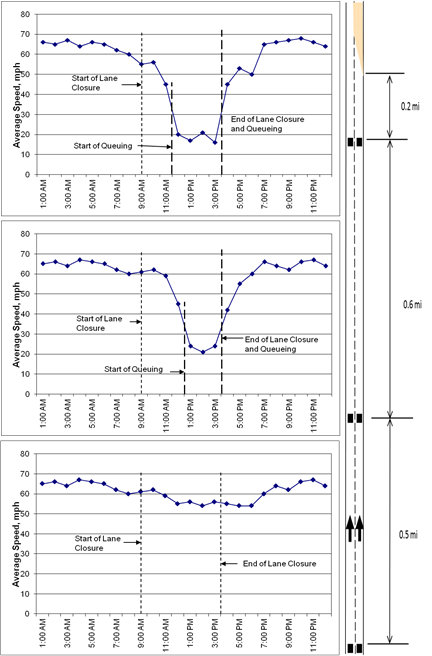
slide 18
- Spot traffic sensors are located 0.2 mile, 0.8 mile, and 1.3 miles upstream
- Project diary information indicates that a lane closure began at 9:00 AM and ended at 3:30 PM.
| Time | Estimated Location of Upstream End of Queue | Estimated Queue Length |
|---|---|---|
| 11:00 am | None | 0 |
| 12:00 pm | Between Sensors 1 & 2 | 0.2 + (0.6 / 2) = 0.5 mile |
| 1:00 pm | Between Sensors 2 & 3 | 0.2 + 0.6 + (0.5 / 2) = 1.05 mile |
| 2:00 pm | Between Sensors 2 & 3 | 1.05 mile |
| 3:00 pm | Between Sensors 2 & 3 | 1.05 mile |
| 4:00 pm | None | 0 |
slide 19: Traffic Queue Data Sources
Potential Future Data Sources
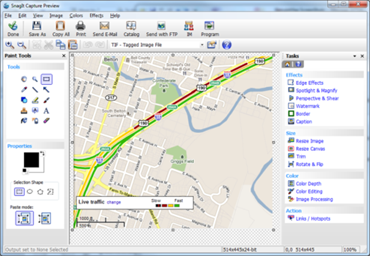
- Screen shot Captures from 3rd Party Traveler Information Providers
- Private (3rd Party) Sources of Travel Time and Speed Data
- Connected vehicle technology
slide 20
| Data Source | Key Considerations and Trade-offs |
|---|---|
| All data types |
|
| TOC or work zone ITS data using spot speed sensors |
|
| Visual queue identification by TOC operators |
|
| Collection of queue data by field personnel |
|
| Screen shot of real-time traffic condition maps |
|
| 3rd party traveler information data |
|
| Connected vehicle data |
|
slide 21: Discussion
- Are there other mobility-related measures you have thought about using in your agency? Why are you considering those?
- How would you use these or other mobility measures to decide how to modify your agency’s current policies or practices?