Corridor-Based Work Zone Performance Measures: I-35 Central Texas
slide 1: Corridor-Based Work Zone Performance Measures: I-35 Central Texas
Work Zone Performance Management Peer Exchange Workshop
May 8, 2013 • Atlanta Georgia

slide notes:
Saving Lives, Time, and Resources
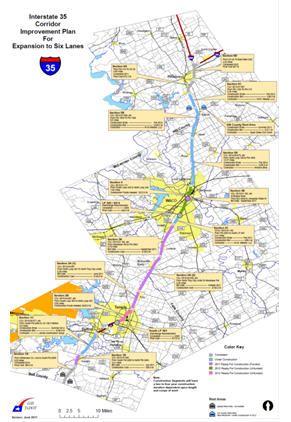
slide 2: I-35 Construction Corridor
- 15 sections
- 5 years
- 90+ miles
- Up to 11 projects active at one time
- 55k-110k ADT
- ∼66% through traffic
- >75% trucks at night
slide notes:
None.
slide 3: Vision for Traveler Information During Construction
- Provide information on current and anticipated travel conditions across multiple construction zones to assist:
- Local residents
- Regional travelers
- Long-distance travelers
- Focus of system is on the construction related impacts
slide notes:
Finally, TxDOT recognized that the possibility exists for longer-distance travelers on I-35 to encounter multiple delays due to the multiple projects active along I-35. A way to notify motorists about the combined delays of these projects on their trips was needed.
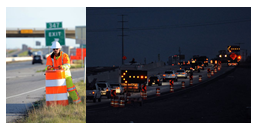
slide 4: Key Construction-Related Traffic Issues
|
 |
slide notes:
None.
slide 5: I-35 Data Sources
- Corridor lane closure database
- Traffic volumes
- Bluetooth travel time monitoring
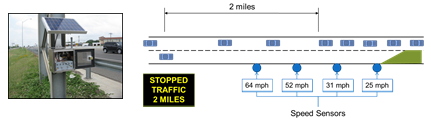
- End-of-queue warning systems
slide notes:
None.
slide 6: I-35 Corridor Measures
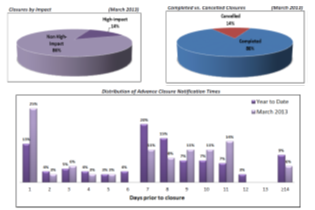
- Types of lane closures (full versus single lane)
- Advance notification times for lane closures
- Queues
- % of lane closures causing queues
- Maximum lengths
- Delays
slide notes:
None.
slide 7: Lane Closure Types and Notification
slide notes:
None.
slide 8: I-35 Closure Impacts – Queues
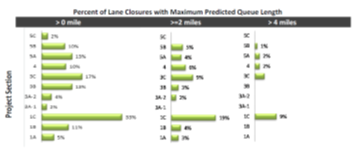
slide notes:
None.
slide 9: I-35 Closure Impacts – Delays
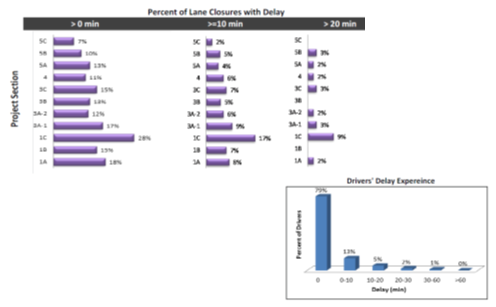
slide notes:
None.
slide 10: I-25 Corridor Impacts – Crashes
- Project and corridor-level changes
- Tracked in near real-time
- Associate back to key work activities (i.e., nighttime freeway lane closures)
slide notes:
None.
slide 11: Discussion Questions
- What other corridor-level measures would your agency be interested in?
- What risks, if any, do you anticipate with possible misuse of these types of measures(from the media, political leaders, etc.)?
slide notes:
None.
Return to List of Presentations