Work Zone Performance Management Peer Exchange

Georgia DOT
One Georgia Center
600 West Peachtree NW, Atlanta
May 8, 2013
This document is intended to accompany the presentations made at the peer exchange and provides supplemental information from the peer exchange, including questions and answers along with information from discussions that followed the presentations. The appendix includes the peer exchange agenda and contact information for participants and presenters to allow for follow-up as needed.
MEETING SUMMARY
Welcome and Opening Remarks
- Jawad Paracha welcomed attendees.
- The purpose of the peer exchange is to discuss work zone performance management and how to quantify work zone impacts.
- The objective of the meeting is to look at where industry leaders are with performance management and measurement for work zones.
- A complete list of attendees and contact information is included at the end of this report. If you have any questions or need further information, you may want to contact peers directly.
Work Zone Performance Measurement – Mobility
Jerry Ullman (TTI) presenting.
- General presentation topics:
- Performance measures
- Throughput
- Delays
- Travel times
- Travel time reliability
- Vehicle queues
- Performance measures
- You need to know why you are measuring.
- Performance measures figure out the magnitude of categories like throughput, delays, travel times, travel time reliability, and vehicle queues.
Discussion
- QUESTION: Will a diversion increase throughput or decrease travel time delay?
- This can happen. New Jersey found that traffic on a bridge under construction operated better during the project. However, a tunnel suffered because the traffic moved there.
- MassDOT is trying to convince the City of Boston that closing a road for 4 months is better than impacting traffic for 2 years. They are looking to deploy smart work zone ITS technology to advise motorists of alternate routes. It will take some time for the alternate routes to balance out; one route will be bad one day and then traffic will move to another route the next day until it evens out.
- COMMENT: NCDOT mentioned that funding can be an issue when it comes to performance measurement. Cost control is very important to State DOTs and anything that even appears to add to the project cost gets a lot of questions from upper management.
- QUESTION: How is delay measured in an urban area? For example, how do you determine what the work zone impact is if working on a road that already experiences heavy congestion?
- Jerry Ullman advised looking at the State's policy as a starting point. If traffic is naturally congested, you might measure how much more it got congested because of the work zone. If there is already a 90 minute delay, and the work zone makes it a 93 minute delay, the contractor shouldn't be penalized for all 93 minutes.
- Utah accounts for the delay already in existence.
- North Carolina's advice is to figure out the baseline and use that as a benchmark.
- Maryland's policy is incremental delay.
- The problem with establishing a baseline in the northern states is that work starts as soon as the weather breaks so there's no time to establish a base. Other States have used previous years' data.
- Eastern Virginia has had a decrease in traffic due to the economy. This changes the baseline. Their solution is to put out an ATR and perform a spot count and compare that to the data VDOT has now.
- In the Wisconsin TMP guidelines, the DOT's stated goal is no more than 15 minutes of delay on rural freeways between selected city pairs, such as Milwaukee to Madison (75 miles) and Madison to Wausau (140 miles). Within urban areas the goal is to avoid delay increases of more than 15 minutes (this is measured as additional delay attributable to the work zone, compared to typical traffic conditions during the same time of day). In one case it was necessary to relax the target to 20 minutes because there were not many alternate routes. These targets are used during planning and design (for example to establish hours when lane closures are permitted, and to determine the appropriate level of traffic mitigation). Currently, adherence to the goals is not really being tracked in the field. In one of the state's 5 regions, some contracts contain special provisions allowing the field engineer to direct the contractor to demobilize if delays exceed 15 minutes; these provisions have been somewhat controversial and it is unclear whether they will be implemented more widely.
- QUESTION: Did Utah's contractor challenge the baseline?
- In Ohio, the queue length threshold is 1.5 miles. If an analysis shows that the threshold can't be met and there are no other alternate routes available, an executive committee reviews the project and determines if funding needs to be applied for alternative solutions such as accelerated construction.
- Michigan has a 10 minute threshold. If a project exceeds that, it goes to a peer review during construction.
- In Maryland, a design-build project put the burden on the contractor to figure out how they would monitor and not exceed thresholds.
- In Georgia, they approach it from a mitigation standpoint. They don't perform any work during the day in Atlanta. It's mostly performed at night and/or weekends.
- QUESTION: New Jersey doesn't have a lot of data, which makes it hard to establish a baseline. They do have video data. Is anyone else using data analytics?
- FDOT has a policy that they can't record/retain video footage.
- Virginia has a similar policy. This is due to concerns over liability and lawyers having access to it.
- New Jersey records/retains video footage for 7 days.
- Decisions based on data are only as good as the data you collect.
- QUESTION: Are there other mobility related measures or data collection methods agencies have thought about using, and how would you use them to modify your agency's current policies or practices?
- Having people in the field collecting data. DelDOT puts staff in vehicles in the field to document how long the delay was and to take notes.
- Using archived speed data/probe data.
- VDOT used INRIX probe data to evaluate performance on a detour route when I-81 had a full closure due to blasting work.
- QUESTION: Has anyone had success with getting a contractor demobilized?
- New Jersey's experience is that it's difficult to implement contractor penalties.
Work Zone Probe Data
Tom Jacobs (MD Center for Advanced Transportation Technology) presenting.
- RITIS provides real time data feeds. It started to tie in operations centers so that data can be shared. Data is collected in real time and archived. TOCs will designate a screen in the operations center for RITIS for regional monitoring.
- Archived probe data has allowed Maryland to develop some analysis tools which will allow you to calculate real time and historic speed data.
- Decision makers like to know user-delay costs, so this was incorporated into the Work Zone Dashboard.
- Users have options to customize the dashboard and can also set up custom alerts.
Mike Fontaine (Virginia DOT) presenting.
- Virginia uses INRIX data to support a lot of applications.
- Virginia sees very good data quality and has a lot of confidence on the freeway system.
- Work zone metrics are being examined using INRIX data.
- Need to weigh "false alarms" (because of a crash) with confident/accurate data that warrants a closer look at the traffic control set-up.
- Data availability can suffer at night because there are fewer commercial vehicles, which reduces the amount of real time data availability. So overnight coverage is an issue, but if it is a congested nighttime work zone, they still get data.
- How the data is obtained can impact the performance measure.
- Using historic data does not always give you an idea of what is really going on. Full road closure when INRIX isn't notified is an example of this. Historical data may be used as baseline data and the comparison of historic to current conditions without the added knowledge of a full road closure (lack of vehicles counted) in the real-time current data will cause a flag.
- Arterial coverage is an issue with INRIX data.
- Virginia is not directly measuring queuing.
Discussion
- QUESTION: What is the cost of the data to Virginia?
- VDOT gets a cost break for being part of the I-95 Corridor Coalition.
- Maryland is the same. It is cheaper than installing detection infrastructure.
- VDOT looks at the INRIX data first, and if it looks good they use that. If it doesn't look good, they go to Bluetooth. There is not as much confidence in INRIX data on arterials, but they are very confident in the data on the freeways. VDOT wants to move towards an application like what Tom Jacobs presented on. It's more user friendly and you don't have to be a database administrator to use it.
- QUESTION: Georgia asked how the purchase of data is funded.
- In Virginia, funding comes from Operations because that is who is getting the most benefit and using the data the most.
- In Maryland, the planners get really excited about having the data and now pump lots of money into it. The increased use of data by planners in Maryland is phenomenal.
- MPOs in Virginia are heavy users of the data. Partnerships with MPOs are one way to get funding.
- QUESTION: Wisconsin asked if data can be procured for one work zone area.
- Virginia has not tried to procure data at a small level (such as a corridor level). A larger scale is required due to the significant cost of the service.
- QUESTION: What is the lag time on INRIX data?
- Virginia is not sure a lag time has been defined, but it's comparable to what you get out of a Bluetooth device based on VDOT's experience.
- Maryland sees the same.
- QUESTION: What is the performance criteria used in the RITIS bottleneck report?
- 60% of the threshold speed has to be maintained for 10 minutes.
- QUESTION: How vulnerable are the systems to hackers?
- Virginia is more concerned with hackers accessing their VMS than the data stream.
Bluetooth Application
John Shaw (Wisconsin DOT) presenting.
- Wisconsin is not currently using Bluetooth to recommend alternate routes, but there is movement in that direction.
- They are performing more retroactive analyses to compare if actual work zone delays are what was predicted in the TMP.
- Bluetooth technology originated with the electronics industry. It uses less power and is less expensive.
- Agencies can use Bluetooth technology to establish travel times. A Bluetooth signal that is activated in a car is picked up and routed to a field device with a Bluetooth receiver.
- Agencies are using Bluetooth technology to determine speed, but it can also help with identifying drivers' route choices. Having 4 or more detectors deployed can really help with analyzing route choices.
- WisDOT was concerned about the accuracy of the correct travel times being displayed on VMS signs. To ensure accuracy, they compared speed data reported by loops with data reported by Bluetooth.
- There is an interaction between demand, capacity, and diversion. It helps to quantify the point at which people decide to find another route.
- Bluetooth isn't a "point" device; it's more like a "cloud". So a Bluetooth signal might be detected a couple of times within one area. Structures and buildings can also distort the signals.
- Samples might be skewed because commercial drivers are required by USDOT to use hands-free devices with Bluetooth, whereas without Bluetooth, there is no signal to obtain. However, there is no such law in Wisconsin for passenger vehicles.
- Bluetooth just gives you speed and it's for a segment, not a specific point.
Discussion
- Many States (WI, UT, NC) have noticed that if drivers get off the freeway and use an alternate route, they won't return to the freeway. They will stay on the alternate route if that will get them where they want to go. Also, locals are more likely to use alternate routes to avoid work zones. Unfamiliar (out of town) drivers will stay on the freeway. Drivers trust commercial vehicle traffic. If you can get the trucks onto the alternate route, other drivers will follow. A lot of times, drivers will not believe the signs until they see the queue. In urban settings, Wisconsin noticed that commuters are more willing to use alternate routes.
- One concern is that drivers disregard signs and pay more attention to their GPS devices. Drivers don't care about any other information being provided; they rely on their GPS. Georgia noticed this behavior even before GPS.
- QUESTION: Can you contact GPS companies and have them update their information when a work zone is in place?
- Massachusetts tried to do this, but the GPS companies were unwilling.
Lisa Zundel (Utah DOT) presenting.
- UDOT uses Bluetooth technology to assist with managing contractor performance (establishing incentives/disincentives). Incentive might be a blanket $40K and the disincentives come out of that amount until it hits zero. Then the contractor has to start paying. If there is a positive incentive balance at the end of the project, this is what UDOT pays to the contractor.
- Incentives/disincentives are based somewhat on anticipated road user costs.
- Having 1 week of Bluetooth data before a work zone starts is critical to setting the baseline. The next step is to develop work zone scenarios.
- Utah uses models to determine acceptable thresholds for delays.
- Warning messages from UDOT allow contractors to make adjustments before the threshold delay is met. Utah only allows 6 minute delays, which is less than other States. A UDOT specification requires additional contractor personnel out in the field when an alert is received in order to figure out what is causing the delay. Did a crash occur? Is someone pulled over by law enforcement and causing a delay outside the contractor's control?
- Utah prefers to use phrases like "expect delays". Past experience is that drivers complain if the travel time says 10 minutes and it took 12 minutes.
- Documentation is critical; especially if something happens outside of the contractor's control.
- Help contractors understand that Bluetooth data can help them. It might allow them to work outside of times that UDOT might normally restrict.
- Utah does not want to prescribe work hours; just that the delay has to be under a set threshold. The contractor submits their plan to UDOT. UDOT gives the threshold to the contractor, and the contractor tells UDOT how many lanes will need to be closed. On design-build projects, contractors will have to hire a consultant to figure out the models for their bids and there is no guarantee they will get the work. So they incur out of pocket, up-front costs during the bidding process.
- UDOT noticed that prices were a little higher than typical TTC/MOT, but they were not as high as anticipated. It's hard to tell yet if prices are more inflated.
Discussion
- QUESTION: Have manufacturers identified the areas that can be covered by Bluetooth technology?
- A lot of it depends on the receiver antenna. The bigger the antenna, the more coverage, but it costs more.
- Utah has learned that a receiver can be programmed to pick up either the first or last signal detection.
- Virginia notices differences between the 3 different systems used. Antenna size and receiver placement are variables.
- Virginia sees some data bias towards the slower speeds; a slower vehicle has a higher probability of being picked up in the Bluetooth receiver's "cone of detection" than a car traveling through at 85 mph.
- QUESTION: Are Wisconsin and Utah concerned with buying the technology when it changes so fast?
- Wisconsin notices that the number of Bluetooth devices in vehicles is increasing. The sense is that the technology will be around for a while. The bigger issue might be that people "hide" their phones to avoid detection.
- Massachusetts is moving in the direction of Bluetooth.
- QUESTION: Did Utah's contractor challenge the baseline data or delay thresholds?
- Not really because it was a test of Bluetooth technology so the contractor wasn't getting penalized. The contractor partnered with UDOT because they knew the DOT wanted to use Bluetooth technology and the contractor wanted to see how it worked. The contractor did provide a lot of feedback to UDOT.
Corridor Based Performance Management (I-94)
I-94 Corridor: Larry Doyle (Michigan DOT) presenting.
- Michigan is part of the Great Lakes Region Transportation Operations Coalition.
- 30% of Michigan jobs depend on I-94.
- In 2010, there were 19 projects (with various scopes) along the I-94 corridor and the only performance measurement was 10 minutes of delay per project. This meant that because long distance drivers (e.g., trucks) could experience as much as 190 minutes delay across the corridor. Michigan DOT had to decide what an acceptable delay is on the corridor as a whole to manage overall delay.
- Michigan's cost performance measure is to limit the 2013 user delay cost on the I-94 corridor to $108M.
- Michigan's time performance measure is to maintain a maximum of 40 minutes travel time delay for the I-94 corridor.
- MDOT uses Navteq data, and has both real-time and historic data. MDOT only paid for 3 corridors but Navteq included the rest of the state freeways.
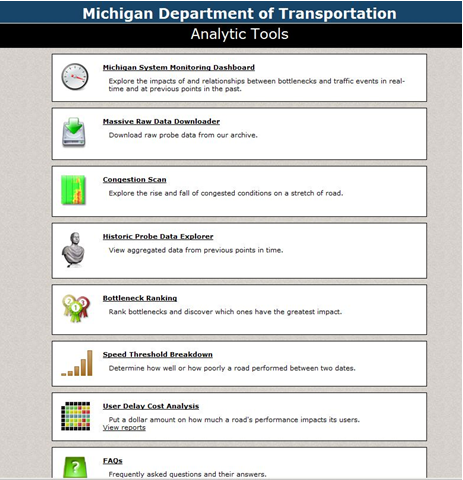
- In 2012 MDOT obtained Regional Integrated Transportation Information System (RITIS) which automatically calculates the travel time delay. RITIS offers a variety of analysis tools. MDOT inputs the traffic data from Navteq into RITIS and then is able to use the various tools in RITIS.
- When MDOT started measuring the delay in work zones, it got the designers to start thinking about it too.
- Speed has the most influence on the goal.
Example of RITIS Analysis Tools (http://www.cattlab.umd.edu/?portfolio=ritis)
I-35 Corridor: Jerry Ullman (TTI) presenting.
- Texas tracks lane closures and corresponding notifications. For example, when a contractor says work will be done on Thursday night, the public is notified about the closure for a week. If the contractor ends up doing the work on Friday instead of Thursday, Texas tracks this.
- As far as actually moving equipment, 8 of the 9 contractors on I-35 in Texas are using a traffic control subcontractor. That subcontractor has coordinated all of those contractors to use the iCone end-of-queue system, which has sensors imbedded within a traffic drum. They have a yard in the corridor where they keep several systems that have been change ordered into the projects, and deploys them as needed throughout the corridor nightly.
- One contractor does not use a traffic control subcontractor but instead does their own traffic control. They purchased a Ver-Mac end-of-queue system, which uses battery, tripod, and speed sensor assemblies. Apparently, the contractor likes them and thinks they are easy to put out and hasn't had any issues with them so far.
- Both systems are self-contained. They read their sensors, have logic to determine what message to display on one or two upstream PCMS (depending on speed readings at the various sensors) and update those messages as they detect changes at the sensors.
Discussion
- Florida said that one of their challenges is that there are multiple districts and they each do their own thing. Michigan started performance management in the southwest region and then took it to the rest of the corridor. The Central Office is now pushing it out statewide. They had to show the success first and that was realized in the southwest region.
- Michigan is getting real time data (since this is a capability of RITIS) and post-analysis.
- Texas does more of a post-analysis; using the Vermac and iCone systems.
- In Michigan, if a delay exceeds 10 minutes, a peer review meeting is conducted during the project period. The Peer Review Group includes the Region Engineer, Construction Engineer (not from the project under review), Project Engineer, and Safety Engineer. If the mitigation strategy costs over a certain amount, it has to be approved by upper management at MDOT.
- QUESTION: Was a corridor TMP generated in Michigan or Texas?
- Not in Michigan.
- QUESTION: Are there efforts to expand coordination even further beyond the Great Lakes Coalition?
- In Michigan, yes.
- Yes in Texas for the state route DFW project.
- On the east coast, Delaware coordinates with Maryland. On concern with diversion at the state line is that there's a toll on the Interstate. Diverting vehicles off the Interstate means a loss in revenue.
- There was coordination between DC, MD, and VA for the Wilson Bridge project. This included a lane closure policy and if there was major work that impact traffic, alerts would go all the way up and down the coast to alert drivers (even as far south as Georgia).
Work Zone Performance Measurement – Safety
Jerry Ullman (TTI) presenting.
- WZ performance measures
- Number of crashes
- Crash rates and distribution of crashes
- Crash types and severity
- When you don't have crash data, you can use "surrogates." For example, use speed, change in emergency response dispatches, work zone inspection scores, and frequency of erratic maneuvers.
- Possible surrogate performance measures
- Speed compliance
- WZ inspection scores
- Frequency of erratic maneuvers
- Quick decelerations
- Short headways (observed distance between vehicles)
- Forced merges
- Possible surrogate performance measures
Safety Assessment Process: DFW Corridor
Jason Crawford (TTI) presenting.
- The safety assessment process involved tracking the number and type of WZ crashes over time.
- Crash information came from:
- Project management staff
- The Contractor – the contractor maintained an action-oriented culture within the company
- Responding police and medical personnel
- Courtesy patrols
- Examples of what the data was used to correct:
- Pavement marking visibility
- Directional lighting
- Lane shift positioning
- Guide sign placement
Discussion
- The contractor was using crash data for their own insurance purposes (e.g. damaged TMA), but was reluctant to share the information with Texas.
- QUESTION: Is the data eligible for the "Protection of Data" law?
- In Delaware, the contractors are not concerned about liability and fixing documented issues. They want to get the job done and fixing issues costs time and money.
- In Dallas, the contractor would correlate crash records with damage to their equipment. The contractor was using crash data for their own insurance purposes (e.g. damaged TMA), but was reluctant to share the information with Texas.
- There are some design-build projects in Arizona with incentives based on worker injury rates.
- QUESTION: Did TTI take differences in traffic volumes (i.e., exposure) into consideration as part of the analysis process?
- To the extent possible, TTI's analysis did account for exposure and differences in volume in developing crash rates. They used AADT values, and generally estimated the current year as being close to the previous year for which they had actual AADT data.
- Michigan uses scorecards for work zone audits, which are performed weekly on projects of significance as determined by MDOT. The audits cover progress on typical performance measures such as crashes and crash causes, queue lengths, delays and corrective actions. If there is a lot of delay due to incidents, they will start focused tracking. Michigan also uses incident logs for projects.
- Delaware's crash data is fairly real time. They see crash data pretty quickly.
Work Zone Performance Measurement (Customer Satisfaction)
Daniel Smith (Missouri DOT) presenting.
- MoDOT keeps the Rate a Work Zone Survey on the front page of their website.
- If it's safe, flaggers will hand out hard copies of the survey to drivers.
- Survey cards are also at Welcome Centers.
- MoDOT also sends out mass mailings in areas where a work zone is located.
- They have about a 15% survey return rate.
- MoDOT has successfully used customer input to make changes to project staging and lane configuration with positive results. MoDOT is thinking about how customer surveys can feed into contractor incentives/disincentives.
- Customer survey data is open to the public and MoDOT will share it if asked.
Discussion
- QUESTION: What does MoDOT think about posting public information messages on CMS as opposed to static signs?
- If you are going to use a CMS, you need to have a good message that is not repeating a static sign.
- North Carolina realized that they were not spending enough time crafting the messages that need to go on the CMS boards. NCDOT provides Resident Engineers and contractors with tools so they know what messages to post on the CMS boards.
- Wisconsin has design guidance with recommended wording.
- Maryland has guidance on the use of PCMS. It cannot be out for more than 14 days. You can change the message, but it can only be there for 2 weeks. They use static signs more.
- Ohio uses CMS more in urban areas (because they stand out more) but uses static signs more in rural areas.
- During National Work Zone Awareness Week, Missouri randomly awarded gas cards to people who submitted a customer survey.
Virginia Project Dash Board
Paul Kelley (Virginia DOT) presenting.
VDOT Dashboard
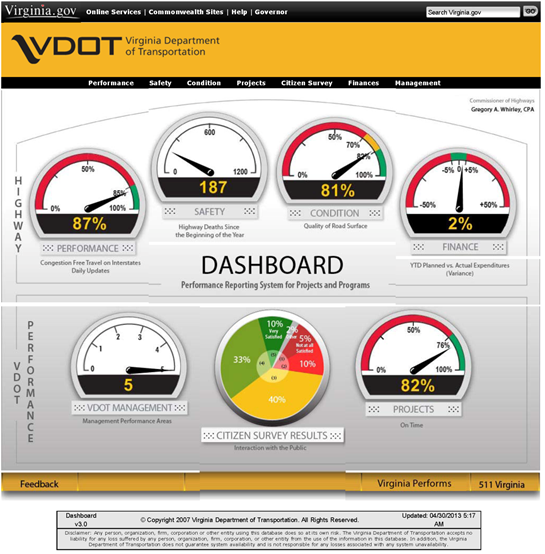
- The VDOT Dashboard tracks the performance management status of the seven indicators in the graphic above: performance (congestion free travel), safety (fatalities), condition (road surface quality), finance (planned vs actual expenditures), VDOT management, citizen survey results, projects (on-time). Protocols are in place to address concerns if performance strays from expected status.
- The Dashboard was born as a result of a poor public image from 10 years ago. Projects weren't being delivered on time or within budget.
- Transportation management personnel use the data from the Mobility Performance Measure.
- Public relations campaigns are important. Need to get the information out to the drivers.
Ohio Work Zone Mobility Charts
Reynaldo Stargell (Ohio DOT) presenting.
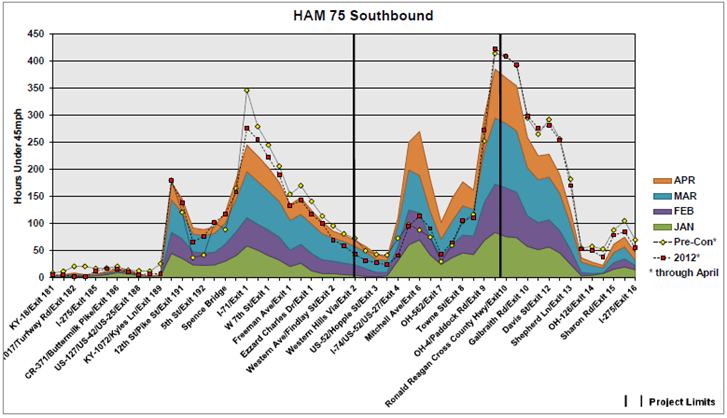
Example of ODOT Mobility Chart
- Ohio tracks crashes in ½ mile segments between April 1 – October 31 (because they don't want snow related crashes included).
- Ohio wants all crash reports electronically by 2015.
- Ohio uses the crash information to make decisions, such as adding changeable message signs or putting additional traffic incident management procedures in place.
- ODOT has been using crash tracking and is now attempting to get into mobility tracking.
- ODOT queries the mobility data in 15 minute increments and uses it to create mobility charts like the one above. The total height of the graph gives a cumulative number of hours of delay for the entire measuring period (e.g., January through the end of April). For the current year, each season has a corresponding layer within the "volcano". For prior years, the single line is a measure of everything that had happened within the same period for the respective years (January-April of 2012 and January-April of 2011 in this case). Reporting is cumulative, but they can show data for just one month if needed.
- The data is queried in 15-minute increments, then compiled into a spreadsheet. The number of hours that the speed limit is less than the threshold (e.g.., 25 mph or 45 mph) is counted then divided by four to get the total number of hours.
- Each time there is a snow event, weather sensors will pick up when precipitation begins and ends. A query is set up to pull speed data to know how many hours it took to recover to normal speeds.
- Michigan does something similar and can share the spreadsheet they use. Ohio can share their process as well. Maryland wants to develop something similar for snow and ice recovery.
What FHWA Can Do to Help?
- Have more peer exchanges. States want these to continue, especially since it's difficult for State DOT personnel to travel.
- A best practices document would be helpful.
- Access to the new Guidance document for performance measures (expected to be available in Summer 2013).
Agenda
| TIME | TOPIC | SPEAKER | AFFILIATION |
|---|---|---|---|
| 8:00-8:30 | Introduction | Jawad Paracha | FHWA |
| 8:30-9:15 | WZ Performance Measurement (mobility) | Jerry Ullman | TTI |
| 9:15-9:30 | Discussion | ||
| 9:30-9:45 | NETWORKING BREAK | ||
| 9:45-10:05 | WZ Probe Data – MD SHA | Tom Jacobs | UM CATT |
| 10:05-10:25 | WZ Probe Data - VDOT | Mike Fontaine | VTRC |
| 10:25-10:45 | Discussion | ||
| 10:45-11:05 | Bluetooth application - WI | John Shaw | WI DOT |
| 11:05-11:25 | Bluetooth application - UT | Lisa Zundel | UT DOT |
| 11:25-11:40 | Discussion | ||
| 11:40-12:30 | NETWORKING LUNCH | ||
| 12:30-12:50 | Corridor based PM: I-94 | Larry Doyle | MI DOT |
| 12:50-1:10 | Corridor based PM: I-35 | Jerry Ullman | TTI |
| 1:10-1:25 | Discussion | ||
| 1:25–1:45 | Connected Vehicle Technologies | Imran Hayee | Univ. of MN |
| 1:45-2:00 | NETWORKING BREAK | ||
| 2:00-2:30 | WZ Performance Measurement (safety) | Jerry Ullman | TTI |
| 2:30-2:50 | Safety Assessment Process: DFW Connector | Jason Crawford | TTI |
| 2:50-3:05 | Discussion | ||
| 3:05-3:25 | WZ Performance Measurement (customer satisfaction) | Daniel Smith | MoDOT |
| 3:25-3:45 | Misc. Items (VDOT Project Dash Board; Ohio WZ Mobility Charts) | Paul Kelley, Reynaldo Stargell | VDOT/ODOT |
| 3:45-4:00 | Closing |
List of Participants
| Agency/Organization | Name | |
|---|---|---|
| Delaware DOT | Adam Weiser | Adam.Weiser@state.de.us |
| FHWA Headquarters | Jawad Paracha | jawad.paracha@dot.gov |
| Florida DOT | Ezzeldin Benghuzzi | ezzeldin.benghuzzi@dot.state.fl.us |
| Georgia DOT | James Harry | |
| Illinois DOT | Paul Lorton | Paul.Lorton@Illinois.gov |
| Maryland SHA | Kay Adenaiya | KAdenaiya@sha.state.md.us |
| Massachusetts DOT | Neil Boudreau | neil.boudreau@state.ma.us |
| Michigan DOT | Larry Doyle | DoyleL@michigan.gov |
| Missouri DOT | Daniel Smith | Daniel.Smith@modot.mo.gov |
| New Jersey DOT | Wasif Mirza | Wasif.Mirza@dot.state.nj.us |
| North Carolina DOT | Steve Kite | skite@ncdot.gov |
| Ohio DOT | Reynaldo Stargell | Reynaldo.Stargell@dot.state.oh.us |
| Pennsylvania DOT | Matthew Briggs | mabriggs@pa.gov |
| RK&K | Scott Crumley | scrumley@rkk.com |
| SAIC | Larry Christianson | larry.p.christianson@saic.com |
| SAIC | Heather Rigdon | heather.m.rigdon@saic.com |
| TTI | Jason Crawford | j-crawford@tti.tamu.edu |
| TTI | Jerry Ullman | g-Ullman@tamu.edu |
| University of Maryland | Tom Jacobs | tjacobs@umd.edu |
| University of Minnesota Duluth | Imran Hayee | ihayee@d.umn.edu |
| Utah DOT | Lisa Zundel | lzundel@utah.gov |
| VHB | Michael Sutton | msutton@vhb.com |
| Virginia Center for Transportation Innovation and Research | Michael Fontaine | Michael.Fontaine@VDOT.Virginia.gov |
| Virginia DOT | Paul Kelley | Paul.Kelley@VDOT.Virginia.gov |
| Wisconsin DOT | John Shaw | John.Shaw@dot.wi.gov |