WZ Probe Data – MD SHA
slide 1: WZ Probe Data – MD SHA
Work Zone Performance Management Peer Exchange Workshow
University of Maryland, A. James Clark School of Engineering
May 8, 2013
slide 2: Presentation Agenda
- Background on RITIS/VPP Data and Tools
- MD WZ Probe Data Project
- Work Zone Performance Mangement Application Demo
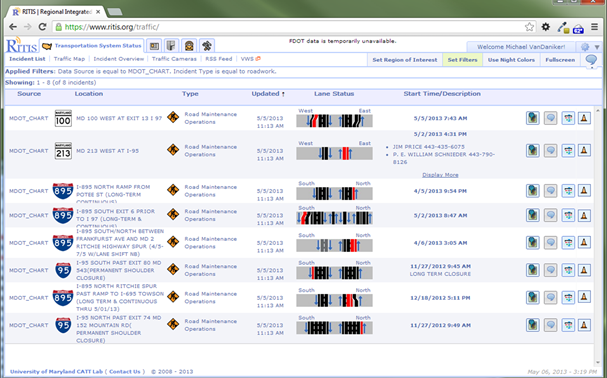
slide 3: Background
- Regional Integrated Transportation Information System (RITIS)
- Real-time data feeds
- Real-time situational awareness tools
- Archived data analysis tools
slide 4:
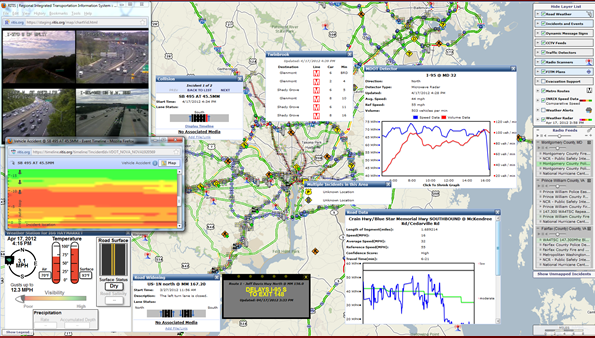
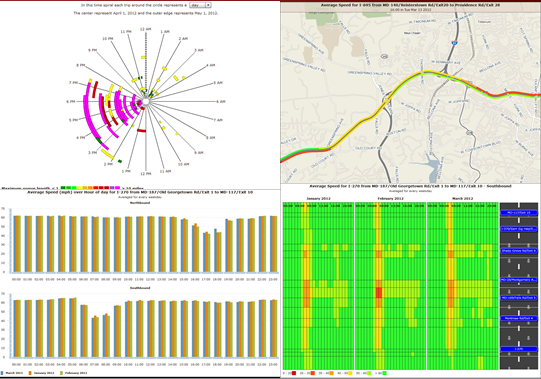
slide 5: Background
- Vehicle Probe Project (VPP) Tool Suite
- Real-time & Historic Speed Data
- Travel Time Index
- Travel time Reliability metrics
- Queue Measurements
- Statewide bottleneck ranking
- Corridor Congestion Charts
- VPP Growth in Use
NJ, PA, DE, MD, VA, NC, FL, GA, SC, CT, RI, MA, NH, ME (8,000 freeway miles, 30,000 arterial miles)
slide 6:
slide 7: MD WZ PM Project
- Phase 1-Foundational Research
- Determine Adequcy of 3rd Part Probe Data for Real-time and Historical Work Zone Performance
- Develop agreed upon Work Zone Performance Measures
- DevelopPROTOTYPE user interface "dashboard"
- Conduct meeting with potential users
- Validate WZ PM output (based on 3rd party probe data) Using Bluetooth devices in 1 work zone
- Phase 2- WZ PM Application Development
- Develop functional WZ PM software application
slide 8: MD WZ PM Project
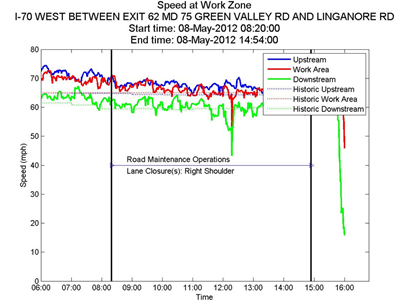
A→B: Upstream, B→C: Work Area, C→D: Downstream
PM's: Average Delay, Maxiumum Delay, Queue Duration, Average Queue Length, Max Queue Length, Percent Time Queue Length Exceeds 1 Mile
slide 9: MD WZ PM Project
slide 10: Demonstration
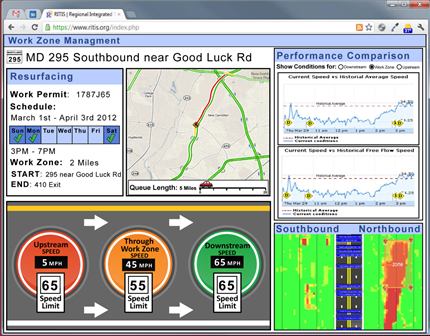
slide 11: Demonstration
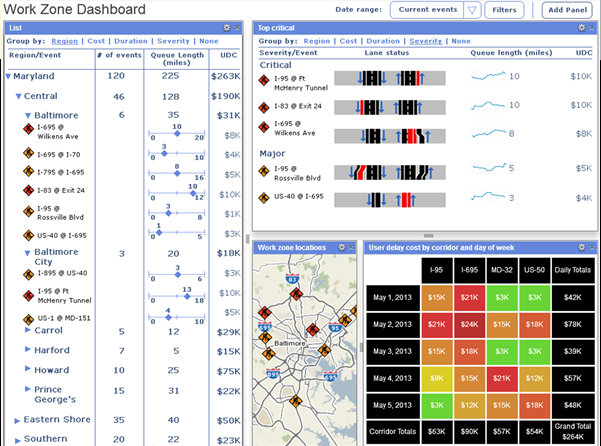
slide 12:
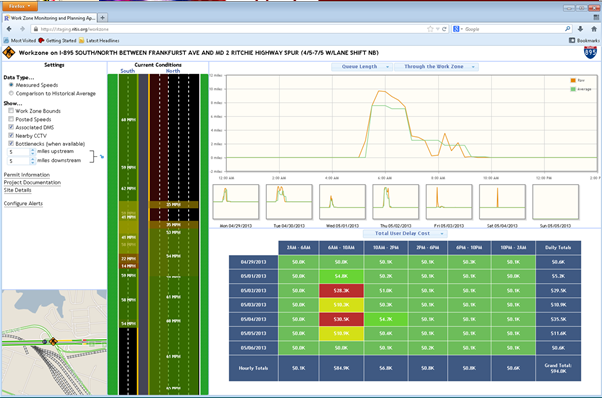
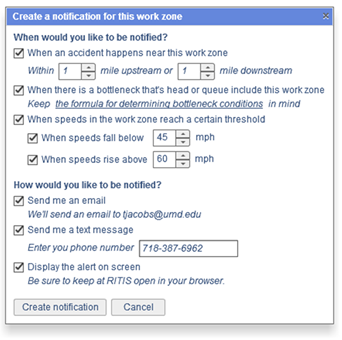
slide 13: Custom Alerts
slide 14: