Development of Traffic Information Systems Using DSRC Technology for the Work-Zone Environment
slide 1: Development of Traffic Information Systems Using DSRC Technology for the Work-Zone Environment
Imran Hayee
Department of Electrical and Computer Engineering University of Minnesota Duluth
May 8, 2013
slide notes:
None.
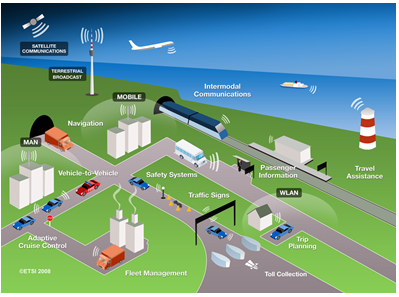
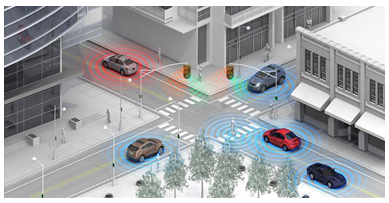
slide 2: Idea of Connected Vehicles
Mission: Intelligent Transportation Systems (ITS)
Objectives: Safety, Mobility and Efficiency
slide notes:
None.
slide 3: Outline
- Introduction
- DSRC Technology Overview
- Applications
- Work Zone Environment
- V2I Traffic Information System
- System Architecture and Design
- Field Demonstration
- V2V Assisted V2I System
- System Architecture and Design
- V2V Protocol
- Field Demonstration
- VMS Integration
- Need
- Demonstration
- V2V System – Ongoing Work
- Summary / Questions
slide notes:
None.
slide 4: DSRC Technology Overview
A short to medium range wireless communications protocol specifically designed for automotive use to promote traffic safety, efficiency and mobility. It incorporates both Vehicle to Infrastructure (V2I) and Vehicle to Vehicle (V2V) communication.
Technical Specifications:
- 5.9 GHz
- Range up to 1000 meters
- Data rate 6 to 27 mbps
- 7 licensed channels
- Vehicle speed up to 100MPH
slide notes:
IEEE 802.11p will be used as the groundwork for Dedicated Short Range Communications (DSRC) Refers to both the technology and protocols The spectrum was allocated for safety purposes, but it allowed unused bandwidth to be available for other applications, such as mobility or convenienceslide 5: DSRC Potential Applications
- Traffic Information Systems
- Emergency Vehicle Signal Preemption
- Approaching emergency vehicle warning
- Weather and road conditions warning
- Curve speed warning
- Do not pass warnings
- Cooperative Adaptive Cruise Control
- Cooperative Forward Collision Warning
- Left Turn Assist
- Merge Assist
slide notes:
- Transit or emergency vehicle signal priority
- Electronic parking payments
- Commercial vehicle clearance and safety inspections
- In-vehicle signing
- Rollover warning
- Probe data collection
- Highway-rail intersection warning
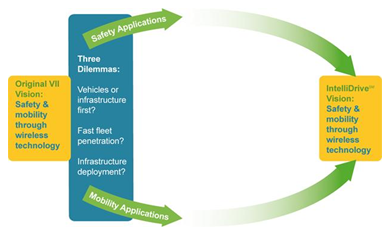
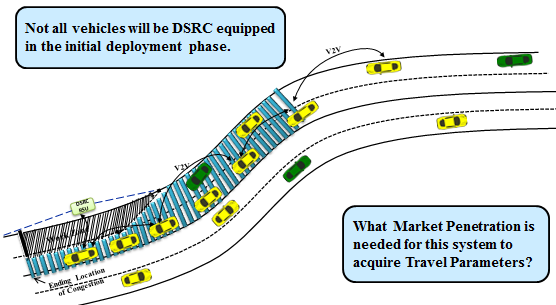
slide 6: Obstacles to Adoption of DSRC Technology
- The Chicken and Egg Dilemma
- Market Penetration
- Infrastructure Support
slide notes:
Answering the dilemma of which comes first – vehicles or infrastructure – could hinge on a NTHSA regulatory decision in 2013 about whether to require technology on new vehicles.
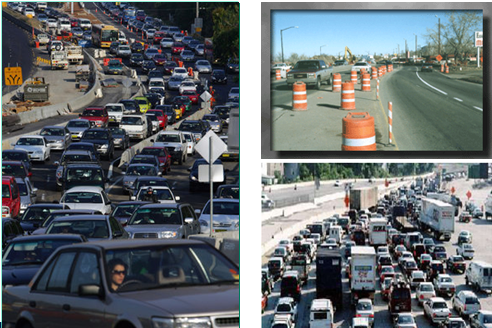
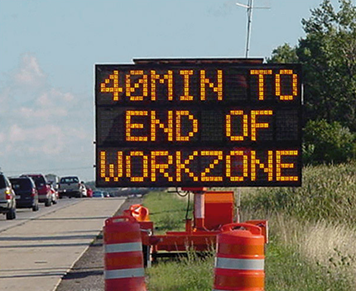
slide 7: Work Zone Environment
slide notes:
None.
slide 8: Total Work Zone Related Fatalities
| Year | Work Zone Related Fatalities |
|---|---|
| 2011 | 587 |
| 2010 | 576 |
| 2009 | 680 |
| 2008 | 720 |
| 2007 | 831 |
| 2006 | 1,004 |
| Source: Fatality Analysis Reporting System (FARS) – Final, NHTSA | |
slide notes:
None.
slide 9: Current Approach to Reduce Fatalities
- Estimate travel time and communicate to the drivers
slide notes:
None.
slide 10: Outline
- Introduction
- DSRC Technology Overview
- Applications
- Work Zone Environment
- V2I Traffic Information System
- System Architecture and Design
- Field Demonstration
- V2V Assisted V2I System
- System Architecture and Design
- V2V Protocol
- Field Demonstration
- VMS Integration
- Need
- Demonstration
- V2V System – Ongoing Work
- Summary / Questions
slide notes:
None.
slide 11: Student In Action
slide notes:
None.
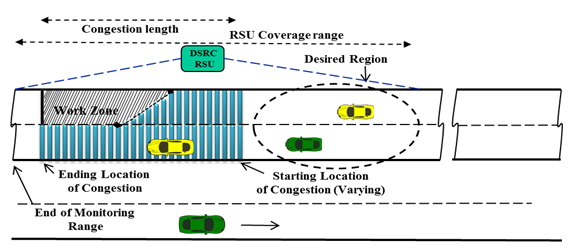
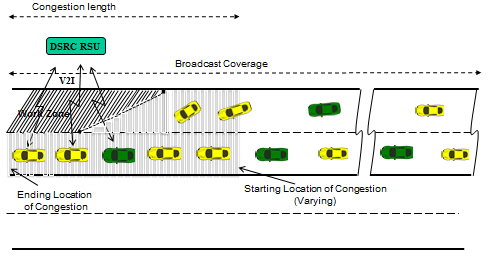
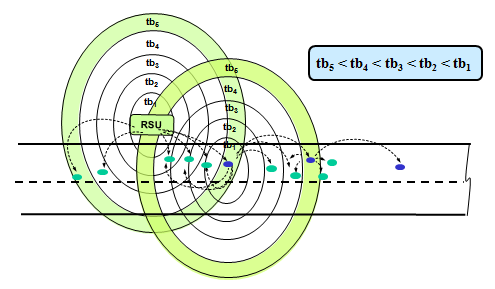
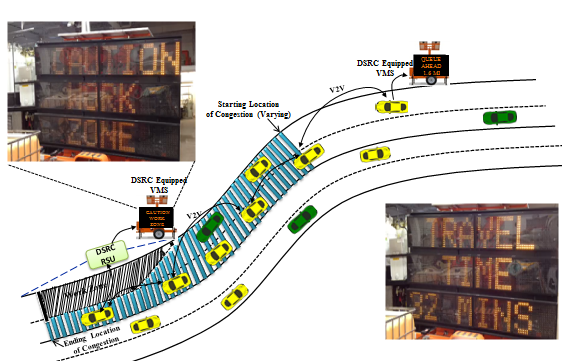
slide 12: V2I System Architecture
- RSU is placed such that RSU monitoring range aligns with the end of the congestion.
- At periodic intervals, an OBU participation is requested by the RSU to monitor a vehicle's speed and position through a congestion area.
- RSU sends traffic alert message to all OBUs indicating travel time through monitoring area.
slide notes:
None.
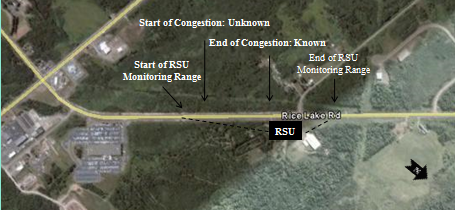
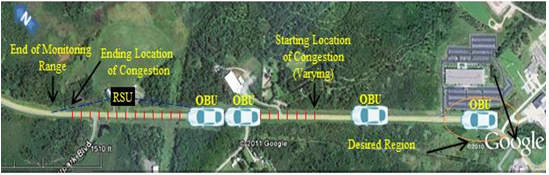
slide 13: Field Demonstration
- The field demonstration site was chosen at Rice Lake Rd, Duluth MN with the focus on providing a clear line of sight between RSU and the OBU.
- The RSU is placed near the congestion end due to reduced range on one side due to signal blocking by back of the vehicle.
slide notes:
None.
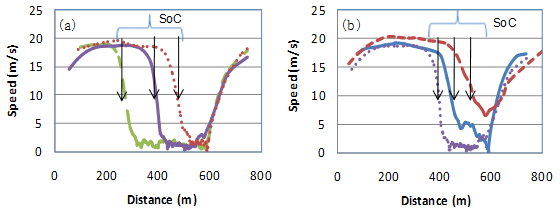
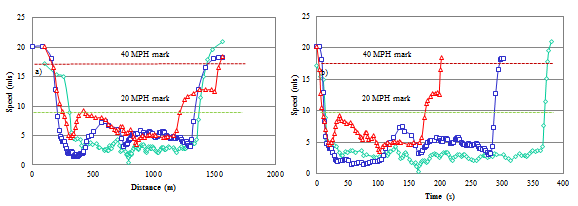
slide 14: Results – Traffic Safety Parameters
The traffic parameters – Start of Congestion location and the Travel Time are determined by RSU and communicated to all the OBUs in range
slide notes:
None.
slide 15: Varying the Length and Depth of Congestion
Congestion scenarios of varying start of congestion location and congestion depth were tested for different vehicle speeds
slide notes:
None.
slide 16: Outline
- Introduction
- DSRC Technology Overview
- Applications
- Work Zone Environment
- V2I Traffic Information System
- System Architecture and Design
- Field Demonstration
- V2V Assisted V2I System
- System Architecture and Design
- V2V Protocol
- Field Demonstration
- VMS Integration
- Need
- Demonstration
- V2V System – Ongoing Work
- Summary / Questions
slide notes:
None.
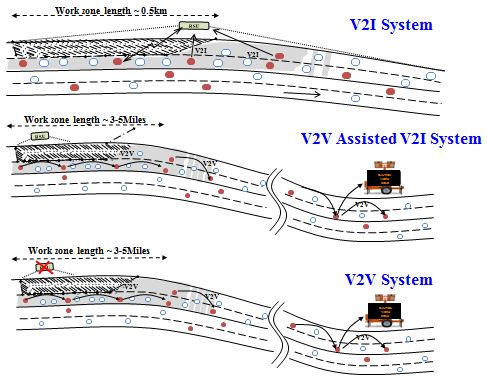
slide 17: V2V-Assisted V2I System
slide notes:
None.
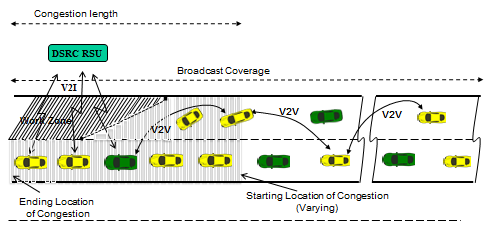
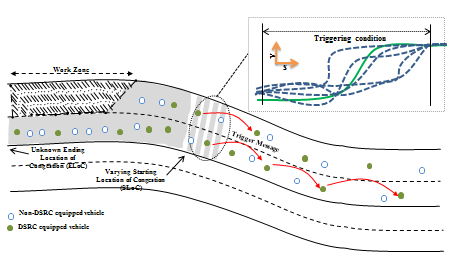
slide 18: V2V Message Relaying
- Increased message broadcast range using V2V-assisted DSRC communication.
- Much longer congestion coverage beyond the access range of one portable roadside DSRC unit.
slide notes:
None.
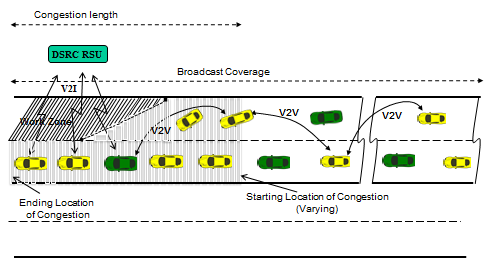
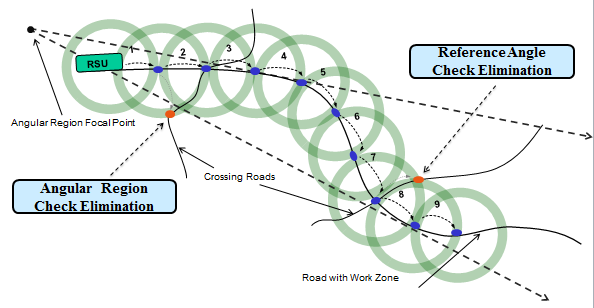
slide 19: V2V Message Relaying
- Selective Relay
- Directive Relay
slide notes:
None.
slide 20: Selective Relay
- Only one of the vehicles should relay the message forward.
- Selection should be such that the number of hops can be minimized.
slide notes:
None.
slide 21: Directive Relay
- Message should be relayed towards the direction of the road from which the vehicles are approaching towards the congestion.
slide notes:
None.
slide 22: Field Demonstration Setup – V2V
- The field demonstration site was chosen at Rice Lake Rd, Duluth MN with the focus on providing a clear line of sight between RSU and the OBU.
- The RSU is placed nearer to the congestion end due to reduced range on one side from the signal being blocked.
slide notes:
None.
slide 23: Results
- Increased congestion coverage range
- Increased message broadcast range
slide notes:
None.
slide 24: Outline
- Introduction
- DSRC Technology Overview
- Applications
- Work Zone Environment
- V2I Traffic Information System
- System Architecture and Design
- Field Demonstration
- V2V Assisted V2I System
- System Architecture and Design
- V2V Protocol
- Field Demonstration
- VMS Integration
- Need
- Demonstration
- V2V System – Ongoing Work
- Summary / Questions
slide notes:
None.
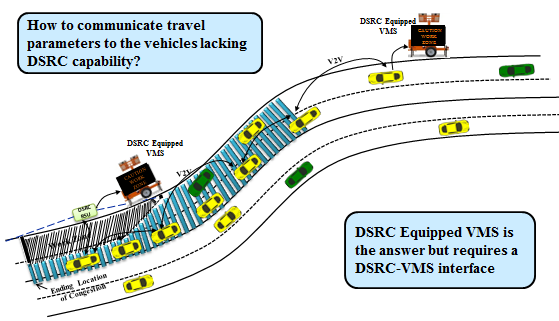
slide 25: Need for Variable Message Sign (VMS) Integration with the Developed System
slide notes:
None.
slide 26: DSRC Market Penetration Rate Requirement Analysis
- Analysis suggests that successful functionality:
- Requires a minimum DSRC penetration rate of 35% during non-rush hour traffic situation.
- Requires a minimum DSRC penetration rate of 20% during rush-hour traffic situation.
slide notes:
None.
slide 27: Acquisition vs. Dissemination
slide notes:
None.
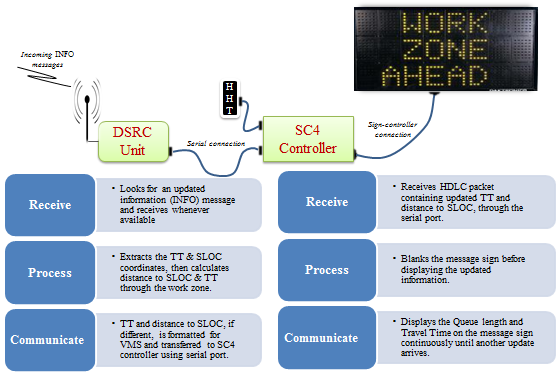
slide 28: DSRC – VMS Interface Design
slide notes:
None.
slide 29: DSRC – VMS Interface Demonstration
slide notes:
None.
slide 30: Outline
- Introduction
- DSRC Technology Overview
- Applications
- Work Zone Environment
- V2I Traffic Information System
- System Architecture and Design
- Field Demonstration
- V2V Assisted V2I System
- System Architecture and Design
- V2V Protocol
- Field Demonstration
- VMS Integration
- Need
- Demonstration
- V2V System – Ongoing Work
- Summary / Questions
slide notes:
None.
slide 31: Current Work
slide notes:
None.
slide 32: Proposed System Architecture with Only V2V Communication
slide notes:
None.
slide 33: Outline
- Introduction
- DSRC Technology Overview
- Applications
- Work Zone Environment
- V2I Traffic Information System
- System Architecture and Design
- Field Demonstration
- V2V Assisted V2I System
- System Architecture and Design
- V2V Protocol
- Field Demonstration
- VMS Integration
- Need
- Demonstration
- V2V System – Ongoing Work
- Summary / Questions
slide notes:
None.
Return to List of Presentations