Work Zone Mobility and Safety Program

Safety Assessment Process: DFW Connector

slide 1: Work Zone Performance Management Peer Exchange Workshop

Texas A&M Transportation Institute

May 8, 2013
Atlanta, GA

slide notes:

Saving Lives, Time, and Resources


slide 2: Presentation Outline


  • Project Description
  • Methods
  • Findings

slide notes:

None.


slide 3: Orientation


Map of the Dallas-Fort Worth area with the locality of Grapevine, located near the Dallas-Fort Worth airport, circled in red.

slide notes:

None.


slide 4: Project Description

  • 8.4 miles
  • Developer: NorthGate Constructors
  • $1.02 billion design-build project
  • Construction Start: Feb 17, 2010
  • Estimated Completion: Summer 2013

Blowup map of the study area showing where the new connector will run along the north side of the Dallas-Fort Worth International Airport.

slide notes:

None.


slide 5: Fast Moving, Design-Build Project


"It is a changing landscape. You can drive through there one day and it can change the next," NorthGate spokeswoman Selma Stockstill.

A blueprint of the area affected uses color coding to indicate which segments will be under construction each year from 2010 through 2013. The plan is divided into a western segment and an eastern segment.

slide notes:

None.


slide 6:


Aerial photo of construction on one segment of the project. A timeline along the bottom indicates work began on this segment in June 2010 and ended April 2011.

slide notes:

None.


slide 7:


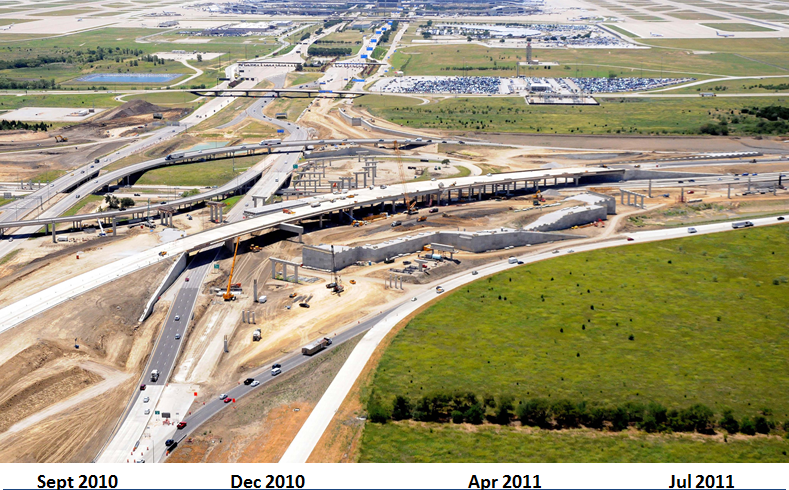
Aerial photo of construction on one segment of the project. A timeline along the bottom indicates work began on this segment in September 2010 and ended July 2011.

slide notes:

None.


slide 8: DFW Connector


  • Allowable Mainlane Lane Closures
    • Weekdays 8 PM to 6 AM
    • Weekends
  • Incident Reporting
    • Project TMC
    • Courtesy Patrol
    • Emergency Response
    • Action-oriented Culture

slide notes:

None.


slide 9: Contractor Tracking – Jan 2010
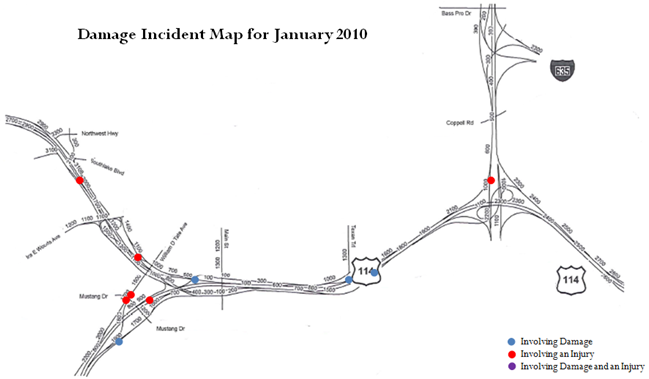

Damage incident map for January 2010 identifis locations in the project area where there were damages, injuries, and both damages and injuries.

slide notes:

None.


slide 10: Contractor Tracking – Jul 2010
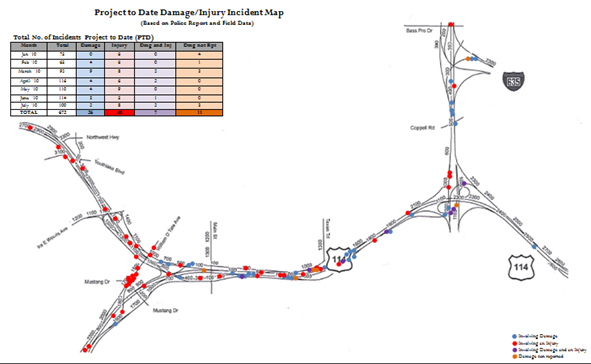

Damage incident map for the entire 2010 period identifies locations in the project area where there were damages, injuries, or both damages and injuries. A table shows a total of 26 instances of damage, 48 injuries, 7 instances of damage and injury, and 11 of damage that was not reported.

slide notes:

None.


slide 11: Methods


  • Data
    • Historical Crash Records
    • In-Construction Crash Records
    • TxDOT Traffic Data
  • Analysis
    • Modified Ohio Procedures
    • Injury and Property Damage Only (PDO)
    • Expected vs. Observed Crashes
    • Statistical Significance
  • Field Reviews

slide notes:

None.


slide 12: Creation of Small Zones
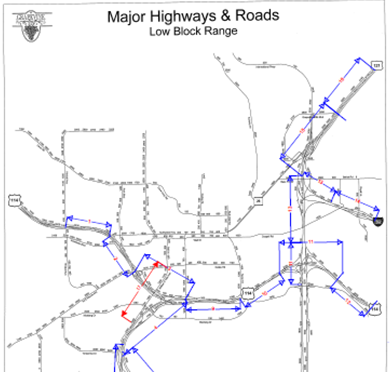

Map depicting major highways and roads low block range.

slide notes:

None.


slide 13: Monthly PDO Crash Trends
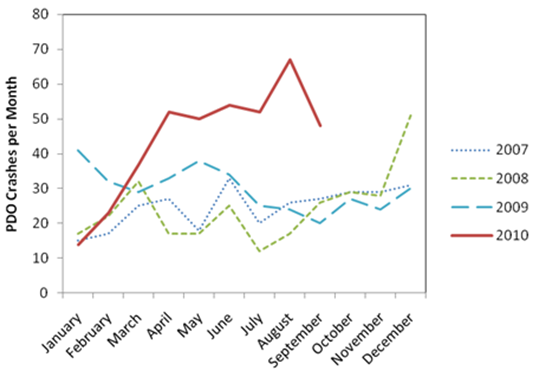

Chart shows property damage only crashes in the project area by month and year for the period 2007-2010.

slide notes:

None.


slide 14: Monthly Injury Crash Trends
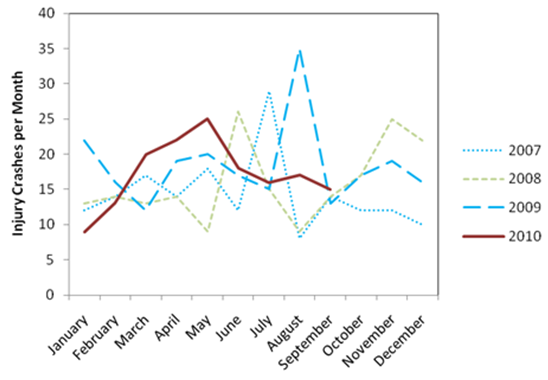

Chart shows monthly injury crashes in the project area by month and year for the period 2007-2010.

slide notes:

None.


slide 15: Crash Frequency within Project Limits Q1 2011 from Baseline


Time Period Injury Crashes PDO Crashes Total
Weekdays +32% +174% +121%*
Weeknights/Weekends -27% +61% +31%*
Total +16%** +139%*** +94%*

* percent change is statistically significant at α =0.10
**Lower than expectations per NCHRP 627
***Higher than expectations per NCHRP 627

slide notes:

None.


slide 16: Comparison of Actual and Expected Q1 2011 Project Limit Crashes by Time Period and Severity
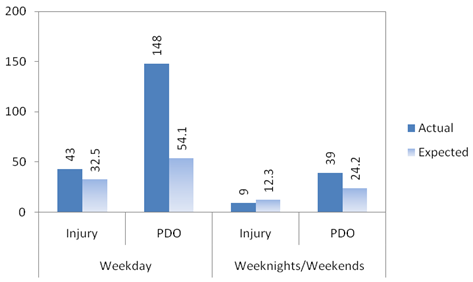

Chart depicts actual and expected crashes and severity. Actual weekday injuries were 44 and expected injuries were 32.5. There were also 148 actual and 54.1 expected PDO incidents during that period. For weeknights and weekends, actual injuries were 9 while expected injuries were 12.3. There were also 39 actual and 24.2 expected PDO incidents during that period.

slide notes:

None.


slide 17: Change in Crashes by Location in Project Q1 2011

Time Period West Segment East Segment
Injury Crashes PDO Crashes Injury Crashes PDO Crashes
Weekdays +9% +99%* +57%* +260%*
Weeknights/Weekends -24% +9% -30% +121%*
Total No change +71%* +33%* +217%*

* percent change is statistically significant at α =0.10


slide notes:

None.


slide 18: Comparison of Actual and Expected Q1 2011 Project Limit Crashes by Location, Time Period, and Severity
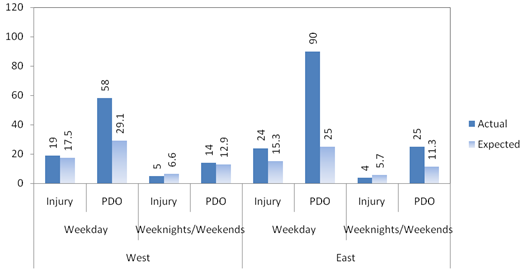

Chart depicts injury and PDO crashes by western or eastern segment.

slide notes:

None.


slide 19: Weekday, West Side Injury and PDO Crashes
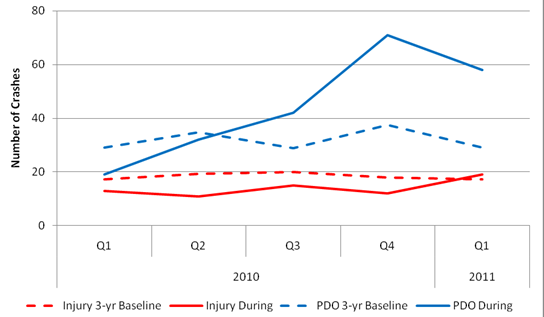

Chart depicts 2010 and first quarter 2011 injury three-year baseline data, injury during data, PDO three-year baseline data, and PDO during data for the west side construction area during weekdays. PDO crashes spiked significantly during the fourth quarter of 2010.

slide notes:

None.


slide 20: Weekday, East Side Injury and PDO Crashes
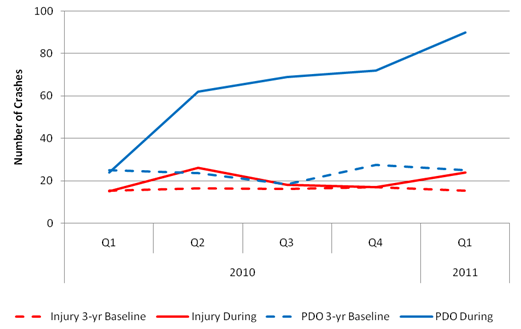

Chart depicts 2010 and first quarter 2011 injury three-year baseline data, injury during data, PDO three-year baseline data, and PDO during data for the east side construction area during weekdays. PDO crashes rose significantly above other trends beginning in the second quarter of 2010 and continued to rise throughout the next three quarters.

slide notes:

None.


slide 21: Weeknight/Weekend, West Side Injury and PDO Crashes
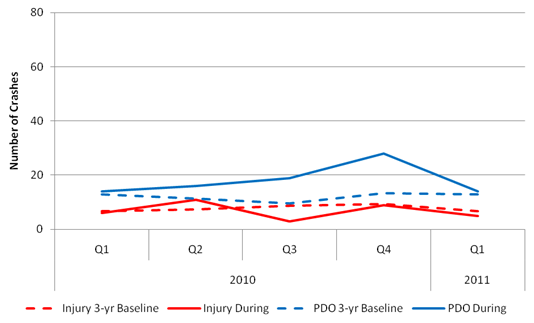

Chart depicts 2010 and first quarter 2011 injury three-year baseline data, injury during data, PDO three-year baseline data, and PDO during data for the west side construction area during weeknights/weekends. PDO crashes are slightly higher than other trends throughout the period.

slide notes:

None.


slide 22: Weeknight/Weekend, East Side Injury and PDO Crashes
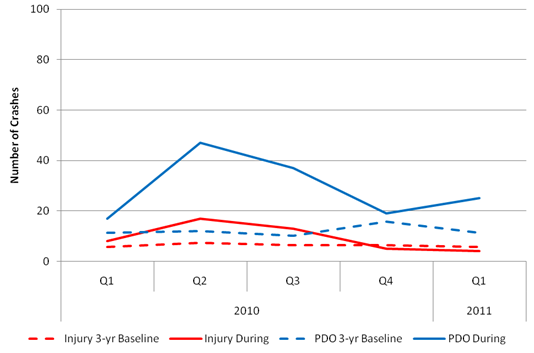

Chart depicts 2010 and first quarter 2011 injury three-year baseline data, injury during data, PDO three-year baseline data, and PDO during data for the east side construction area during weeknights/weekends. PDO crashes spike in the second quarter but decrease steadily through the fourth quarter before rising slightly in the first quarter of 2011.

slide notes:

None.


slide 23: Weeknight/Weekend, West Side Rear-end (RE) and Side-swipe (SS) Crashes
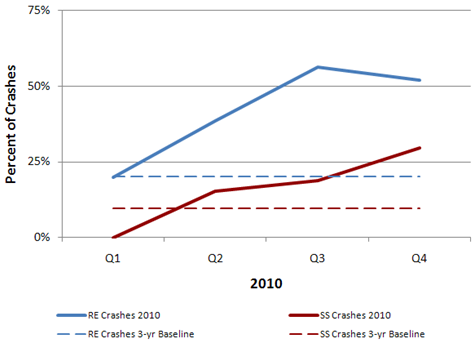

Chart depicts 2010 rear end crashes, rear end crashes three-year baseline data, 2010 side-swipe crashes, and side-swipe crashes three-year baseline data for the west side construction area during weeknights/weekends. Rear end crashes are a significantly higher percentage of all crashes and rise steadily from the first through third quarters before dropping slightly in the fourth quarter.

slide notes:

None.


slide 24: Weeknight/Weekend, East Side Rear-end (RE) and Side-swipe (SS) Crashes
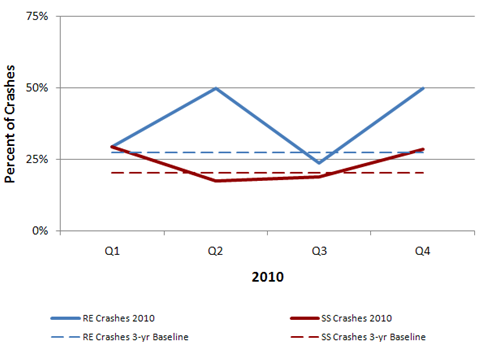

Chart depicts 2010 rear end crashes, rear end crashes three-year baseline data, 2010 side-swipe crashes, and side-swipe crashes three-year baseline data for the east side construction area during weeknights/weekends. Rear end crashes as a percentage of all crashes spike in the second quarter, drop, and then spike and rise steadily in the fourth quarter.

slide notes:

None.


slide 25: Comparison of 1st Quarter 2011 Crash Numbers between TxDOT CRIS and Grapevine PD Hard-Copy Reports
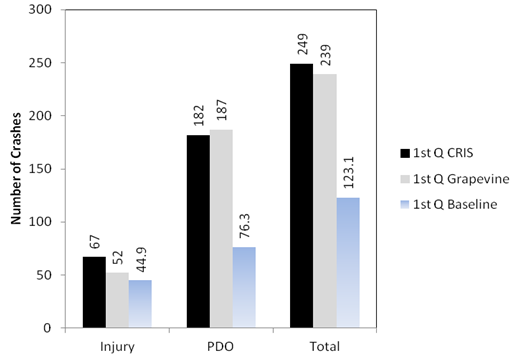

Chart shows that there were 67 injuries in the first quarter for CRIS, 52 for Grapevine, and 44.9 for the baseline. There were 182 PDO incidents in the first quarter for CRIS, 187 for Grapevine, and 76.3 for the baseline. There were 249 total incidents in the first quarter for CRIS, 239 for Grapevine, and 123.1 for the baseline.

slide notes:

None.


slide 26: Field Review


  • Observe conditions to understand nature of crashes
  • Example observations
    • Pavement marking visibility under high sun reflectivity
    • Directional lighting
    • Lane shifts in/near ends of horizontal curves and ramp merges
    • Guide sign placement within 10° cone of vision

slide notes:

None.


slide 27: Future Directions


  • Continuing analysis…next steps
    • Associated with active lane closures
    • Associated with detour routes
    • Comparison of CRIS to In-construction Reports
  • Working to meet FHWA's Toward Zero Deaths: Make work zones safer for workers and public

slide notes:

None.


slide 28: Contact Information


Jason A. Crawford, P.E.
Texas Transportation Institute
(817) 462-0534
jcrawford@tamu.edu

Jerry Ullman, P.E., Ph. D.
Stephen Ranft
Scott Cooner, P.E.

slide notes:

None.

Return to List of Presentations
Office of Operations