I-15 Precast Pavement Project, Ontario, CA
slide 1: EA 08-472214

Jonathan den Hartog, P.E.
slide notes:
Introduce yourself. $52 million project pavement rehabilitation project. Begun in April 2009. Completion April 2011.
slide 2: Project Overview
- Purpose & Need: Rehabilitate over 12 lane-miles of deteriorated PCC pavement.
- Accelerated construction and contracting innovations used:
- CA4PRS, Dynameq, Extended Weekend Closures, Incentives/Disincentives, Precast Pavement
- Goal: Minimize disruptions to traffic, without sacrificing quality and pavement life
- Get in, get out, stay out
slide notes:
None.
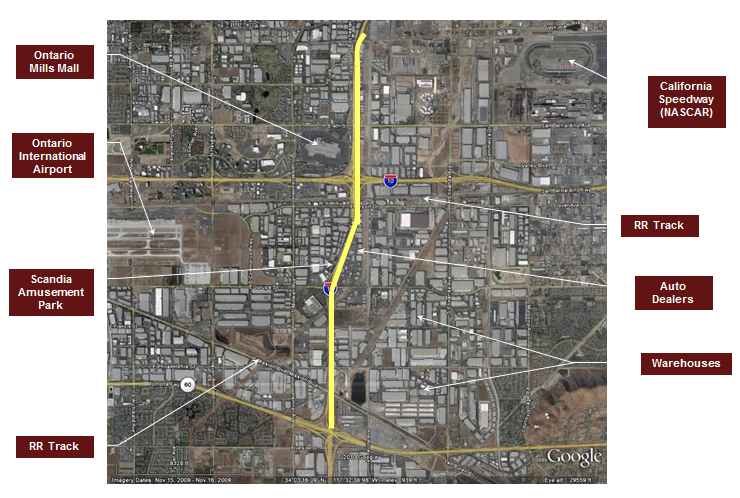
slide 3: Project Location
slide notes:
Ontario is about 40 miles east of downtown LA
In Addition: Major route for Las Vegas traffic. No break on weekends.
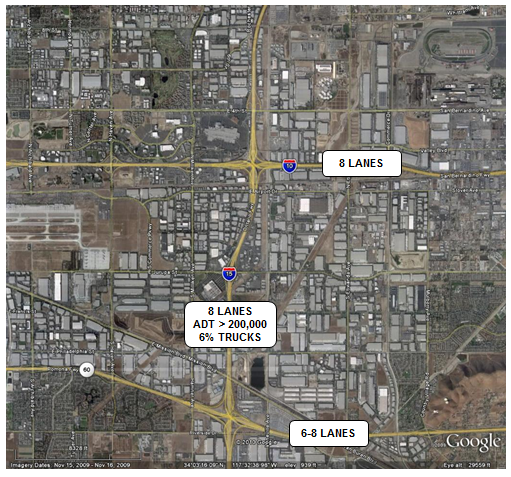
slide 4: Project Location
slide notes:
Again, no break on weekends
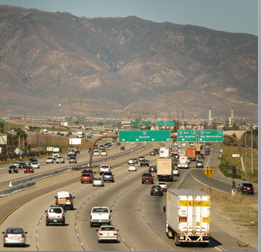
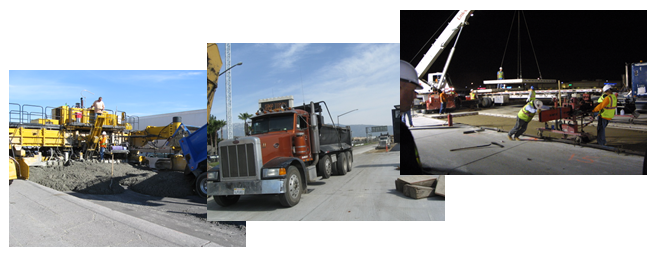
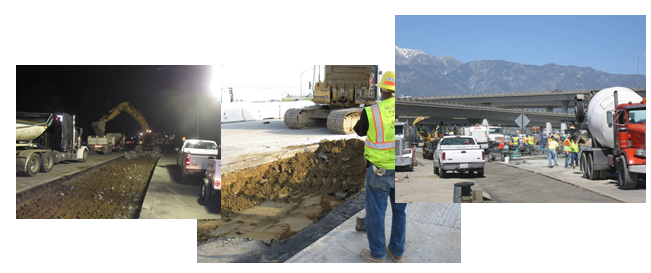
slide 5: Project Features
- Median Paving & Barrier
- Bridge Widening
- AC Shoulder/Ramp Rehab
- Pavement Rehabilitation
- 12 ln-mi lane replacement
- Random slab replacements
- Includes 12 freeway-to-freeway connectors
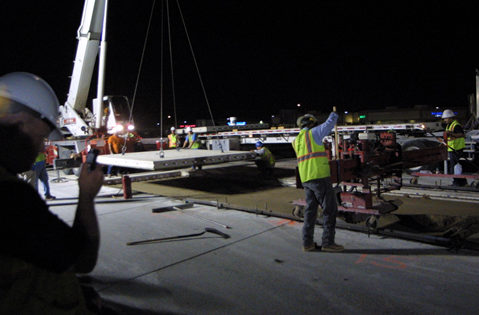
- Precast Pavement (Super-Slab)
slide notes:
Picture is non-rush hour, on a weekday. Saturday would be similar. All days can have traffic jams. Bridge widening was to close the gap between NB and SB bridge decks.
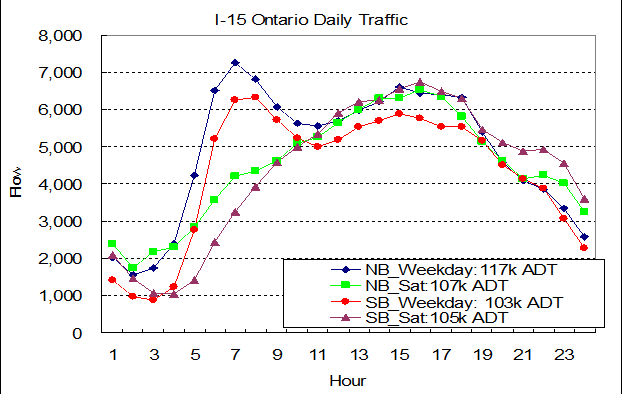
slide 6: Traffic Volumes
slide notes:
None
slide 7: Traffic Impact Mitigation Strategies
- CA4PRS
- Dynameq
- Incentives / Disincentives
- PCMS usage
- Media Outreach
slide notes:
PCMS usage needs to be incorporated early, to address any environmental concerns.
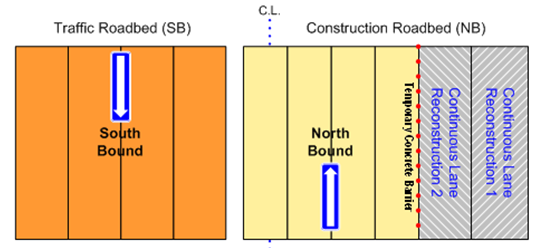
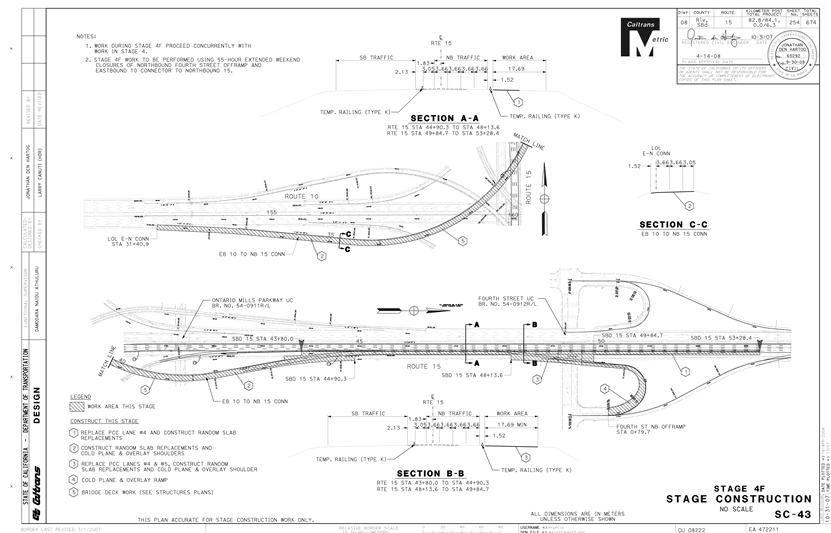
slide 8: Construction Sequence
- Pave median, widen bridges
- Shift southbound I-15 two lanes toward the CL
- Rehab pavement weekday and weekend
- Repeat for northbound I-15
slide notes:
We came up with this strategy as our original plan to manage construction. Based on lessons learned from Devore I. Justified paving the median.
slide 9: Typical Closure
slide notes:
None
slide 10: Rapid Weekeds
- 5 Major Stages, 25 sub-stages
- 410 Working Days (~2 yrs)
- 55-Hour Weekend Closures
- Beginning late Friday evening
- Ending early Monday morning
- Approximately 30 weekends
- ~8 full roadbed closures
slide notes:
Needed CA4PRS to justify this approach (and determine some of these numbers).
Also, wanted to include incentive to reduce number of weekend closures. Needed to justify this.
slide 11: Traffic/Staging Analysis
- CA4PRS
- 2 Phase Study
- Alternative Analysis And Comparison
- Detailed Study of Preferred Alternative
- Performed by consultant sub
- 2 Phase Study
- Construction Traffic Modeling (Dynameq)
slide notes:
The subcontractor was Dr. E.B. Lee
Alternative analysis would be used to determine the # of closures, working days for the project and set an incentive/disincentive (if justified)
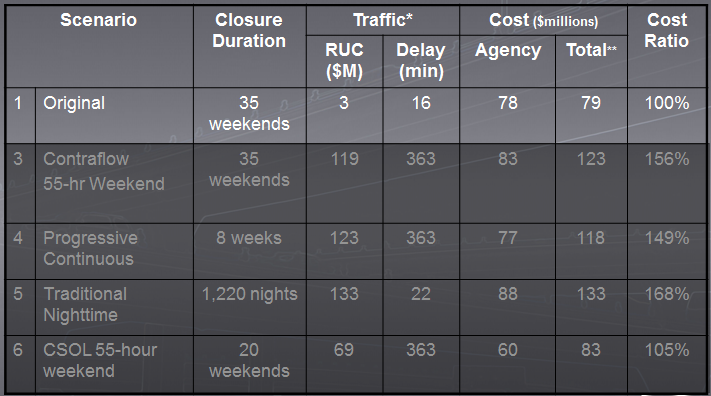
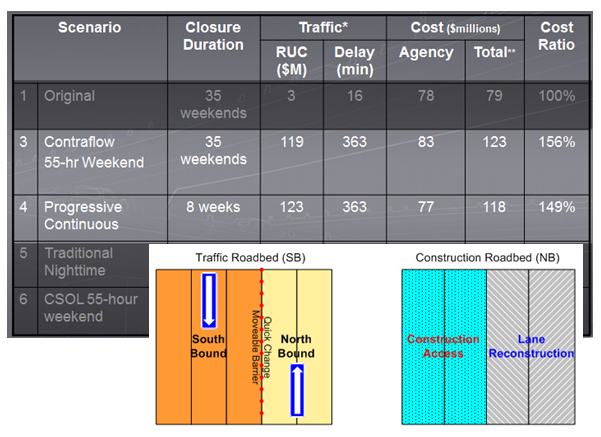
slide 12: Alternatives Analysis
slide notes:
- Go over columns. Delay is per closure.
- 2nd alternative dropped out because of safety concerns.
- Alternative 1 required bridge widening
slide 13: Alternatives Analysis
slide notes:
Alternatives 3, 4 would have serious traffic delay impacts, and would be difficult to determine peak dir., but might be tolerable if the duration was short.
slide 14: Alternatives Analysis
slide notes:
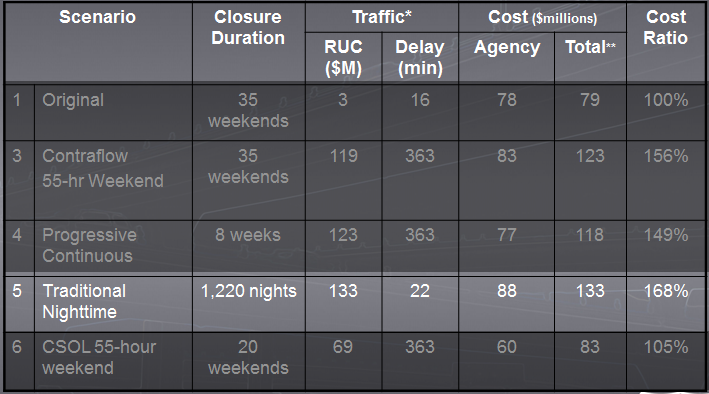
Alternative 5 would take a long time, and still result in a inferior product.
slide 15: Alternatives Analysis
slide notes:
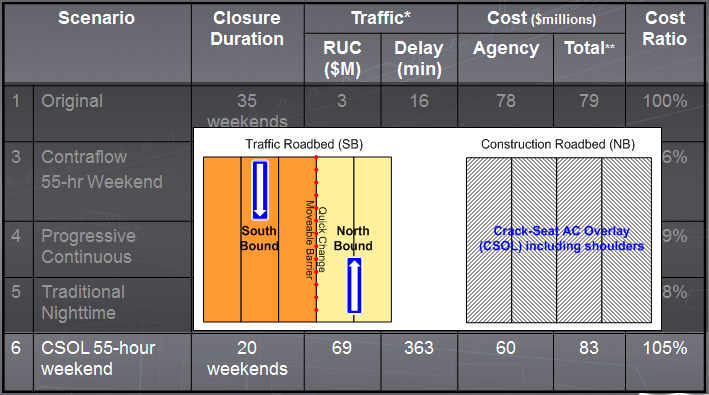
Alternative 6 was close in value to the original, but would have higher delays, and was not preferred by maintenance
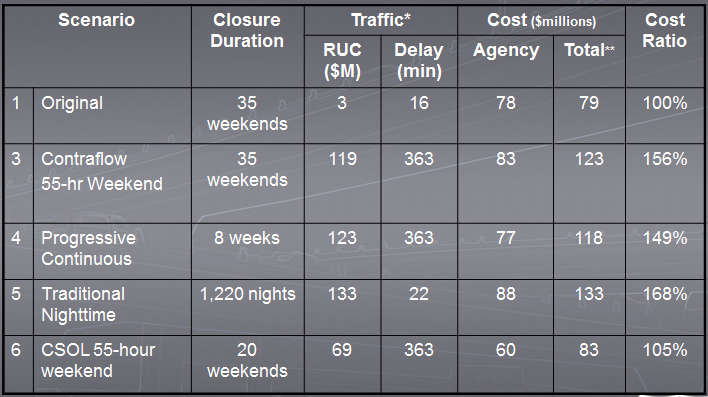
slide 16: Alternatives Analysis
slide notes:
None.
slide 17: Road User Costs/Delay
| Scenario | Demand Reduction | 1,500 vphpl* capacity | 1,700 vphpl* capacity | ||||
|---|---|---|---|---|---|---|---|
| Queue Miles |
Delay Minutes |
RUC** $ (Millions) |
Queue Mile |
Delay Minute |
RUC** $ (Millions) |
||
| 1 – Original | 20% | 8 | 61 | 20 | 2 | 18 | 2 |
| 1 – Original | 30% | 2 | 16 | 3 | 0 | 0 | 0 |
| 3 – 55-hour Weekend | 30% | 51 | 363 | 119 | 34 | 210 | 63 |
| 3 – 55-hour Weekend | 40% | 25 | 179 | 45 | 13 | 81 | 17 |
| 4 – Progressive Continuous | 30% | 51 | 363 | 123 | 34 | 210 | 51 |
| 4 – Progressive Continuous | 40% | 25 | 179 | 47 | 13 | 81 | 13 |
| 5 – 8-hour Nighttime | 5% | 8 | 57 | 418 | - | - | - |
| 5 – 8-hour Nighttime | 10% | 3 | 22 | 133 | - | - | - |
| 6-1 – CSOL (Weekend) | 30% | 51 | 363 | 69 | 34 | 210 | 36 |
| 6-1 – CSOL (Weekend) | 40% | 25 | 179 | 25 | 13 | 81 | 10 |
| 6-2 – CSOL (Nighttime) | 5% | 8 | 57 | 120 | - | - | - |
| 6-2 – CSOL (Nighttime) | 10% | 3 | 22 | 38 | - | - | - |
* vphpl: vehicle per hour per lane
** RUC: Road User Cost
slide notes:
Note that this was done in a spreadsheet that formed the basis of the module in CA4PRS. It was not a part of CA4PRS when we did our analysis.
On at least one weekend, our vphpl approached 2000.
Actual delay was generally between 10-15 minutes during peak hours.
slide 18: Stage Analysis (Sample)
| Stage | Station Start | Station End | No. of Lanes | Length (m) | Length (lane-km) | Rehab Type | Total (lane-km) | 55-hour Closures Estimate |
|---|---|---|---|---|---|---|---|---|
| 4B, 4C | 836+81 | 837+81 | 1 | 100 | 0.1 | CLR | 2.5 | 2 |
| 4B, 4C | SB I-15 Conn WB SR-60 | SB I-15 Conn WB SR-60 | 2 | 773.2 | 1.546 | CLR | 2.5 | 2 |
| 4B, 4C | SB I-15 Conn EB SR-60 | SB I-15 Conn EB SR-60 | 2 | 1430.5 | 0.858 | RSR | 2.5 | 2 |
| 2A | 7+40 | 11+79 | 2 | 439 | 0.878 | CLR | 1.28 | 1 |
| 2A | Jurupa On-ramp SB I-15 | Jurupa On-ramp SB I-15 | 2 | 500 | 0.4 | ACR | 1.28 | 1 |
| 2B | 20+90 | 22+77 | 2 | 187 | 0.374 | CLR | 3.01 | 3 |
| 2B | 22+77 | 28+51 | 1 | 574 | 0.574 | CLR | 3.01 | 3 |
| 2B | 28+51 | 33+03 | 2 | 452 | 0.904 | CLR | 3.01 | 3 |
| 2B | 20+96 | 28+95 | 1 | 799 | 0.24 | RSR | 3.01 | 3 |
| 2B | WB I-10 CONN SB I-15 | WB I-10 CONN SB I-15 | 1 | 337.7 | 0.338 | CLR | 3.01 | 3 |
| 2B | SB I-15 Jurupa Off-ramp | SB I-15 Jurupa Off-ramp | 2 | 500 | 0.4 | ACR | 3.01 | 3 |
| 2B | WB I-10 Conn SB I-15 | WB I-10 Conn SB I-15 | 2 | 300 | 0.18 | RSR | 3.01 | 3 |
| Note: CLR=Continuous Lane Reconstruction; RSR=Random Slab Replacement; ACR=Asphalt Concrete Rehabilitation | ||||||||
slide notes:
This is a more detailed analysis of the original alternative. Used to determine:
- Incentive/Disincentive
- Number of weekends needed (min/max)
- Working Days
- Controlling operations
Good check to make sure our staging works, and that the Contractor has sufficient access.
slide 19: Traffic Study (Dynameq)
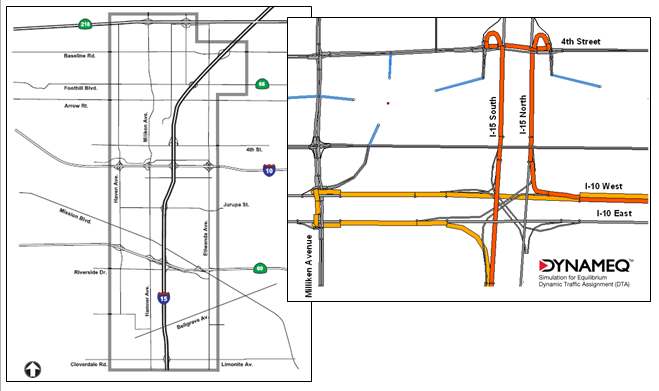
slide notes:
Explain mesoscopic.
- Pros:
- Less complex than microscopic (less data, faster computation)
- More info and better accuracy than macroscopic
- Limitations:
- Only pre-timed signals
- Cannot model RR crossings
- Cannot model single diversion route
- Equilibrium based
slide 20: Traffic Study (Dynameq)
| Closure | Delay (min) Study 1 |
Delay (min) Study 2 |
|---|---|---|
| WB10-SB15 | 5.5 | 8.4 |
| EB10-SB15 | 4.1 | 7.7 |
| SB15-WB10 | 4.5 | 72.6 |
| NB15-E/W10 | 5.8 | 58.6 |
| EB10-NB15 | 5.8 | 8 |
| Reduce SB 15 | 3 | -- |
| SB15-E/W60 | -- | 121.4 |
slide notes:
Don't have modeling expertise in-house. Contracted 2 traffic studies for this project. The second evaluated the first.
Studies looked at 6 closures.
Variables hard to predict: Diversion, detour usage (especially in urban area), effects of economy, user learning
Reduce SB 15 at location studied was not done.
- WB10-SB15 – Actual, closed EB-SB as well. Detour? Delay < 10 min
- EB10-SB15 – See previous.
- SB15-WB10 – Closed SB-EB at the same time, and 4th St onramp. Delay < 10 min. Detour at Jurupa?
- NB15-E/W10 – Delay < 30 min
- SB15-E/W60 – Delay < 10 minutes for at least 2 out of 3 of the closures. 1 closure with delays a bit longer, but still under 30 minutes.
- Note the 15/60 interchange closures.
slide 21: Precast Pavement
|
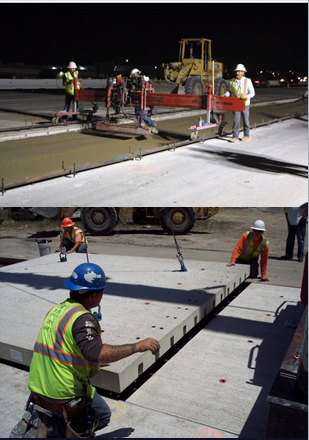 |
slide notes:
- Highways for Life grant: $5 million
- Too much pavement (and too risky on pilot) to do whole project in precast. Selected area where it would test well and benefit project.
- Note differences between this project and I-680 (Tinu's)
- Production rates: 425 feet (32 panels) per 9-hour closure.
- CA4PRS can help plan precast pavement work as well.
slide 22: TMP Strategies
- CA4PRS
- Dynameq
- Incentive/Disincentive
- Project Web Site
- Brochure/Rack Card
- Pre-construction meeting with local agencies
- Regular business meetings
- For closures:
- Radio Ads
- Cancellation disincentive ($25,000)
- COZEEP
+$150,000 / saved closure (Max $900,000)
-$175,000 / extra closure
slide notes:
- Brochure left in strategic places. Rack card mailed to local businesses and residents.
- $150,000 is the average delay damages calculated.
- Incentive is applied for every closure less than 27 used. Disincentive for every closure over 32.
- The disincentive includes $25,000 for the public awareness campaign to alert the public about the closure.
slide 23: CA4PRS Validation
slide notes:
- About 18 closures used, so the Contractor got the full incentive.
- As is often the case, the Contractor changed many things in the construction staging, and was very aggressive in pursuing the incentive.
- We also experienced lower traffic delays than anticipated, we believe in part due to the economy, and in part due to our public awareness efforts.
slide 24: Inputs: Predicted Vs. Actual
| Tab | Input | Study | Actual | Unit | Default Values |
|---|---|---|---|---|---|
| Activity Constraints | Mobilization | 3 | 1 | hrs | 2-3 |
| Activity Constraints | Demobilization | 2 | Varies | hrs | 4-6 |
| Activity Constraints | Concurrent – Demo to Base | 15 | 11 | hrs | 1-2 (Sequential), 9-10 (Concurrent) |
| Activity Constraints | Concurrent – Base to PCC | 8 | 5 | hrs | 1-2 (Sequential), 9-10 (Concurrent) |
| Resource Profile | Demo Hauling Truck | 22 | 22 | tonne | 22 |
| *Resource Profile | Demo Trucks per hour per team | 10 | 10 | ea | 10 for cut & lift, 12 for impact methods |
| *Resource Profile | Demo Packing Efficiency | 0.5 | 0.55 | % | 0.5 for cut & lift, 0.6 for impact |
| Resource Profile | Demo Number of Teams | 2 | 3 | ea | 2 |
| *Resource Profile | Demo Team Efficiency | 0.7 | 0.7 | % | |
| Resource Profile | Base Delivery Truck Cap. | 10 | 6 | m³ | 10 for bottom dump, 6 for end dump |
| Resource Profile | Base Trucks Per Hour | 8 | 16 | ea | 10 |
| Resource Profile | Base Truck Packing Eff. | 100 | 100 | % | |
| *Resource Profile | Batch Plant Capacity | 90 | 90 | m³/hr | 100 |
| Resource Profile | Concrete Delivery Truck Cap. | 6 | 6 | m³ | 7-Jun |
| Resource Profile | Concrete Trucks Per Hour | 15 | 15 | ea | 15 |
| Resource Profile | Concrete Truck Packing Eff. | 100 | 100 | % | |
| *Resource Profile | Paver Speed | 2 | 2 | m/min | 2 |
| Resource Profile | Number of Pavers | 1 | 1 | ea | |
| Schedule Analysis | PCC Thickness | 290 | 315 | mm | |
| Schedule Analysis | Base Thickness | 152.4 | 150 | mm | |
| * Unable to verify actual value
in field Orange shaded rows = Difference speeds up actual production Blue shaded rows = Difference slows down actual production |
|||||
slide notes:
Explain the table headings
Got this input from talking to construction inspectors, and reviewing the inspector diaries.
Haven't been able to verify every actual input (marked with an asterisk), but we have gotten most of the critical ones.
Define orange vs. blue highlighting
Contractor has really understood that the demolition operation is often the critical operation.
The two slow downs have minimal impact (only minor slow down)
CLICK: Show defaults. Note that at the time of analysis, defaults were not included with the program.
slide 25: Predicted Vs. Actual
- Random slabs as night work
- Sometimes paving two lanes wide on connectors
- Combined stages
- Concurrent vs. Sequential
slide notes:
Demo efficiency was validated by how the contractor performed the Super-Slab work: Fort Miller stated that they have seen very few contractors as efficient as this one on the demo operation.slide 26: Predicted Vs. Actual (PRELIMINARY)
| Stage Plan1 | Stage Study1 | Stage Description | No. of Weekends: Study2 | No. of Weekends: Actual2 | No. of Weekends: Revised Inputs3 |
Notes |
|---|---|---|---|---|---|---|
| 4B,C | 5B,C | SB I-15 connectors to E/W SR-60 | 2 | 2 | Contractor was restricted by width of connector, whichf orced him to pave one lane at a time. Only 2 demo teams used. Thus very similar to study | |
| 2B,C | 2B,C | SB Jurupa offramp, W10-S15 conn, E10-S15 conn | 4 | 2 | 2 | Study had separate closures for 2B, 2C. Contractor chose to combine stages. |
| 2D,E | 2D,E | SB I-15 connectors to E/W I-10 | 5 | 2 | 2 | Contractor may have included more in 2E,F combination, also need to determine how contractor handled 3-lane widths |
| 2E,F | 2E,F | Fourth St SB ramps | 3 | 1 | 1 | Added 2E work north of S15-E10 connector diverge |
|
Notes: 1 ‘Plan’ is the stage
designation as it is called out on the project
plans. ‘Study’ is the stage designation
as it is called out in the design study. Differences
exist because of changes that occurred between
when the study was completed and the project
design was finished. |
||||||
slide notes:
Read footnotes later.
Used stages that required more than 1 closure.
Explain: This was create merely by running the revised inputs on the same lane-kilometer objective.
- On the first line, Contractor was restricted by the location to work in a manner very similar to what the study had predicted.
- Second line, the Contractor combined stages, but the study had them separately.
- Third line needs more work to determine why the Contractor was able to perform the work in 2 closures. This highlights the challenge of analyzing this type of work. Contractor significantly revised/combined stages to make work more efficient for his crews.
slide 27: CA4PRS Lessons Learned
- Construction experience is IMPORTANT
- Design input important for efficiency
- Breadth of knowledge required
- Traffic
- Pavement
- Construction
- Estimating
- Team approach may be best
slide notes:
A team approach may be best, maybe even a dedicated team. D8 would like a team that would also do things like LCCA, estimate verification, etc. Interested to hear suggestions from others with experience with the software.
Study resources (CA4PRS only):
- Time consuming part is data collection and deciding how the contractor will perform the work.
- In validation, these things are known already (and hopefully your CA4PRS file is already set up), so validation occurs much more quickly.
- Pre-Construction Study: ~160 hours
- Validation of Results: ~40 hours
slide 28: User Survey
Likert Scale Questions
1 – Strongly disagree ... 5 – Strongly agree
| Question | Average | Std. Dev. |
|---|---|---|
| * Prefer extended weekend closures? | 3.75 | 1.32 |
| * Worth it to widen bridges (20% more cost)? | 3.64 | 1.27 |
| * Super-Slab worth it? | 4.08 | 1.14 |
| * Support measures taken to minimize traffic impacts? | 3.78 | 1.08 |
| * Satisfied with pavement rehabilitation? | 3.53 | 1.28 |
slide notes:
Hard to get respondents.
36 respondents between June 2010 and Feb 2011. However, 32 drove through at least once a week and 22 had been there during a weekend closure.
Survey software: phpESP (open source)slide 29: Future Directions
- Continue training on CA4PRS and promote its use on high-impact projects.
- Statewide Standards group for Precast Pavement Systems (PCPS) to make it easier to use.
- Multi-disciplinary team to use CA4PRS.
slide notes:
Training must be multi-disciplinary (Ops, Design, Construction)
Most of our design staff and operations staff have been trained.
District Director has been asked by HQ to help in promotion of CA4PRS.
slide 30: Contact Info
Jonathan den Hartog
(909) 383-5998
jdenhart@dot.ca.gov
More info:
http://www.dot.ca.gov/hq/research/roadway/ca4prs/index.htm
https://www.fhwa.dot.gov/research/deployment/ca4prs.cfm
slide notes:
None.
Return to List of Presentations