CA4PRS and Accelerated Road Work
slide 1: Construction Analysis for Pavement Rehabilitation Strategies
Accelerated Road Work for Work Zone Safety & Mobility
Peer Exchange Workshop
June 5-6, 2012
E.B. Lee
Institute of Transportation Studies
Univ. of California at Berkeley
Chang Mo Kim
University of California at Davis
slide notes:
CA4PRS is a software tool that helps agencies to analyze pavement rehabilitation strategies from the many relevant aspects associated with the work:
- Traffic
- Pavement selection
- Contractor access
- Production rates and resources
- Agency costs
The tool allows the implementation of an integrated analysis process, with all stakeholders (each seeking to optimize one of the competing objectives) working together.
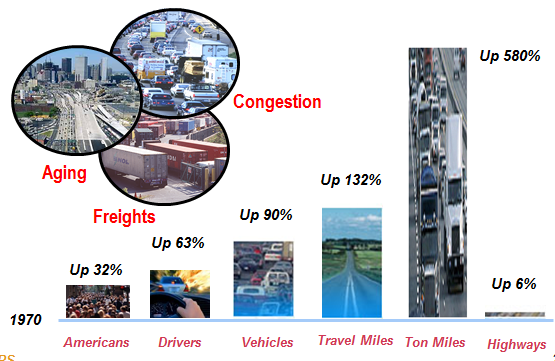
slide 2: Transportation Trends (1970-2010)
slide notes:
This slide shows some trends in the field of transportation that I'm sure all of us are familiar with. This serves as background for the reason tools like CA4PRS are needed.
slide 3: CA4PRS History
- CA4PRS Software Development
- Pooled-fund (CA, FL, MN, TX, WA): UC Berkeley 2003
- Help DOT agencies develop more economical highway construction and TMP strategies
- FHWA Outreach
- 2009 Market-ready Innovation and Technology Product
- Arranged Free-group License for State DOTs
- Training: 1,200 Eng (20 DOTs), 12 univ., Online course
- AASHTO Promotion
- CAST: WZ Traffic Tools: 2007-2009
slide notes:
CAST (Construction Analysis Software Tool). CA4PRS was promoted as part of an AASHTO TIG (Technology Implementation Group) for CAST.
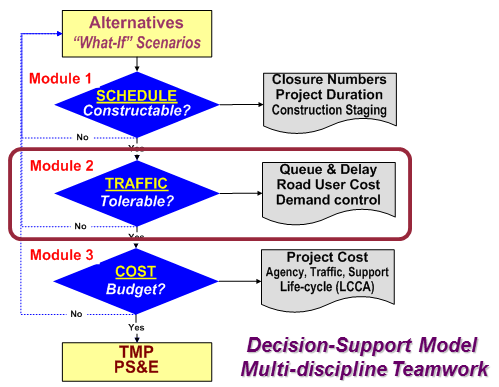
slide 4: CA4PRS Analysis Process
slide notes:
This is an integrated project development work process instead of the traditional sequential work process. Traditional process is: plan, traffic windows, design, construction in order. When a problem is found the project gets sent back upstream. In the integrated multi-discipline process have the planners, traffic engineers, designers, and construction and maintenance engineers all sit together, and work together using the tools to try different scenarios. This results in the « what-ifs » being analyzed ONE time. Minimizes rework, speeds project delivery.
Decisions are made based on calculation of Traffic Delay, Agency Cost and User Delay Cost.
Traffic simulation software allows simultaneous and QUANTITATIVE analysis of construction schedule and traffic delay.
Can use traffic delay calculations to calculate appropriate schedule incentives and disincentives for contractors, so the agency isn't paying too much.
slide 5: CA4PRS Comparison Alternatives
- Pavement Design Alternatives
- Maintenance & Rehabilitation Strategies
- Rigid: JPCP, CRCP, Precast
- Flexible: Overlay, Milling-filling AC, Full-depth AC
- Variation: Cross-section, Mix, Base type
- Maintenance & Rehabilitation Strategies
- Work-zone Traffic Alternatives
- Closure timing (Night, Day, Weekend, Continuous)
- Optimized Lane Closure Hours & Numbers
- WZ Demand Sensitivity & Capacity Sensitivity
- Contractor's Logistics Alternatives
- Site access and Construction sequence
- Constructability (demo/mix): Resource optimization
- Competing Objectives: Integration & Collaboration
slide notes:
None.
slide 6: CA4PRS Estimate – Agency (Project) Cost
- Pavement Cost: Itemized unit-price and quantity
- Materials (PCC, HMA, RAC, Pre-cast), Base, Subbase
- Item unit-price from bid-database
- Non-pavement Cost: % of construction cost
- Earth work cost; Drainage cost
- Specialty items(Retaining/Barrier), Stormwater (SWPPP)
- Traffic Costs
- TMP (COZEEP, I/D) and Traffic-handling, Outreach
- Indirect Cost: % of construction cost
- Minor Items, Mobilization, Supplemental, Contingency
- Support: Agency (Plan, Design, Traffic, Construction)
- Other Optional Costs
- Structures and ROW
→ Total Project Cost
slide notes:
Since audience is traffic people, don't need to spend a lot of time on this slide.
slide 7: CA4PRS Implementation in the Project Life Cycle Process
- Planning Stage (PSR/PA&ED): Scope and Priority
- VE Analysis and Life-cycle Cost Analysis
- Design Stage: PS&E & TMP packages
- Working-days (CPM); Construction staging plans
- TMP Report and Lane closure chart
- Contract Type Selection: A (cost)+B(schedule); I/D
- Construction Stage
- Validate contractor's work-plans and CCOs
- Upcoming Enhancement Modules
- V3.0 Roadway Widening Module
- V4.0 Bridge Replacement Module
- V5.0 LCCA Interaction Module
slide notes:
Roadway widening will be useful for the many HOV projects coming up in CA. V 3.0 by end of this year. V 4.0 in next 1-2 years. V 5.0 in about 3 years.
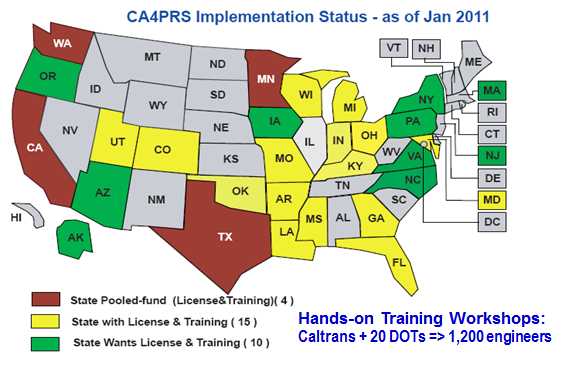
slide 8: CA4PRS Nationwide Implementation Map
slide notes:
Four states participated in FHWA pool fund study to develop the tool. CA took the lead and used the CA4PRS in few locations.
slide 9: CA4PRS Implementation Projects List (as of Feb 2011)

slide notes:
- CA4PRS has been used on the projects shown here.
- WA and MN DOTs have used CA4PRS for analyses for two corridor rehabilitations.
- The whole integrated process was used by Caltrans District 8 on I-15 Devore, including for public outreach efforts
slide 10: Concrete Pavement Cross-sections
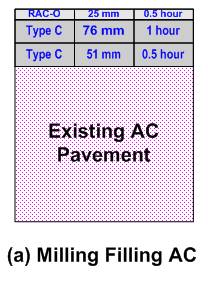
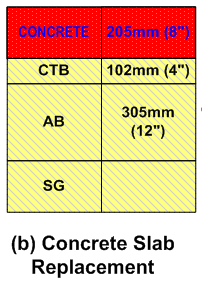
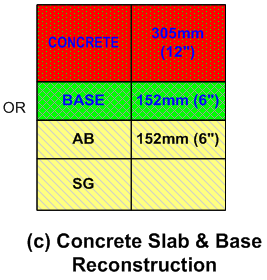
slide notes:
These are samples. Custom sections are possible, as well as things like precast pavement.
slide 11: Closure ↔ Access ↔ Production
Full Closure for Concurrent Method
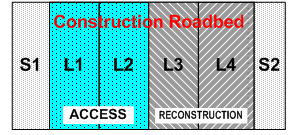
Long Closure
Better Access
Faster Schedule
Higher Delay/Closure
slide notes:
Explain each diagram.
Production per closure is much higher.
slide 12: Closure ↔ Access ↔ Production
Partial Closure for Sequential Method
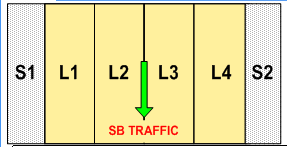

Short Closure
Limited Access
Slower Schedule
Less Delay/Closure
slide notes:
None
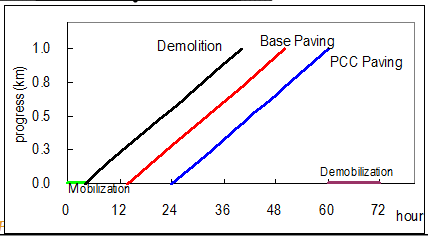
slide 13: CA4PRS WZ Traffic Module Inputs & Outputs (HCM Model)
- Basic Input Data
- Closure schedule.
- 24-hour traffic volumes.
- User's Time values (vehicle cost)
- WZ Impact Analysis Outputs
- Max queue length and max delay per closure
- Total Road User Cost
- WZ Capacity (Sensitivity) and Demand Management
- Road user cost (RUC) Components
- Delay cost; Vehicle operation costs: Detour cost
- WZ Analysis Application
- Evaluate TMP (Lane Closure) Strategies
- Contract: Incentives/Disincentive & A+B
slide notes:
Federal Regulation Amendment 23 CFR 630.1006: "Each State shall implement a policy for the systematic consideration and management of work zone impacts on all Federal-aid highway projects. This policy shall address work zone impacts throughout the various stages of the project development and implementation process. This policy may take the form of processes, procedures, and/or guidance, and may vary based on the characteristics and expected work zone impacts of individual projects or classes of projects. The States should institute this policy using a multi-disciplinary team and in partnership with the FHWA. The States are encouraged to implement this policy for non-Federal-aid projects as well."
Vehicle operation costs are from FHWA numbers. WZ impact analysis uses the Demand-Capacity Model (HCM Ch. 29).
CA4PRS is a tool that helps to address the requirements of this regulation.
slide 14:
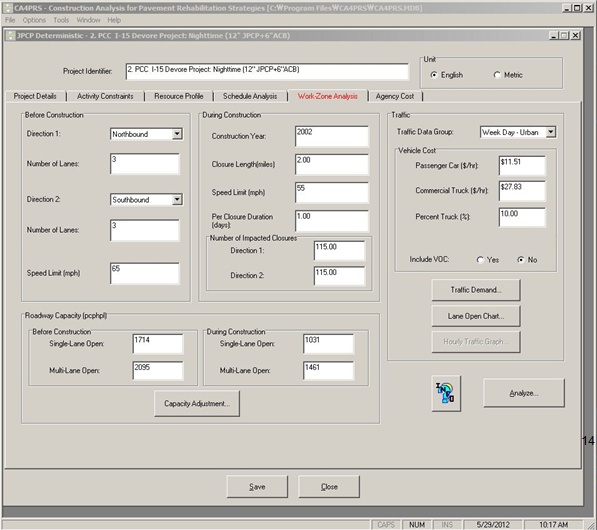
slide notes:
slide 15:

slide notes:
None.
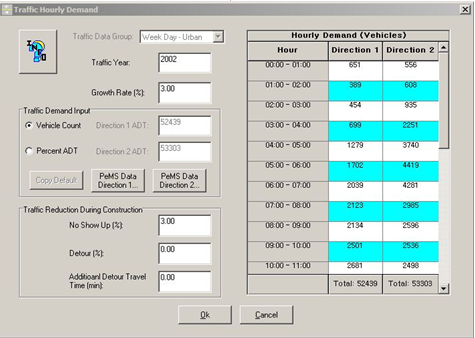
slide 16: Importing Traffic Demand
slide notes:
None.
slide 17:
slide notes:
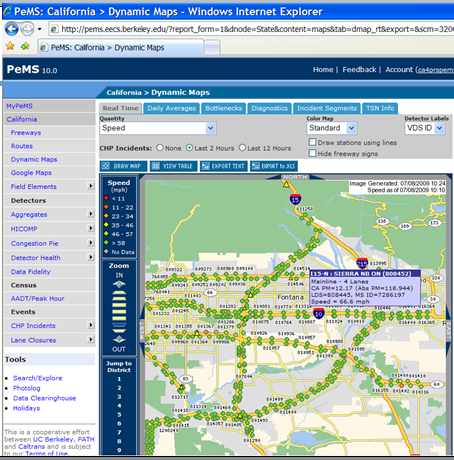
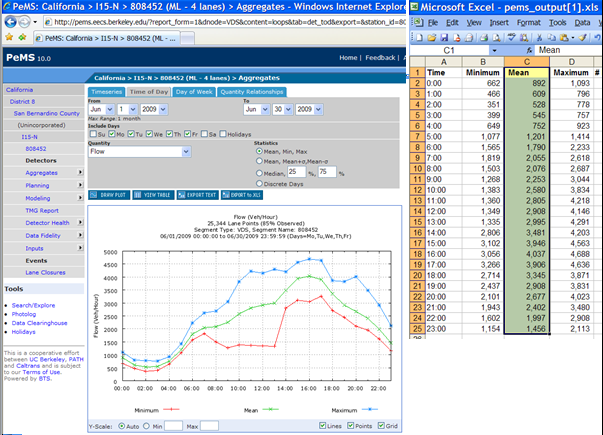
PeMS – Performance Measurement System
Green dot is one PeMS station.
slide 18:
slide notes:
Note some of the configuration parameters. CA4PRS can import this format.
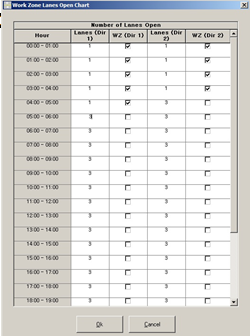
slide 19: Lane Closure Charts
slide notes:
None.
slide 20: Work Zone Capacity
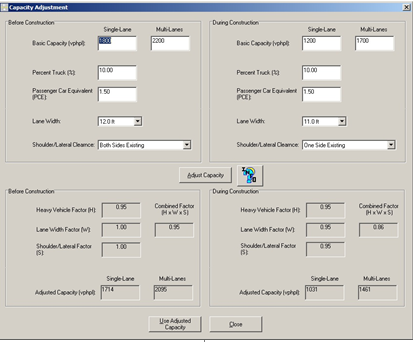
slide notes:
None.
slide 21: Delay Calculation
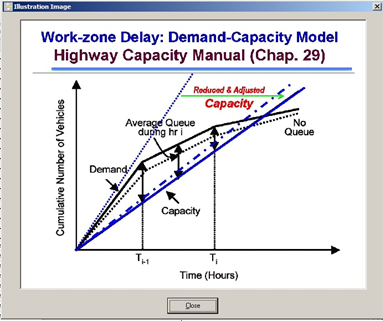
slide notes:
None.
slide 22: Outputs: Summary of Results
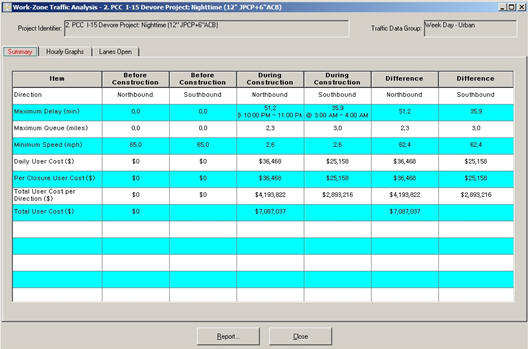
slide notes:
None.
slide 23: Output: Hourly Traffic Patterns
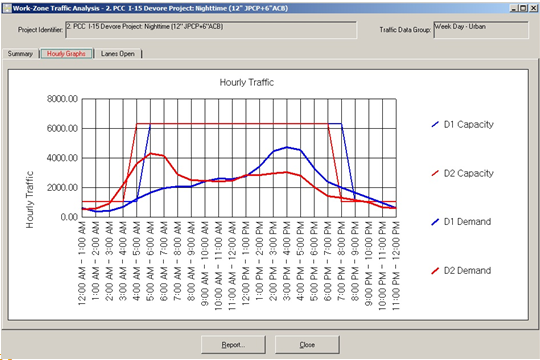
slide notes:
None.
slide 24: Output: Lane Required
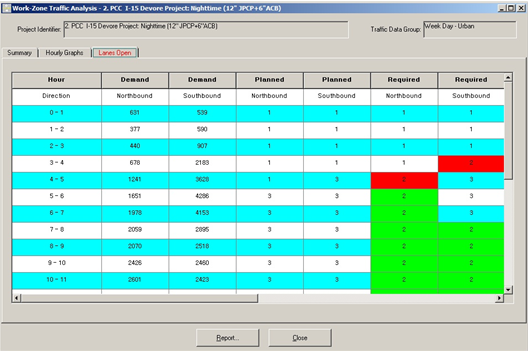
slide notes:
None.
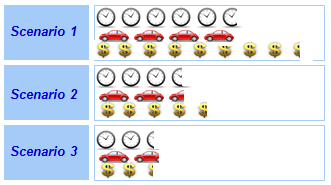
slide 25: Example – Sensitivity Analysis on Demand Management
| Scenarios | Demand Control | Maximum Delay | Maximum Queue | Daily User Cost | Total User Cost |
|---|---|---|---|---|---|
| Scenario 1 |
No show 0 % Detour 0 % |
57 min | 3.3 miles | $ 71K | $ 8.2M |
| Scenario 2 |
No show 5 % Detour 5 % |
37 min | 2.6 miles | $ 41K | $ 4.7M |
| Scenario 3 |
No show 10 % Detour 10 % |
24 min | 1.9 miles | $ 19K | $ 2.2M |
slide notes:
None.
slide 26:
slide notes:
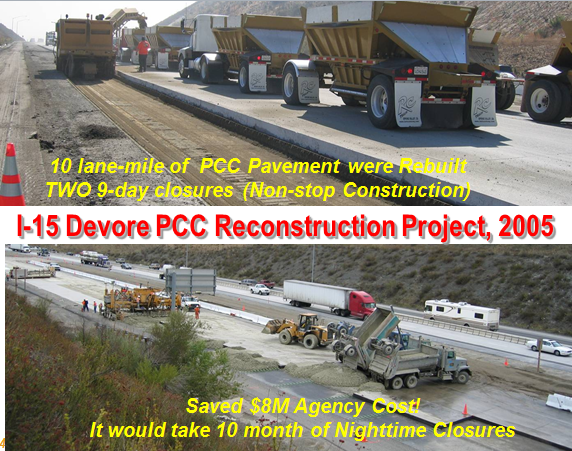
I-15 notes:
ADTs: 111K (M-Th); 127K (F); 115K (Sat); 110 (Sun)
3 centerline miles. Major corridor connecting LA to the mid-west. Also many commuters between high desert and the basin. Major traffic to Las Vegas on Friday afternoon and returning on Sunday afternoon made 55 hour weekend closures not the optimal solution. Nearest available detour adds 3 hours. Replacement of outer lane with thicker slab, doweled, new asphalt base. Inner truck lane was originally to also be replaced, but cost was too high. Instead had slab replacements.
Traffic handling: used Moveable Concrete Barrier (MCB) to move all traffic onto one side of the freeway, freeing the other side for construction.
Schedule: Two continuous 9 day closures.
slide 27: I-15 Devore WZ Capacity: Full-closure Dynamic Lane Configuration Using QCMB
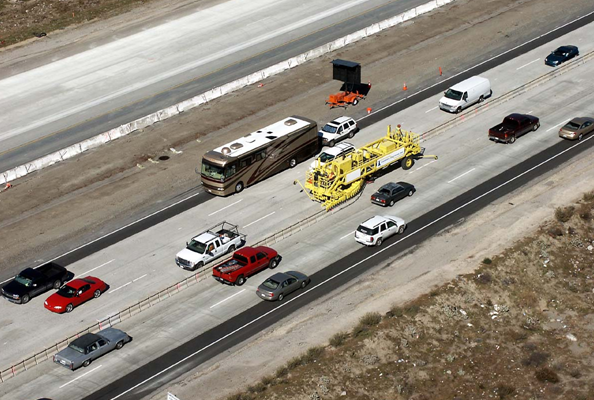
slide notes:
In our LRC input menu, can demonstrate the advantage of this technology.
TMP cost on this project was around $1M (double-check).
Using this on Devore resulted lowered the RUC from $6M (over 1 hr) to less than $1M (less than 20 min). So worth the cost of the equipment.
slide 28: I-15 Devore Pre-construction Analysis CA4PRS Schedule-Traffic-Cost Comparison
| Construction Scenario | Construction Schedule | WZ Traffic Delay | Cost | |||
|---|---|---|---|---|---|---|
| Total Closures | Closure Hours | Max. Delay (Min) | Delay (RUC) Cost ($M) | Agency Cost ($M) | Total Cost ($M) | |
| One Roadbed Continuous (24/7) | 2 | 400 | 80 | 5.0 | 25.0 | 30.0 |
| 72-Hour Weekday Non-stop | 8 | 576 | 50 | 8.0 | 26.0 | 34.0 |
| 55-Hour Weekend Extended | 16 | 880 | 80 | 14.0 | 27.0 | 41.0 |
| 9-Hour Nighttime Closures | 230 | 2,100 | 50 | 7.0 | 31.0 | 38.0 |
| 8-Hour Nighttime Closures | 300 | 2,400 | 20 | 3.0 | 33.0 | 36.0 |
| 7-Hour Nighttime Closures | 410 | 2,900 | 10 | 1.0 | 35.0 | 36.0 |
slide notes:
Agency cost savings are for construction cost and traffic handling ONLY. They do NOT include any calculation of Caltrans support costs.
Costs shown are for: JdH: Advantage of accel. Construction is not just cost savings in RUC. There is also savings in agency cost due to the type of pavements that can be used. Pavement design life is also an issue, especially RSC and FSHCC
Project length was 3 miles, 1 truck lane reconstructed in each direction, 1 truck lane with slab replacements
Alternatives scenarios considered by integrated team
CA4PRS used to calculate schedules
Demand/Capacity; FREQ and Paramics traffic analyses to calculate road user delay, calculate delay costs
Paramics simulations and CA4PRS results used for public outreach meetings
Costs for each alternative shown
Project selected was first one: 1 Roadbed Continuous closure (2 closures, each 9 days)
This information was used for the public hearing and conveyed what Caltrans was trying to do (save $ and minimize total impact on public).
slide 29: I-15 Devore Web Surveys – Public Perception
|
Before-construction
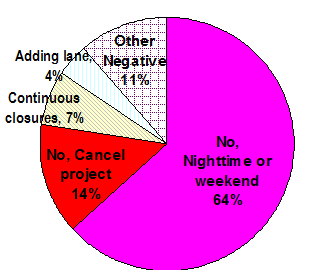 Do you support 72-h (3-weekday) Weekday closures? |
After Construction
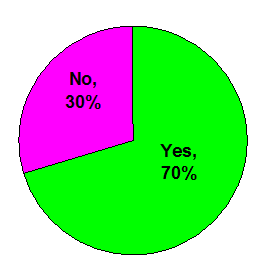 Do you support future "Rapid Rehab" projects? |
slide notes:
None.
slide 30: CA4PRS on Caltrans Web
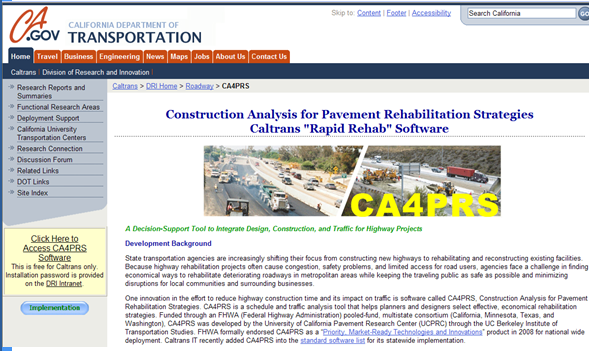
http://www.dot.ca.gov/hq/research/roadway/ca4prs/index.htm
slide notes:
Will mention this info and contact info again at
the end.
slide 31: CA4PRS Download and Installation
slide notes:
None.
slide 32: More Information?
ContactsDr. E.B. Lee: UC Berkeley-ITS (510) 665-3637; eblee@berkeley.edu
Dr. Chang Mo Kim: UC Davis (530) 752-4886; chkim@ucdavis.edu
Ken Jacoby: FHWA Asset Management (202) 366-6503; Ken.Jacoby@dot.gov
Siva Nadarajah: FHWA Turner-Fairbank Highway Research Center (202) 493-3147; Nadarajah.Sivaneswaran@dot.gov
slide notes:
None
Return to List of Presentations