Overview of ABC Alternative Selection Decision Tool and Validation – Oregon-Led Pool Funded Study
slide 1: FHWA OFFICE OF OPERATIONS PEER
EXCHANGE WORKSHOP
INNOVATIVE CONTRACTING AND ACCELERATED CONSTRUCTION
TECHNIQUES FOR WORK ZONE SAFETY AND MOBILITY
ABC AHP Decision Tool
Pool Funded Study, TPF 5(221)
June 5-6, 2012
Denver, Colorado
slide notes:
None.
slide 2: Accelerated Bridge Construction (ABC) Analytic Hierarchy Process (AHP) Decision Tool
PM Lead – Benjamin Tang, P.E. ODOT
PI – Prof. Toni Doolen, Ph.D., OSU
slide notes:
None.
slide 3: Outline
- Overview – Pool funded study TPF 5(221)
- Goals and objectives
- Criteria commonly used in project decisions
- AHP for multi-level and multi-criteria
- Tool Validation – Case Studies
- Deployment Plan
slide notes:
None.
slide 4: FHWA-sponsored pool funded study, TPF 5(221), Technical Advisory Committee
| State | Members and Titles |
|---|---|
| Oregon |
Benjamin Tang, P.E., Br Preservation
Manager |
| FHWA | Mary F. Huie, Highways for LIFE, Program
Coordinator Tim Rogers, P.E., Division Bridge Engineer Nat Coley, Asset Manager |
| California | Paul Chung, Sr. Bridge Engineer |
| Iowa | Ahmad Abu-Hawash, Chief Structural Engineer |
| Minnesota | Kevin Western, Bridge Design Engineer |
| Montana | David Johnson, Bridge design Engineer |
| Texas | Courtney Holle, Transportation Engineer |
| Utah | Daniel Hsiao, P.E., S.E., Sr. Project Manager |
| Washington | Bijan Khaleghi, Design Engineer DeWayne Wilson, Bridge Management Engineer |
slide notes:
None.
slide 5: Overall Project Objective
- Develop a decision tool:
- To help analyze different alternatives and multi-criteria
- To determine which construction approach for a specific bridge project is preferred
- To compare conventional and accelerated construction approaches.
slide notes:
None.
slide 6: Project Goals and Target Users
- Goals of Project
- Bring ABC to ordinary (bread and butter) bridges
- Create a tool that can communicate decision rationale
- Assists users in making ABC a standard practice
- Target User Population
- Project managers
- Engineers
- Project owners
- Program planners
slide notes:
None.
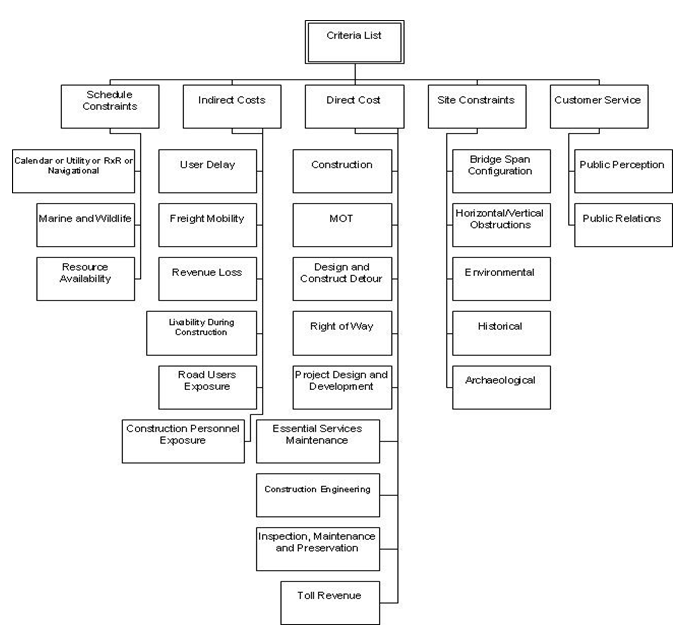
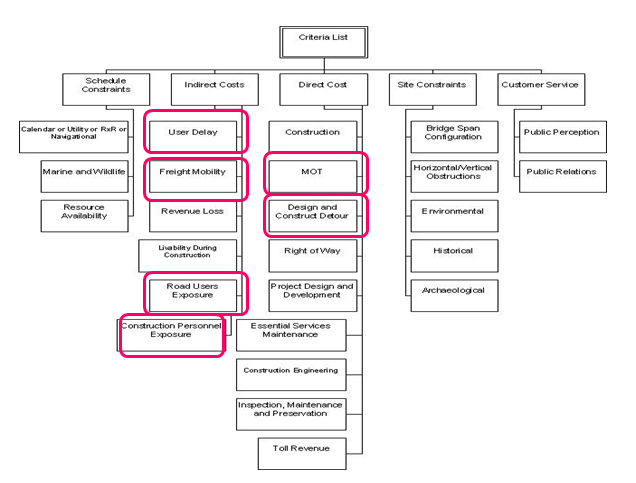
slide 7: Criteria Organization
slide notes:
None.
slide 8: Defining Criteria (Example)
| Criteria | Subcriteria | Definitions |
|---|---|---|
| Indirect Costs | User Delay | This factor captures costs of user delay at a project site due to reduced speeds and/or off-site detour routes. |
| Freight Mobility | This factor captures costs of freight delay at a project site due to reduced speeds and/or off-site detour routes. | |
| Revenue Loss | This factor captures lost revenues due to limited access to local business resulting from limited or more difficult access stemming from the construction activity. | |
| Livability During Construction | This factor captures the impact to the communities resulting from construction activities. Examples include noise, air quality, and limited access. | |
| Road Users Exposure | This factor captures the safety risks associated with user exposure to the construction zone. | |
| Construction Personnel Exposure | This factor captures the safety risks associated with worker exposure to construction zone. |
slide notes:
None.
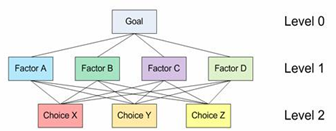
slide 9: Approach to Multi-Criteria Decision-Making
- AHP (Analytic Hierarchy Process) is a decision-making technique designed to select the best alternative from a set of alternatives evaluated against several criteria.
- The decision maker performs pair-wise comparisons that are used to develop an overall priority ranking for each alternative.
slide notes:
None.
slide 10: Analytic Hierarchy Process (AHP)
Developed by Prof. Thomas Saaty, Wharton School of Business (McGraw-Hill, NY, 1980)
- Develop Decision Hierarchy
- Construct Comparison Matrices (linear algebra)
- Calculate Eigenvector and Eigen values
- Check Consistency of Matrices
- Evaluate and Compare Alternatives for Criteria and Decision making
- Conduct a sensitivity analysis of the model
slide notes:
None.
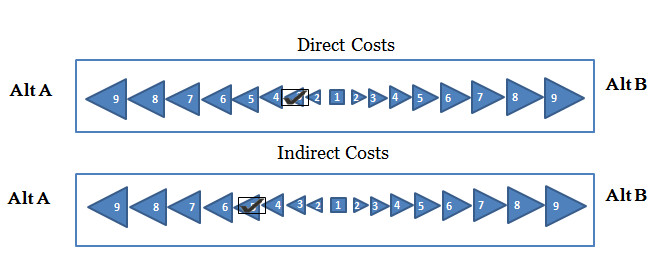
slide 11: Software Demo – Comparing any two alternates
- Working across the tabs from left to right
- Changing/removing default criteria
- Setting label for alternates
- Entering values in pair-wise comparisons
- Processing input or calculating utility values
- Reporting on the results
- Saving your project entries
slide notes:
None.
slide 12: ABC AHP Software
- Default criteria and sub-criteria developed by sponsoring state members
- ABC AHP developed by Oregon State University under TPF 5(221)
- Microsoft Studio Visual .NET 4.0 or later
- Supports Windows (i.e. MS XP, Vista, 7)
- Software interface – tabular design
- User can add/change any criteria
slide notes:
None.
slide 13: AHP Analysis Details
- The hierarchy organizes the decision-making
process
- The factors affecting the decision, i.e. criteria and sub-criteria, progress in gradual steps from general, in the upper levels of the hierarchy, to the particular, in the lower levels of the hierarchy
slide notes:
None.
slide 14: AHP Analysis Details – cont.
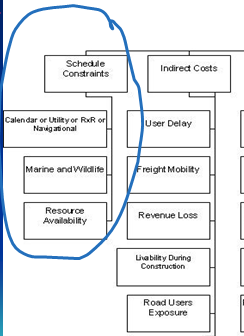
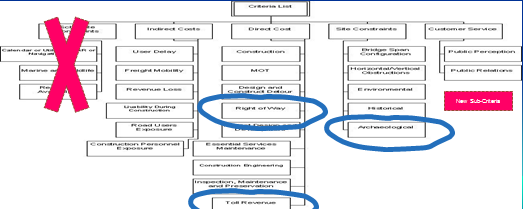
- A decision maker can insert or eliminate levels and elements as necessary to sharpen the focus on one or more parts of the analysis. Less important criteria and sub-criteria can be dropped from further consideration.
slide notes:
None.
slide 15: AHP Analysis Details – cont.
- Comparisons between criteria and between sub-criteria are performed using data from actual measurements or using a qualitative scale.
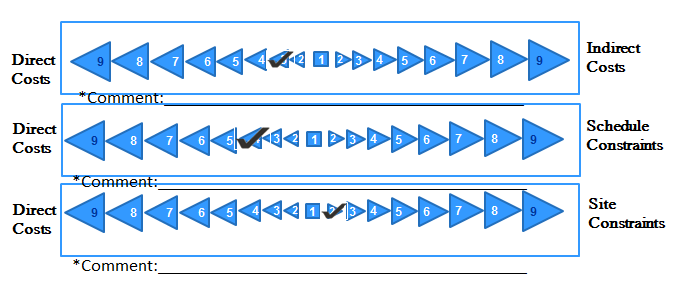
* A comment field was added to allow user
to capture key comments
slide notes:
Criteria are compared to assess the relative importance of one criteria over another criteria or of one sub-criteria over another sub-criteria from the same category of criteria.
AHP enables several criteria to be included in an analysis, but requires the decision-maker to complete only pair-by-pair comparisons (pairwise)
slide 16: AHP Analysis Details - cont.
- Comparisons are also used to assess the extent to which one alternative satisfies a criteria over another alternative.
* A comment field was added to allow user
to capture key comments
slide notes:
None.
slide 17: Case Studies
- Copano Bay, TX
- Sabula, IA
- Others
slide notes:
None.
slide 18: Copano Bay, Fulton/Lamar, TX
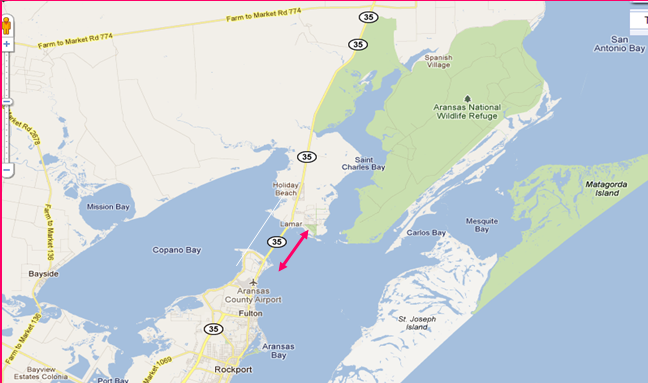
slide notes:
None.
slide 19: Copano Bay Bridge, TX
- Carries SR 35-Gulf Intracoastal Waterway
- 11,010 ft long, 129 ft wide, 75 ft tall
- 100, 120 and 150 PS, PC girders
- Approaches – CIP bent caps on trestle piles
- Main navigational structure – CIP pile caps, tall columns and bent caps
- Oyster bays and migratory birds
- High tourist traffic/bird watchers
slide notes:
None.
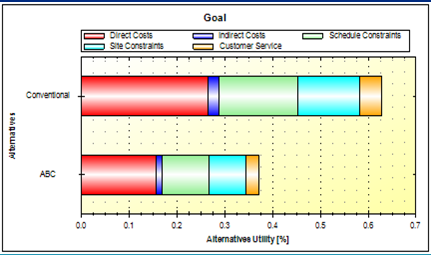
slide 20: ABC versus Conventional
- ABC Alternate: use of precast bent caps
- Conventional: cast-in-place bent caps
Alternative Utility – ABC: 0.720 and Conventional: 0.280
slide notes:
This is the AHP output for the Copano Bay Bridge Project from the input provided by the user. Based on the generated output the calculated utility values for the PBES element and the conventional CIP elements are 0.720 and 0.280 respectively. This means the utility value for ABC is 2.57 times more favorable than the conventional method.
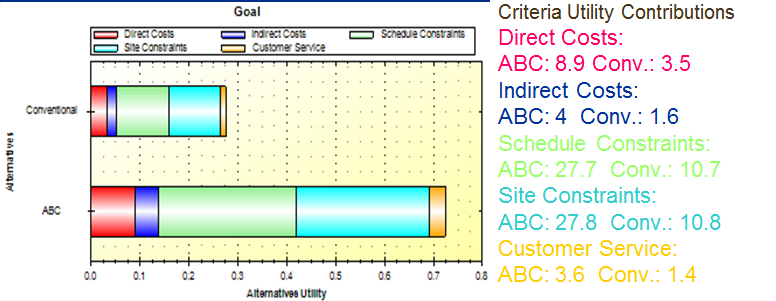
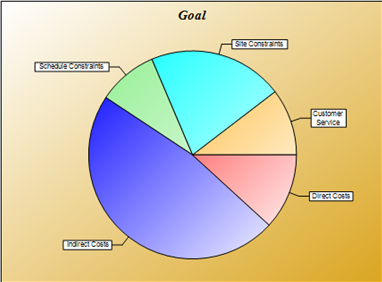
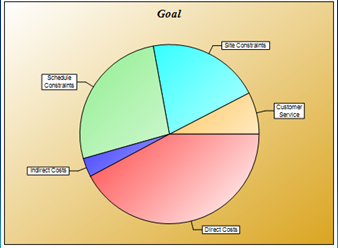
slide 21: Copano Bay – ABC preference – AHP-Synthesized Criteria weights
- Main Criteria contributions:
- Schedule Constraints:38.8%
- Indirect Costs: 6.7%
- Direct Costs: 12.3%
- Site Constraints: 37.8%
- Customer Service: 4.4%
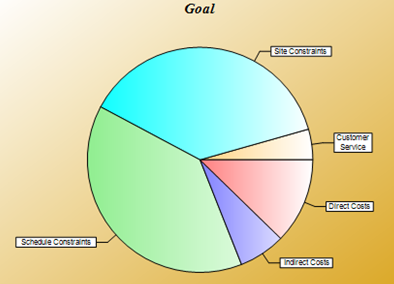
slide notes:
This pie chart depicts how much each high-level (main criteria) criterion contributed to the ABC alternative utilities. The driving main criteria for selecting ABC are schedule and site constraints and direct costs, all totaling a whopping 89% (38.8+37.8+12.3). These amounts are based on the criteria weights assigned by the user from the input provided.
slide 22: Schedule Constraints 38.8%
- ABC top most favorable sub-criteria:
- Marine and wildlife
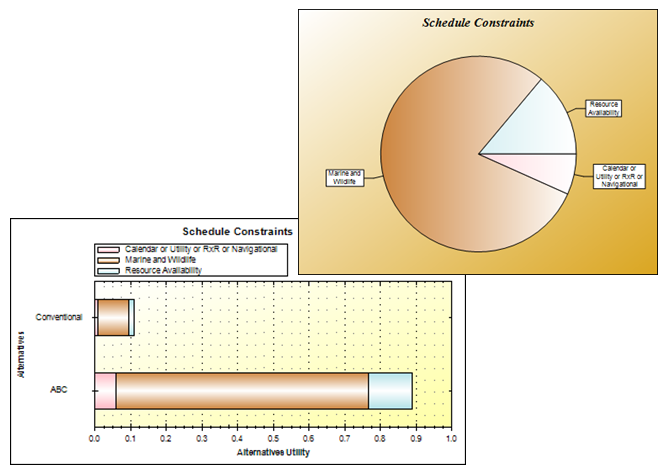
slide notes:
In breaking down to looking at each main criterion individually, the bar chart shows PCC is highly preferred when only the schedule constraints criterion is considered. The pie chart shows the Marine and Wildlife is the major contributor to this preference.
slide 23: Indirect Costs – 6.7%
- ABC top 3 favorable criteria:
- Construction Personnel Exposure
- Revenue loss
- Livability during Construction
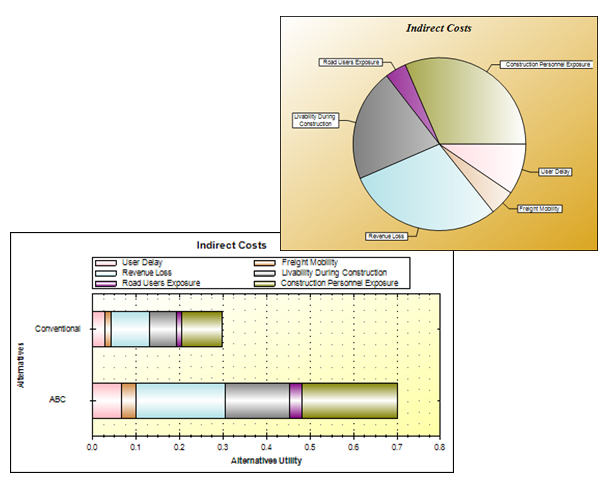
slide notes:
The bar chart shows that PBES alternative is preferred when only indirect costs criteria is considered. The pie chart depicts the top 3 favorable sub-criteria toward ABC are: "revenue loss," "construction personnel exposure" and "livability during construction."
slide 24: Direct costs – 12.3%
- ABC top 3 favorable sub-criteria:
- ROW
- Inspection Maintenance and Preservation
- Design and Construct Detours
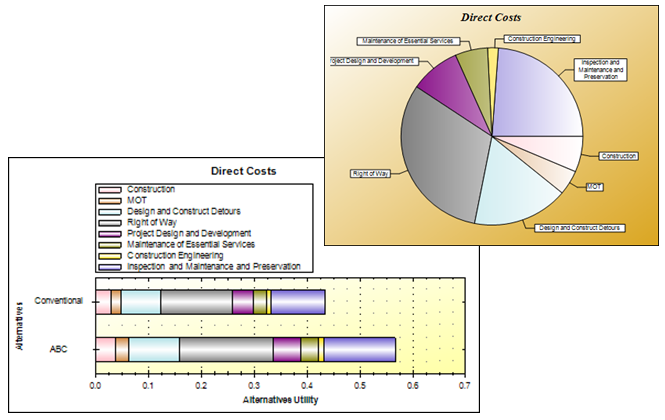
slide notes:
The direct costs criteria are impacted by 8 sub-criteria and their contributions are depicted in both charts. The top 3 favorable sub-criteria that contributed to the alternatives are: ROW; inspection, maintenance, and preservations; and design and construction detours.
slide 25: Site Constraints 37.8%
- ABC top 3 favorable criteria:
- Horizontal/Vertical Obstructions
- Environment
- Bridge span configurations
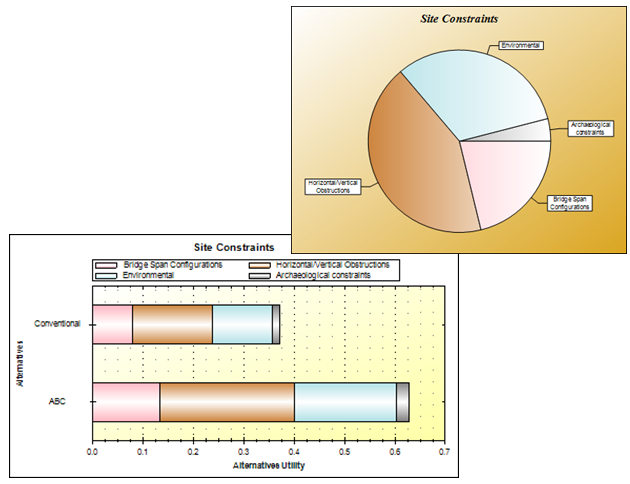
slide notes:
With regards to Site constraints which is an important criteria that make up 37.8% of the utility value, the ABC alternative is preferred. The 3 top contributors came from the following sub-criteria: Horizontal/vertical obstructions, environment, and bridge span configurations.
slide 26: Customer Service 4.4%
- ABC top most favorable criteria:
- Public relations
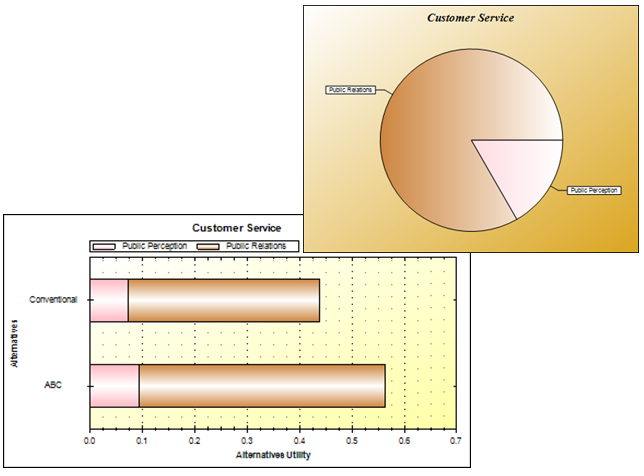
slide notes:
The ABC alternative provides a slightly higher preference based on the customer service criteria contribution, which comes from the public relations.
slide 27: Sensitivity Testing – Copano Bay – Alternative Utility Values
Case Ref: PCC/CIP − 0.720/0.280 = 2.57
| No Schedule Constraints | No Indirect Costs | No Direct Costs | No Site Constraints | No Customer Service | |
|---|---|---|---|---|---|
| ABC: Pre-cast bent caps | 0.608 | 0.713 | 0.733 | 0.759 | 0.737 |
| CIP: CIP | 0.392 | 0.287 | 0.267 | 0.241 | 0.263 |
| ABC/CIP | 1.55 | 2.48 | 2.75 | 3.15 | 2.8 |
slide notes:
None.
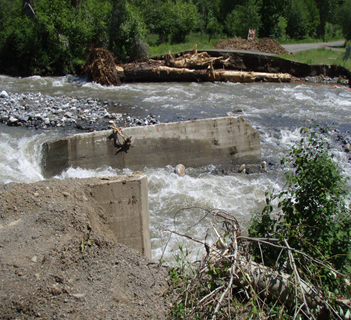
slide 28: Sabula Project, IA
- Alternate A: Same Alignment with Detour (ABC)
- Alternate B: Shifted Alignment (Conv.)
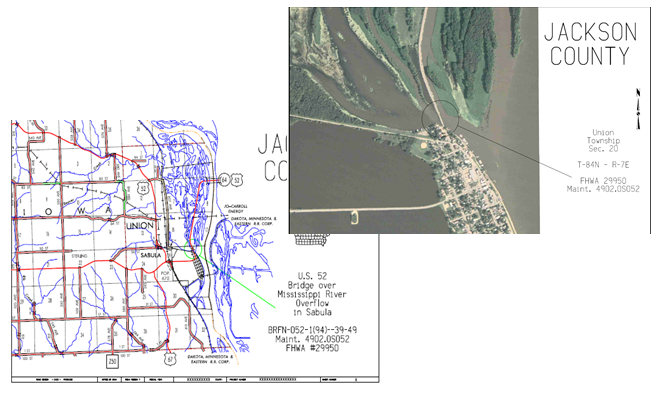
- Steel Truss Bridge
- 342-ft Long X 20-ft
- SD and FO – narrow, heavy corrosion, scour hole 50' downstream, vehicle collision impact on portals
slide notes:
None.
slide 29: Sabula: ABC versus Conventional
- ABC Alternate: same alignment with detour
- Conventional: shifted alignment
Alternative Utility – ABC: 0.728 and Conventional: 0.272
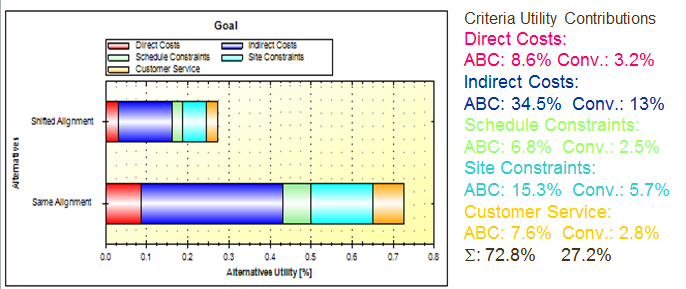
slide notes:
This is the AHP output for the Sabula Bridge Project from the input provided by the user. Based on the generated output the calculated utility values for the ABC alternate and the conventional is 0.728 and 0.272 respectively. This means the utility value for ABC is 2.68 times more favorable than the conventional method.
slide 30: Sabula, IA – ABC preference – AHP-Synthesized Criteria weights
- Main Criteria contributions:
- Schedule Constraints: 9.3%
- Indirect Costs: 47.5%
- Direct Costs: 11.8%
- Site Constraints: 21%
- Customer Service: 10.4%
slide notes:
This pie chart depicts how much each high-level (main criteria) criterion contributed to the ABC alternative utilities. The two driving main criteria for selecting ABC are site constraints and indirect costs, all totaling a whopping 68.5%. These amounts are based on the criteria weights (adding ABC and Conv values) assigned by the user.
slide 31: Sabula: Indirect Costs
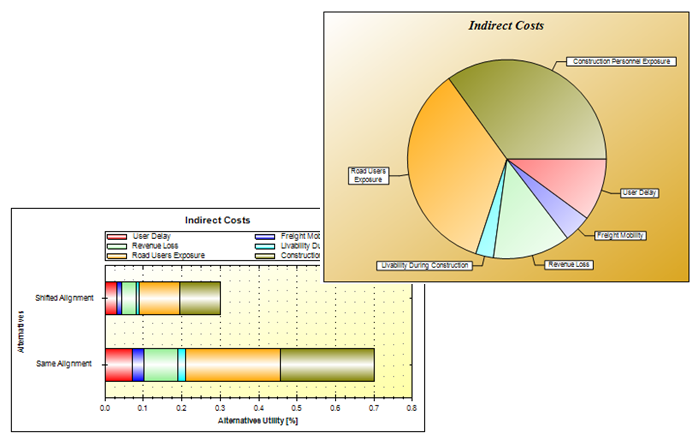
slide notes:
None.
slide 32: Sabula: Site Constraints
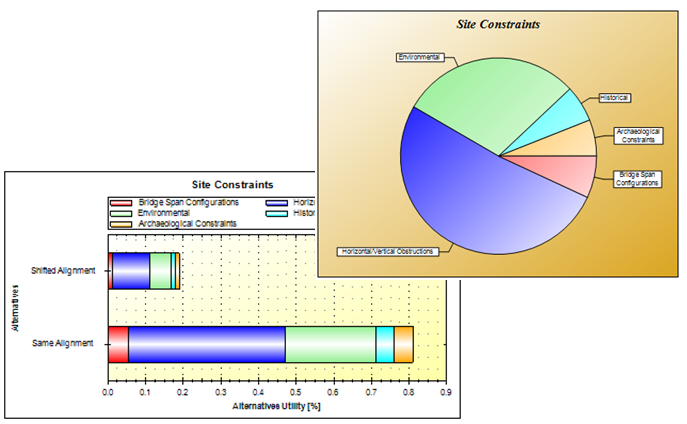
slide notes:
None.
slide 33: Clear Creek – Local agency project
- Existing Bridge length: 29-ft steel girders on concrete abutments
- The bridge is on a rural local road.
- ADT: 90
- Detour length: 1 mile
- The new bridge will be 80-100 ft in length
slide notes:
None.
slide 34: Clear Creek Bridge Project
Conv.: 0.629 (1.7X)
ABC: 0.371
Criteria Utility Contribution
- Direct Cost:
ABC – 15.7% Conv – 26.5% - Schedule constraints:
ABC – 9.8% Conv – 16.7% - Site constraints:
ABC – 7.5% Conv – 12.8%
slide notes:
None.
slide 35: Clear Creek Bridge Project
Conv.: 0.629 (1.7X)
ABC: 0.371
- Main Criteria Contribution
- Direct costs: 42.2%
- Indirect costs: 3.4%
- Schedule constraints: 26.5%
- Site constraints: 20.3%
- Customer service: 7.6%
slide notes:
None.
slide 36: A list of other projects used
- Elk Creek Bridge, OR
- Grand Mound Project, WA
- I-405 Temple Ave, Long Beach, CA
- Keg Creek Bridge, IA
- Millport Slough Bridge, OR
- Pistol River (2)
- Rte 710 Bridge Widening, CA
- SR 16 EB Nalley Valley I/C, WA
slide notes:
None.
slide 37: Traffic Cost Impact on Criteria
slide notes:
None.
slide 38: Maintenance of Traffic and User Delay Costs (HYRISK)
- Detour Mileage Cost (DMC):
- Duration (days) X Length (km) X Cost/Length X ADT
- Cost per KM vehicle driven of detour: $0.27
- ADT
- ADTT as a percentage of ADT
- Time cost per person/hr: $16.31
- Occupancy rate per vehicle: 1.56 in Oregon
- Time cost per hour per truck: $29.50
- Speed of Travel: km/hr
slide notes:
None.
slide 39: MOT and UDC: Sample Project
- Project Br # 00138
- Duration: 365 days
- Detour length: 26 km
- Speed: 64 km/hr (40 mph)
- ADT 330
- ADTT: 10% of ADT (0.10)
Detour Mileage Cost (DMC): $845,600
Detour Time Cost (DTC): $1.265 M
Total Community Cost Associated with Bridge Closure: $2.11 M
slide notes:
None.
slide 40: Do the Math...
- Detour Mileage Cost: D*L*CpL*ADT: (365*26*$0.27*330) = $845,559.00
- Detour Time Cost: (24.38 min extra/veh)
(365 days * 24.38/60 (hr) * 330 daily traffic* {(1.56*$16.31)*0.9 veh + ($29.50*0.1 truck)}) = $1,264,876.00
Total Delay Cost: $0.845M + $1.265 M=$2.11 M
slide notes:
None.
slide 41: Summary
- The AHP Decision making – effective technique to select the best option from a given set of alternatives evaluated against several criteria and sub-criteria
- Breaks down a multi-dimensional decision matrix into a pair-wise comparison
- Provides a formalized and apparent decision process with quantifiable values contributed by each criteria
- Create conversation among decision makers
slide notes:
None.
slide 42: Deployment Plan & Proposal
- FHWA preparing software Sect 508 compliance
- ODOT's technical support when needed
- FHWA to promote its adoption and develop training
- Several webinars (FHWA EDC, NHI and FIU)
- Provided training to ODOT users (3-hr sessions)
- Presentation at Regional conferences
- ODOT Pilot projects – 3 currently in progress
slide notes:
None.
slide 43: Questions?
Benjamin.m.tang@odot.state.or.us
(503) 986-3324
slide notes:
None.
Return to List of Presentations