Work Zone Road User Cost Calculation Guidance
slide 1: Work Zone Road User Cost Calculation Guidance
Suri Sadasivam
slide notes:
None
slide 2: Presentation Outline
- Work Zone Road User Costs (WZRUC) Concepts and Applications – FHWA Office of Operations Document
- WZ RUC: Definition, Components and Computation
- Applications of WZ RUC
- MOT Alternate Analysis
- Contracting/ Project Delivery Methods
- Benefit-Cost Analysis
slide notes:
None
slide 3: Work Zone Road User Costs Concepts and Applications Document
|
 |
slide notes:
None
slide 4: WZ RUC DEFINITION COMPONENTS AND COMPUTATION
slide notes:
None
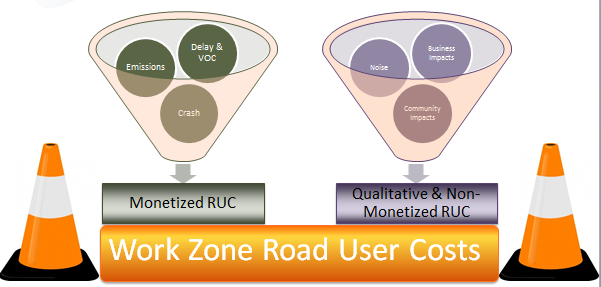
slide 5: WZ RUC Definition
- "WZ RUC is the additional cost borne by the motorists and local communities due to work zone activity."
slide notes:
Key Message: This slide presents the key components of work zone RUC which include both costs to the motorists passing through the work zone as well as costs to the local communities as well.
It is noted that the traditional definition of WZRUC primarily includes the monetized components of work zone impacts to motorists such as delay and vehicle operating costs or VOC. The report discusses these costs along with the crash and emissions costs in a rigorous manner. Other off-site cost components are discussed but are not considered rigorously because:
- Factors influencing their computation are site specific
- No generalized method or tool is yet available – These impacts are hard to monetize.
slide 6: Applications of WZ RUC
- System preservation and improvements
- e.g. life cycle cost analysis of pavements, bridges and pavement markings
- MOT strategy selection
- e.g. selection of work zone MOT strategies
- Operational efficiency of work zones
- e.g. post-construction mobility and safety performance review
- Benefit-cost analysis of capital investments
- e.g. economic efficiency of construction innovations
- Contract administration
- e.g. determination of incentives and disincentives
slide notes:
Key Message: This slide presents some of the key application areas of WZ RUC.
Traditionally the WZ RUC has been used in the life cycle cost analysis of highway structures such as pavements and bridges. The application of WZ RUC in LCCA is well established. Application in other areas is still nascent and is the focus of this presentation and report.
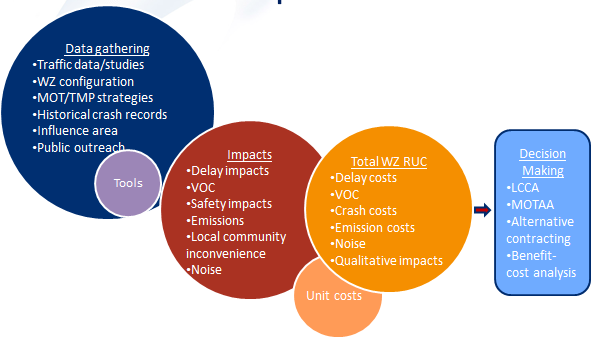
slide 7: WZ RUC Computation Process
slide notes:
Key Message: This slide presents the snapshot of the overall WZ computation process. It should be noted that computing the RUC numbers is only one aspect of the overall process.
The computation process begins with (1) data gathering (2) work zone impact assessment (3) unit cost determination (4) estimation of WZ RUC components and (5) applications in decision making. The process is applicable at various stages of a project's life cycle: in project scoping, in preliminary engineering phase and in design, construction and in-service (for maintenance and rehabilitation) phases of a project.
slide 8: Tools for WZ RUC Computation
- Work Zone Traffic Impact Analysis Tools
- Sketch-planning tools
- State-specific tools (e.g. Michigan's CO3, Colorado's WorkZone-RUC)
- QUEWZ-98
- Quick Zone
- CA4PRS
- Simulation tools
- Macroscopic (e.g. PASSER)
- Mesoscopic (e.g. DYNASMART)
- Microscopic (e.g. CORSIM)
- Sketch-planning tools
- Economic analysis tools
- Life cycle cost analysis (RealCost)
- Benefit cost analysis (HERS-ST, MicroBENCOST, Cal B-C, BCA.Net)
slide notes:
Key Message: Various tools are available for traffic impact analysis. Generally speaking, micro and mesoscopic tools give better delay estimates.
The report on which the presentation is based recommends the use of FHWA Traffic Analysis Tool box (Vol. IX) for guidance on tool selection. The report also presents a brief description, capabilities, input and outputs, advantages and disadvantages for each sketch planning tool.
- Work zone traffic impact tools are used to estimate the mobility impacts, which in turn, are used in the WZ RUC computation.
- Sketch-planning tools generally provide rough estimation of impacts based on demand-capacity analysis.
- Simulation tools, particularly the meso and microscopic simlation tools, provide more accurate results – recommended for high impact projects
- Each tool has its unique features, advantages and disadvantages
- Economic analysis tools generally have traffic analysis tools in-built in the program.
slide 9: 3 Steps to Estimate Monetary Components
- Estimate work zone impacts
- Mobility impacts (e.g., delay, VOC) → traffic/economic analysis tools
- Crash rates/frequency → project-specific historical records
- Emission rates → static or dynamic emission factor models
- Derive unit costs for each impact (use the Bureau of Labor Statistics economic indices for unit cost adjustments)
- Mobility → monetary value of travel time & vehicle operating costs
- Crash → human & comprehensive costs by crash severity
- Emissions → air pollutant damage costs ($/ton)
- Monetize impacts
slide notes:
Key Message: Mention that the report provides detailed guidance on all the three steps.
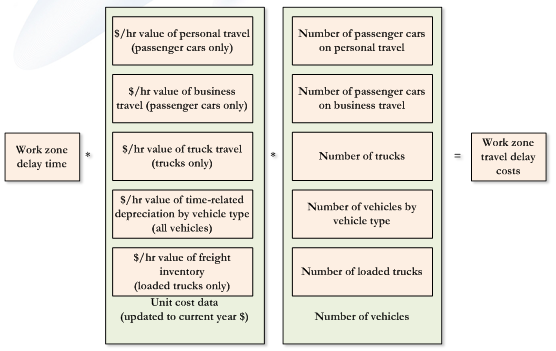
slide 10: Estimating Travel Delay Costs
slide notes:
Key Message: Aggregation of 5 different components as shown – delay to personal travel and business travel for autos, truck delay, freight inventory delay and delay related vehicle depreciation.
Once the individual impacts are known, they can be further analyzed to estimate road user costs. Shown here is the detailed delay cost estimation flow chart. In this example, once the average delay time through a work zone is known, it can be used to estimate the 5 major subcomponents of delay costs, namely, delay to personal travel and business travel for autos, truck delay, freight inventory delay and delay related vehicle depreciation. Note that typically agencies do not separate personal and business travel delay for autos and do not consider freight inventory delay costs and delay related vehicle depreciation costs as these are smaller components of the overall costs. However, the report presents guidance on all the delay cost components for completeness.
slide 11: Estimating Personal Travel Delay Costs (Autos)
- Determine the proportion of passenger cars on personal travel
- National averages may vary with local or intercity travel
- Establish the average vehicle occupancy (AVO) of cars
- National averages from National Household Travel Survey (NHTS)
- Estimate per person-hr value of personal travel time
- Uses median annual income reported by the U.S. Census Bureau (OST guidelines)
- Compute per vehicle-hr value of travel time (=Step 2*Step 3)
- Compute travel delay costs for passenger cars (=Step 4*total delay time estimated from traffic studies/modeling)
slide notes:
Emphasize the importance of using locally derived data for unit costs particularly for high impact projects.
The report provides step-by-step procedures for other components of delay costs. These steps are not presented herein for the time-related constraints.
slide 12: Estimating Vehicle Operating Costs
- VOC components
- Fuel and engine oil consumption
- Tire-wear
- Repair and maintenance
- Mileage-related depreciation
slide notes:
None
slide 13: Estimating Vehicle Operating Costs
- Work zone through traffic (includes forced flow condition)
- Speed change, stopping and idling conditions
- VOC models
- NCHRP Report 133 (implemented in RealCost)
- Texas R&D Foundation – Zaniewski et al (e.g. MicroBENCOST)
- HERS-ST – modified Zaniewski equations
- Detour traffic (assuming no forced flow on detour routes)
- Per-mile costs
- VOC models (at constant speed conditions)
- AAA Your Driving Costs
- American Transportation Research Institute -ATRI (for trucks)
- Per-mile costs
slide notes:
Traffic flowing through a work zone undergoes (1) speed change in free-flow condition (2) speed change, stopping and idling in forced flow condition.
VOC models are used to quantify additional resources consumed due to change in flow conditions. e.g. additional fuel consumed during idling
Detour traffic may or may not experience changes in flow conditions depending on the detour route capacity and diverted traffic volume. If there is no impact, a simple cents/mile estimates can be used. Otherwise, a detailed traffic analysis is required for detour routes at the network or route level (depending on the impact and site-specific factors).
AAA and ATRI provide simple cents/mile estimates with no due consideration to travel speed, grade, and pavement conditions.
VOC models provide per-mile estimates based on the average speed.
slide 14: Steps for Estimating VOC
- Traffic flowing through work zone
- Estimate speed change cycles and idling time using traffic analysis tools
- Update the unit cost data used in the VOC models
- Estimate cost impact of speed change and idling time using VOC models
- Estimate the total VOC
- Detour traffic
- Determine additional distance traveled due to detour
- Use VOC models to consider speed differential for detour conditions
- For simpler calculations, use AAA/ATRI or equivalent estimates
- Estimate the detour VOC
slide notes:
Key message: This slide provides general steps to compute VOC for both WZ through traffic and detour traffic (with no forced flow impacts).
For detours with forced flow impacts, use the steps for WZ through traffic.
slide 15: Steps for Estimating Crash Costs
- Determine the pre-construction crash rate for "influence area"
- Sort by crash severity – 3-year to 5-year averages
- Estimate WZ crash rate using a Crash Modification Factor (CMF)
- Typical WZ CMFs can be found at CMF Clearinghouse website
- Use of agency-derived CMFs reflecting local trends is strongly recommended
- Estimate the measure of WZ exposure (typically in MVMT)
- Defined by the WZ influence area, vehicle miles traveled and the WZ duration
- Compute unit cost for crashes
- Human capital comprehensive costs (by crash severity)
- Crash cost estimates presented in the report FHWA-HRT-05-051
- Use of agency-derived unit costs are recommended
- Human capital comprehensive costs (by crash severity)
- Compute aggregated WZ crash cost estimates for the project
slide notes:
- Crash severity is defined by two commonly used scales: KABCO and AIS.
- K→Fatal, A→Incapacitating, B→Injury evident, C→Injury possible, O→Property damage only
- AIS (0-6 scale): 6 → Fatal, 0→ No injury
- WZCMFs are available on the CMF Clearinghouse website, a repository established and maintained by the FHWA Office of Safety.
- This site contains a compilation of CMFs reported in the literature.
- WZ CMFs are the weak link here. The WZ CMFs are not well studied.
- We have tried to give the best available guidance.
- Note that there are no statistically accepted values of CMFs, as they were found to vary from study to study.
- We refer to the NCHRP Report 627, done by Jerry Ullman and others, to provide guidance on the increased risks related to WZ closure.
- CMFs should account for safety improvement countermeasures to be implemented in the work zone.
- Human Capital Costs → only those hard dollars directly related to crash (e.g. property damage, medical costs)
- Comprehensive → human capital costs PLUS intangible nonmonetary losses to individuals, families and the society
- FHWA-HRT-05-051 "Crash Cost Estimates by Maximum Police-Reported Injury Severity Within Selected Crash Geometries"
- Here again, these are the estimates. We have tried to provide the best available guidance to illustrate the methodology.
- We highly recommend the use of agency-specific estimates reflecting local trends.
slide 16: Steps for Estimating Emission Costs
- Estimate emissions rates (by emission type)
- Static emission factor OR Dynamic instantaneous emission models
- Determine Unit Costs for Emissions
- No consensus on emission costs
- Available unit cost estimates: HERS-ST & Caltrans – typically based on the economic analysis of health impacts caused by emissions
- Determine emission costs
- = Σ (VMT x Emissions Rate x Cost/ton) by Emissions Type
slide notes:
- Emission factor relates the amount of pollutants released to the atmosphere with an activity associated with the release.
- Static models calculate emissions based on average operation conditions. These models are generally suitable for large-scale planning studies where the estimations based on average speed are highly accurate. These models may not be accurate enough for speed change cycles in work zone conditions.
- Dynamic models incorporate the effects of instantaneous changes in vehicle operating conditions, and thus making them more suitable for work zone applications.
- Some tools may already have capabilities to estimate emission rates. In such cases, the users should be aware of the type of models (static vs dynamic) used in the tool.
- There is no consensus how to assign a dollar value to quantify the impacts of each pollutant type. Caltrans $/ton estimates were established based on the economic analysis of health impacts caused by emissions.
- Also note that the unit costs vary widely with source-related factors such as population density and land cover of the work zone location. Metropolitan areas with high population densities are affected more strongly by emissions than rural areas.
slide 17: Non-monetary & Qualitative Impacts
- Predict construction noise levels
- Estimate noise levels for various construction operations, e.g., FHWA Roadway Construction Noise Model
- Impacts of local communities and business
- Impact studies, surveys, public outreach and community awareness programs to identify needs and concerns
slide notes:
Highway cost allocation study (HCAS) uses noise damage costs but these estimates are for normal operating conditions and do not account for work zone effects.
slide 18: APPLICATIONS OF WZ RUC
slide notes:
None
slide 19: WZ RUC in MOT Alternative Analysis
- WHAT – Process for identifying the best MOT strategy
- WHEN – Recommended when the agency-set performance thresholds are exceeded
- HOW – Comparative evaluation of potential benefits, costs, and constraints
- Requires consideration of both quantitative and qualitative impacts
- Use of decision analysis tools
- Involves the following broad set of actions:
- Identify evaluation criteria and prioritize them
- Identify candidate alternatives
- Evaluate MOT alternatives against set-criteria
- Select the preferred strategy
slide notes:
- First bullet: what is MOTAA ?
- Second bullet: When is MOTAA needed ? FHWA requires MOTAA for all projects with impacts (or high level of disruption) that are greater than what is considered tolerable based on the respective agency's policy and/or engineering judgment.
- Third bullet: What is done in MOTAA ? The potential benefits, costs and constraints associated with each MOT alternative is evaluated
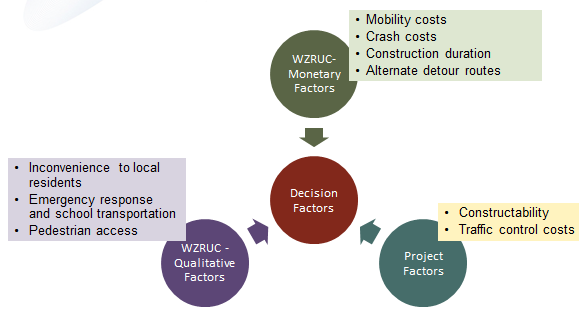
- Fourth bullet: What information is required for MOTAA ? The quantitative and qualitative factors of WZ RUC, as well as project-specific factors. There is a need to combine them (quantitative, qualitative and project factors) in a systematic fashion.
- Fifth bullet: Are there any tools to perform MOTAA ? Any appropriate tool can be used. We illustrate with the Kepner-Tregoe Decision Analysis tool.
slide 20: WZ RUC in Alternative Analysis
Defining Decision Criteria – Focus on WZ RUC
slide notes:
Key message: All MUST and WANT objectives were defined using quantitative and qualitative work zone factors and project factors.
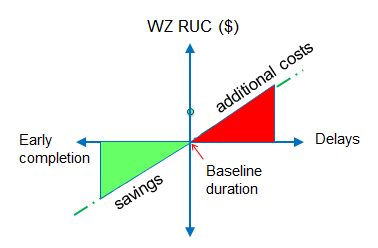
slide 21: WZ RUC in Contracting/Project Delivery WZ RUC vs Project Completion Time
slide notes:
None
slide 22: WZ RUC in Contracting/Project Delivery
Key Application Areas
- Justifying the need for schedule acceleration
- Expediting project completion costs money
- Not required for every project
- Identify the need based on project conditions and WZ road user impacts
- Selecting the most appropriate project delivery strategy
- Design-Bid-Build, Design-Build, CMGC
- Establishing time-related contract provisions (e.g. I/D)
- Incentive/Disincentives
- Daily I/D = Discount Factor * Daily WZ RUC
- A+B bidding
- Bid value = (A) + (B x Daily WZ RUC)
- Lane Rental
- Rental fee = difference in WZ RUC between actual and allowable closure periods
- Incentive/Disincentives
slide notes:
None
slide 23: WZ RUC in Contracting/Project Delivery
Why Accelerated Road Work ?
Typical Questions to establish the need for acceleration
| Heavy traffic volume ? Located in urban area ? Commuter route ? Network level impacts ? Early completion required ? Time-sensitive project ? Lacks viable detour alternatives ? |
Located in tourist or economically
sensitive area ? Political interests ? Affects local community and business ? Safety issues for construction workers ? Safety issues for motorists ? |
slide notes:
None
slide 24: Application of WZ RUC in Benefit-Cost Analysis
- To evaluate the economic efficiency of a decision
- Compare costs & benefits
- e.g. economic value of construction innovation
- How an alternative compare with others
- e.g. accelerated construction vs cast in-place techniques
- Agency costs & WZ RUC
- Compare costs & benefits
| Illustrative Examples: Economic Analysis of Council Bluffs and Keg Creek ABC Projects |
slide notes:
The next application area is the use of WZ RUC in benefit-cost analysis to rationalize the use of innovative technologies.
Key Message: This slide provides an overview of WZ RUC applications in benefit-cost analysis.
slide 25: Questions?
slide notes:
None
Return to List of Presentations