Minnesota STH 36 Full Road Closure
slide 1: TH 36 – Highways for Life
Steve Kordosky
Minnesota DOT
slide notes:
None.
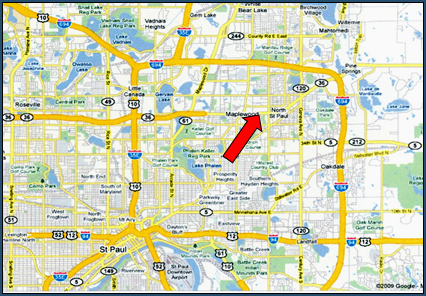
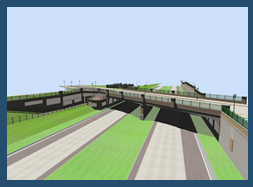
slide 2: Project Location
slide notes:
We are competing with the world for our message.
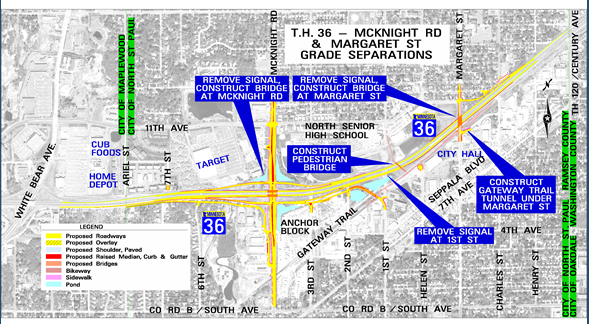
slide 3: Project Description
slide notes:
None.
slide 4: Corridor Background
|
 |
slide notes:
None.
slide 5: Project Background
|
 |
slide notes:
None.
slide 6: Project Challenges
|
|
slide notes:
None.
slide 7: New Idea!!!
- Close TH 36 During Reconstruction
- Detour Traffic to alternative routes
- Are we CRAZY!!
slide notes:
None.
slide 8: Construction Office Concerns
|
|
slide notes:
None.
slide 9: How do we do this?
- Public Buy-in
- Business Impacts
- Congestion
- Construction Efficiency
slide notes:
None.
slide 10: HFL Performance Goals
- Safety: workzone, worker, facility
- Construction Congestion: Faster, fewer delays
- Quality: Smoothness, noise, user satisfaction
slide notes:
None.
slide 11: How Long Will it Take?
|
 |
slide notes:
None.
slide 12: Market Research
- Residents/Commuters/Businesses
- Pre-Construction Survey
- Prefer 2-years construction vs 5 month closure
- Post-Construction Survey
slide notes:
None.
slide 13
- Residents
- In favor of construction
- Likely to be moderately supportive of either
- Higher percentage preferred 5 month closure
- Through commuters
- In favor of construction
- Likely to be moderately supportive of either
- Slightly more favorable to 2 year off peak delays
- Split 50-50
slide notes:
None.
slide 14
- I694/35E Users
- Slightly more favorable reaction to 2-year non-peak delays
- Split 50-50
- Businesses
- More favorable to 2-year non-peak delays
- More likely to react negatively to 5-month closure
- Higher percentage preferred 2-year non-peak delays
slide notes:
None.
slide 15: 5 Month Closure
Reasons for Stated Preference
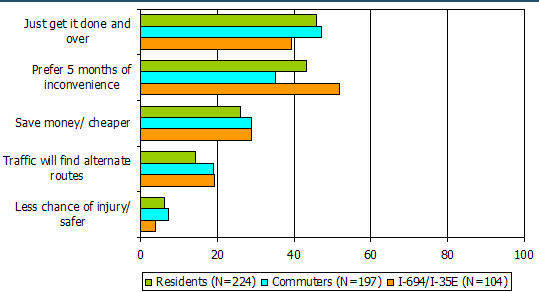
slide notes:
If go with 2-year off peak – need to address these things in communications
slide 16: Reasons for Stated Preference
2 Year Off Peak Delays
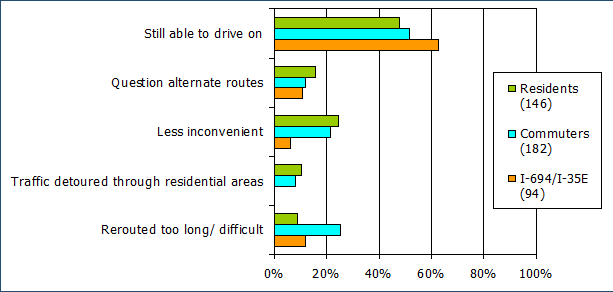
slide notes:
None.
slide 17: Biggest Impacts
- Early Coordination
- "Detour Days"
- "Open for Business – Surviving and Thriving During Construction" Workshop
slide notes:
None.
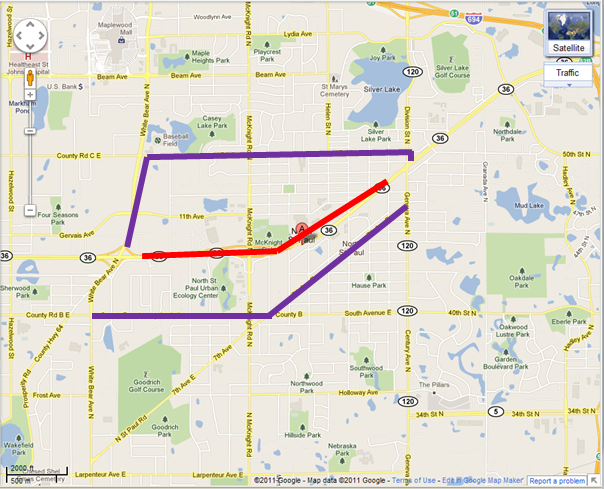
slide 18: Where will the Traffic Go?
|
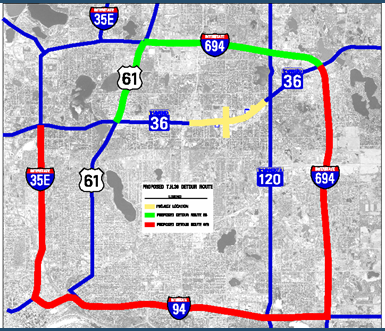 |
slide notes:
None.
slide 19
slide notes:
None.
slide 20
slide notes:
None.
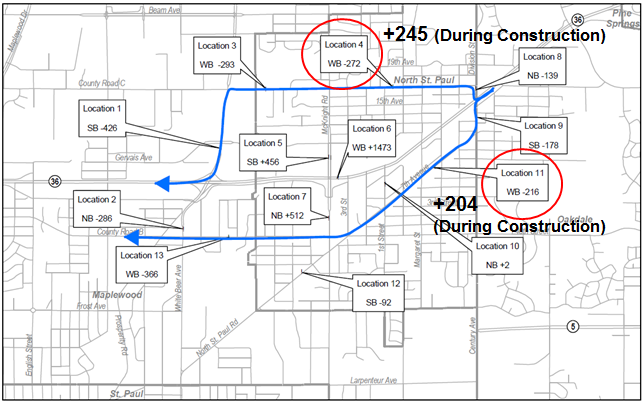
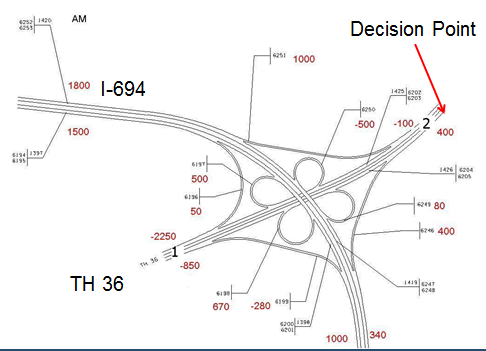
slide 21: HOW MANY TRIPS WENT LOCAL?
- Westbound AM Peak Hour
- 876 Vehicles needed detour
- 245 went to County Road C (#4)
- 204 went to County Road B (#11)
- 51% of traffic
slide notes:
None.
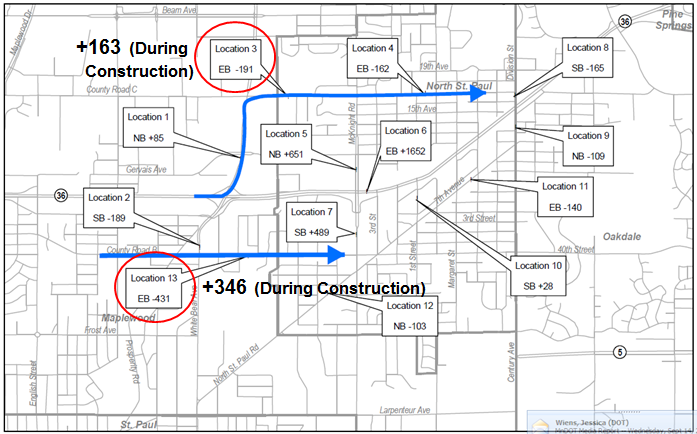
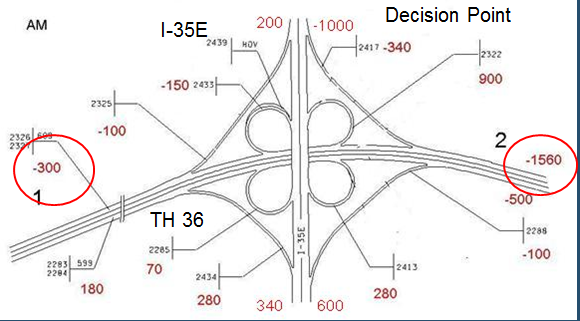
slide 22: HOW MANY TRIPS WENT LOCAL?
- Eastbound PM Peak Hour
- 1,279 Vehicles needed detour
- 163 went to County Road C (#3)
- 346 went to County Road B (#13)
- 51% of traffic
slide notes:
None.
slide 23: HOW MANY TRIPS WENT LOCAL?
- Not all increase traffic from Detour
- Access closures are redirecting traffic (10-20%)
- AM Peak probably 32-42% (vs 50%)
- PM Peak probably 20-30% (vs 40%)
slide notes:
None.
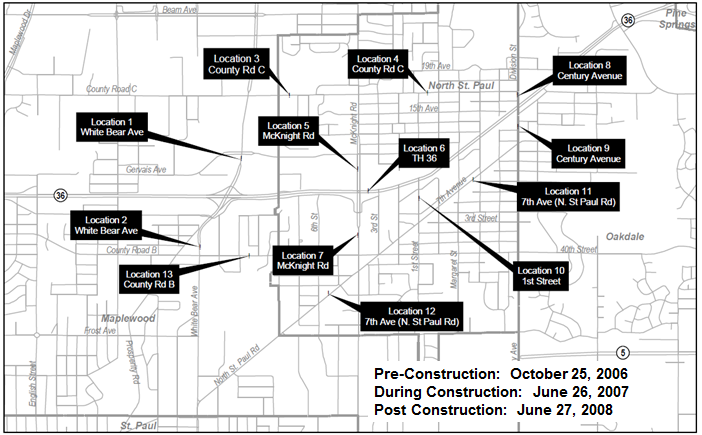
slide 24: AFTER CONSTRUCTION LOCAL TRAFFIC
slide notes:
None.
slide 25
slide notes:
None.
slide 26
slide notes:
None.
slide 27: Local Trips Summary
- Slight decrease in local trips
- Increase in trips on TH 36 due to improvements
- 1/3 rule to local streets applied
- Heavy commercial traffic on local street – County B experienced 76 heavy commercial vehicles in peak hours and 86 heavy commercial vehicles in a day
slide notes:
None.
slide 28: TRAFFIC IMPACTS TO THE STATE TRUNK HIGHWAY SYSTEM
slide notes:
None.
slide 29: Where will the Traffic Go?
|
|
slide notes:
None.
slide 30: Planning for Detour
- Improve I-94
- Log pre-existing travel times
- Intersection Improvements
- Police Officers at 4-way Stops
slide notes:
None.
slide 31: Detours / Alternative Routes
- 694/35E Under Construction
- Minimal impact to travel times and speeds on detour routes
| Time Period | TH 36 | I-694 | I-94 | CR C | CR B | Other Routes |
|---|---|---|---|---|---|---|
| 6-10 AM | -9740 | 3120 | 2900 | 1300 | 2380 | 40 |
| 2-9 PM | -20050 | 5400 | 3650 | 2060 | 3250 | 6590 |
slide notes:
None.
slide 32: Westbound Detour AM
slide notes:
AM Detour Route was I-694 South, but 45% went north. Only 23% went south. Went through construction zone and signals versus the longer freeway option.
slide 33: Westbound Detour AM
slide notes:
Most Traffic came back to TH 36 after I-35E.
slide 34: Eastbound Detour PM
slide notes:
Traffic started diverging before the detour route. Not following the detour
slide 35: Eastbound Detour PM
slide notes:
Traffic started diverging before the detour route. Not following the detour
slide 36: Freeway / Detour Summary
- Not everyone followed the signed detours
- Preferred to deal with shorter routes even though there were construction and signal delays
- No major traffic impacts on detour routes
slide notes:
None.
slide 37: Travel Time Systems
- Goal – Provide travel times for WB TH 36 Traffic on detour routes
- Challenge – Implementing reliable data into the RTMC
slide notes:
None.
slide 38: REDUCING IMPACTS BY REDUCING CONSTRUCTION TIME
slide notes:
None.
slide 39: Accelerated Construction
|
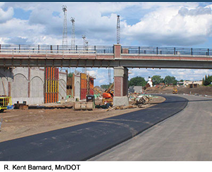 |
slide notes:
None.
slide 40: Accelerated Construction
- Lane Rental
- "No Excuse Bonus"
- Open to 1 Lane of Traffic
- 145 Days = $350,000
- Addition $75,000 for every 5 days earlier
- Capped at $650,000
slide notes:
None.
slide 41: Post Closure Market Research
- 92% Residents
- 84% Businesses
- 89% Commuters
- Faster, Safer and Lower Cost
- "Biggest non-event of the year"
slide notes:
None.
slide 42: Lessons Learned
- Early Discussion (1+ Year)
- Cost Savings ~ 15%
- Time Savings ~ 1+ Year
- Start Detour on Tuesday
- No closure during winter months
slide notes:
None.
slide 43: Moving Forward
- Closing interchanges "no big deal" anymore
- Full road closures – more receptive
- $$ is driving everything
- Tools for full closure:
- Innovative Contracting
- Very Early Coordination
- ITS Systems
- Are we utilizing full closures too much?
slide notes:
None.
slide 44: Special Thanks
Phil Forst – FHWA Minnesota
Chris Roy – Mn/DOT Area Manager
Steve Kordosky – Mn/DOT Project Manager
Questions?
slide notes:
None.
Return to List of Presentations