Data Needs, Availability, and Opportunities for Work Zone Performance Measures Webinar
March 19, 2013
Presentation
slide 1
Data Needs, Availability and Opportunities for Work Zone Performance Measures
March 19, 2013
Presenters: Jawad Paracha (FHWA), Gerald Ullman (TTI), Geza Pesti (TTI) and Rachel Klein (Battelle)
![]()
![]()
![]()
Download the Printable Version [PDF,
4.3 MB]
PDF files can be viewed with the Acrobat® Reader®.
slide 2
Webinar Structure
- Introduction (FHWA)
- Guidance Development Challenges and Process
- Structure of the Guidance Document
- Mobility Measures and Data Sources
- Q&A
- Safety Measures and Data Sources
- Q&A
- Customer Satisfaction Measures and Data Sources
- Agency/Contractor Measures and Data Sources
- Q&A
slide 3
Work Zone Performance Measures
Metrics that help to quantify how work zones impact travelers, residents, businesses and workers.
- Project-level metrics
- Agency program-level metrics
slide 4
Work Zone Performance Measurement
- Quantifying work zone impacts
- Manage work zone impacts
- Guides investment decisions
- Identify trends
- Refine policies and procedures
- Assists in public information and outreach
slide 5
Work Zone Safety and Mobility
23 CFR 630.1088(c)
- States shall use field observations, available work zone crash data, and operational information to manage work zone impacts for specific projects during implementation.
- States shall continually pursue improvement of work zone safety and mobility by analyzing work zone crash and operational data from multiple projects to improve State processes and procedures.

slide 6
Work Zone Performance Measurement Challenges
|
 |
slide 7
Guidance Development Process
- Initial list of 13 possible measurement categories
- Reduced and collated along three key dimensions
- Practitioner expert panel identified and prioritized performance measures for each category/dimension
slide 8
Performance Measure Data Needs
- Performance data
- Quantifies the amount of the effects
- Dimensions: mobility, safety, customer satisfaction, and agency/contractor productivity
- Exposure data
- Quantifies who or what was affected
- Dimensions: counts, distances traveled, durations
- Indicator data
- Specifies activities, phases, time periods, or events of interest when effects occurred
slide 9
Performance Measure Selection
Step 1. Determine performance measurement categories of interest
Step 2. Decide which work zones to measure
Step 3. Decide what work zone conditions to measure
Step 4. Determine data sources to use
Step 5. Compute specific measures of interest
slide 10
Where Can We Get Data?
- Extract it from existing sources
- Collect it (manually, electronically)
- Interpolate it from existing or collected data
slide 11
Guidance Document Structure
|
 |
slide 12
Mobility-Related Performance Measures
- Mobility impacts commonly measured as
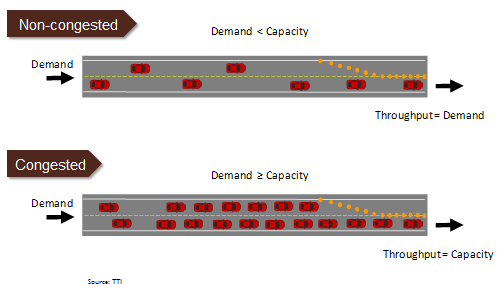
- Throughput
- Delays
- Travel times
- Travel time reliability
- Vehicle queues
slide 13
Throughput
|
 |
|
 |
slide 14
Throughput
- Potential Future Data Source
- Connected vehicle technology
To be useful, sufficient market penetration of V2V and V2I technology is needed
- Connected vehicle technology
slide 15
Throughput
slide 16
Considerations and Trade-Offs of Throughput Data Sources
| Data Source | Key Considerations and Trade-offs |
|---|---|
| All data types |
|
| TOC sensor data and toll facility usage data |
|
| ATR station data |
|
| Agency AADT estimates |
|
| Work Zone ITS data |
|
| Mechanical counters or manual counts |
|
| Manual collection of person/vehicle occupancy levels |
|
| Manual or electronic collection of pedestrian throughput |
|
| Connected vehicle data |
|
slide 17
Delay, Travel Time, Travel Time Reliability
|
 |
slide 18
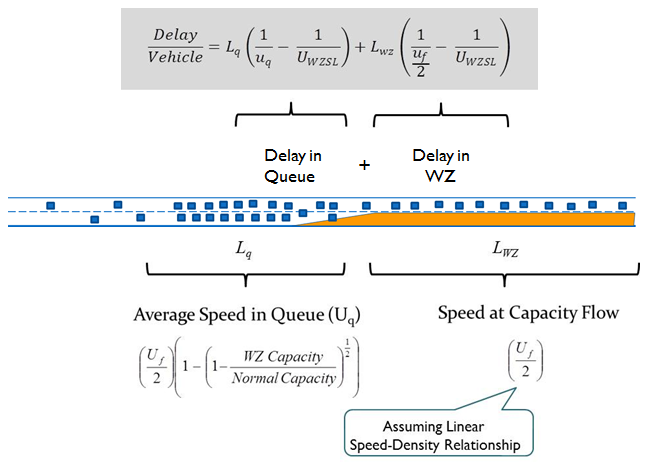
Delay Estimation from Observed Queue
slide 19
Delay, Travel Time, Travel Time Reliability
- Potential Future Data Source
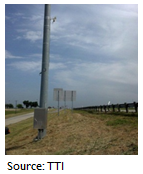
- Travel Times from Bluetooth Address Matching
- Several states (e.g., Texas, Indiana) have used anonymous matching of Bluetooth devices in vehicles to track point-to-point travel times in work zones.
- Private (3rd Party) Sources of Travel Time and Speed Data
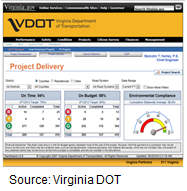
- The Virginia Department of Transportation examined the potential of obtaining historical private-sector traffic data for the purposes of computing work zone performance metrics
- Connected vehicle technology
- Travel Times from Bluetooth Address Matching
slide 20
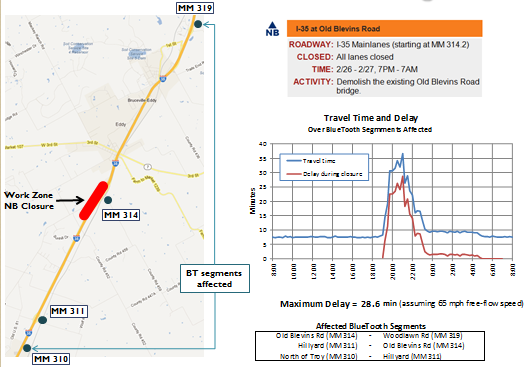
Example: Work Zone Delay Estimation from Bluetooth Address Matching
slide 21
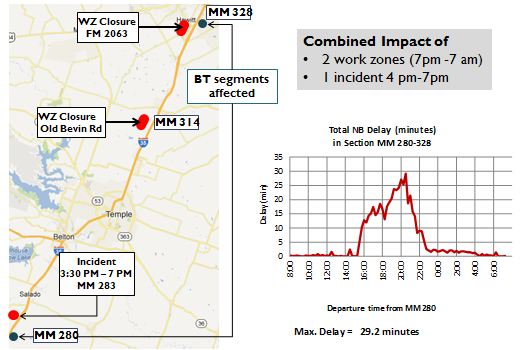
Example: Corridor Delay Estimation from Bluetooth Address Matching
slide 22
Considerations and Trade-Offs of Delay, Travel Time, and Reliability Data Sources
| Data Source | Key Considerations and Trade-offs |
|---|---|
| TOC spot speed sensor data |
|
| TOC point-to-point travel time data |
|
| Work zone ITS data |
|
| Portable point-to-point travel time data collection |
|
| Manual spot-speed data |
|
| Manual travel time data collection by driving through the work zone |
|
| 3rd party (private-sector) travel time and speed data |
|
| Bluetooth data |
|
| Connected vehicle data |
|
slide 23
Traffic Queue Data Sources
- Existing Data Sources
- Speed data extracted from a work zone ITS deployment
- Observation of queues from a permanent or work zone TOC
- Observation of queues by field personnel at the work zone
slide 24
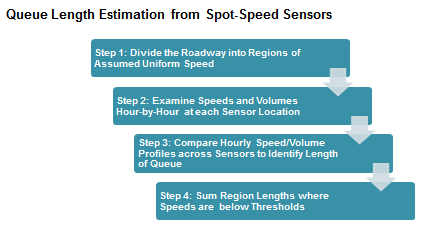
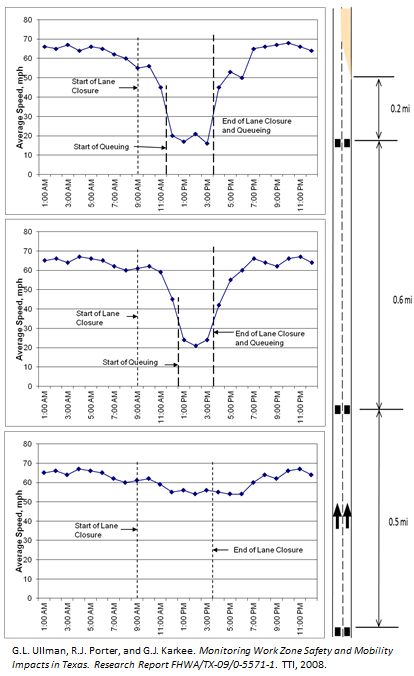
Queue Estimation
Example:
- Spot traffic sensors are located 0.2 mile, 0.8 mile, and 1.3 miles upstream of the temporary lane closure.
- Project diary information indicates that a lane closure began at 9:00 AM and ended at 3:30 PM.
| Time | Estimated Location of Upstream End of Queue | Estimated Queue Length |
|---|---|---|
| 11:00 AM | None | 0 |
| 12:00 PM | Between Sensors 1 & 2 | 0.2 + (0.6/2) = 0.5 mile |
| 1:00 PM | Between Sensors 2 & 3 | 0.2 + 0.6 + (0.5/2) = 1.05 mile |
| 2:00 PM | Between Sensors 2 & 3 | 1.05 mile |
| 3:00 PM | Between Sensors 2 & 3 | 1.05 mile |
| 4:00 PM | None | 0 |
slide 25
Traffic Queue Data Sources
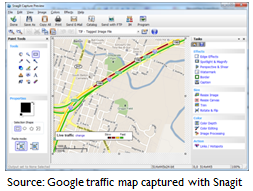
- Potential Future Data Source
- Screenshot Captures from 3rd Party Traveler Information Providers
- Private (3rd Party) Sources of Travel Time and Speed Data
- Connected vehicle technology
slide 26
Considerations and Trade-Offs of Traffic Queue Data Sources
| Data Source | Key Considerations and Trade-offs |
|---|---|
| All data types |
|
| TOC or work zone ITS data using spot speed sensors |
|
| Visual queue identification by TOC operators |
|
| Collection of queue data by field personnel |
|
| Screenshot of real-time traffic condition maps |
|
| 3rd party traveler information data |
|
| Connected vehicle data |
|
slide 27
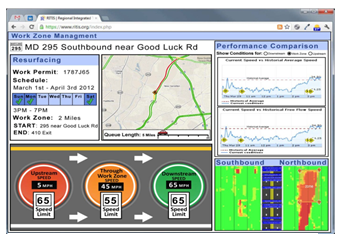
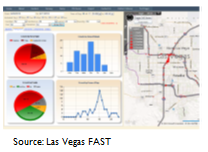
Identifying and Computing Specific Mobility Measures of Interest
Once work zone mobility-related data sources are identified, a jurisdiction will have to make its own decisions as to what performance measures it chooses to track.
- Example: In some jurisdictions with TOCs, efforts are underway to develop simple-to-use computer dashboards that can provide current traffic conditions in and around a work zone
slide 28
Q&A
slide 29
Safety-Related Performance Measures
- Safety impacts commonly measured as
- Crashes
- Safety Surrogates
- Worker Accidents
slide 30
Crashes
|
 |
slide 31
Considerations and Key Trade-offs
| Data Source | Key Considerations and Trade-offs |
|---|---|
| Statewide Crash Records Database |
|
| Electronic or hard copy crash report forms |
|
| TOC operator incident logs |
|
| Dispatch Logs of Emergency Response or Service Patrols |
|
| Agency-collected crash and work zone database |
|
| Connected vehicle data |
|
slide 32
Safety Surrogates
|
 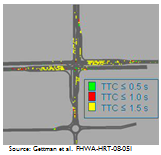
|
slide 33
Considerations and Key Trade-offs
| Data Source | Key Considerations and Trade-offs |
|---|---|
| All data types |
|
| TOC or work zone ITS speed sensor data |
|
| Speed data collected with hand-held radar or lidar |
|
| Travel times through the work zone |
|
| Videotaped traffic behavior |
|
| Work zone inspection scores |
|
| Traffic simulation output (analyzed with SSAM) |
|
| Connected vehicle data |
|
slide 34
Worker Accidents
- Existing Agency Data Sources
- Agency or contractor worker injury records
- State worker compensation commission accident statistics
- Bureau of Labor statistics database
- Future Sources
- Connected vehicle initiative data
slide 35
Key Considerations and Trade-offs
| Data Source | Key Considerations and Trade-offs |
|---|---|
| Agency or contractor worker injury records |
|
| State worker compensation commission statistics |
|
| BLS, OSHA worker accident statistics |
|
| Agency-collected work zone crash and accident database |
|
slide 36
Identifying/Computing High Priority Safety Measures
- Change in crash frequency (by type)
- Change in crash rate per vehicle-miles-traveled (for a given time period)
- Compliance with work zone speed limit
- Speed variance at a location
- Frequency of worker accidents
- Worker injury rate per hours worked
- Injury type, severity, contributing factor distributions
slide 37
Example: Tracking Crash Frequency Trends at a Work Zone
- Work zone on roadway that normally experiences 5 crashes per month
- Have had 7, 3, 10, 7 crashes in past 4 months during work zone
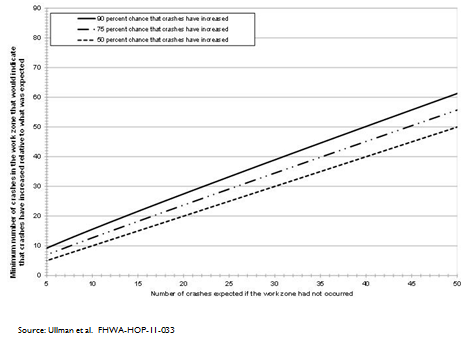
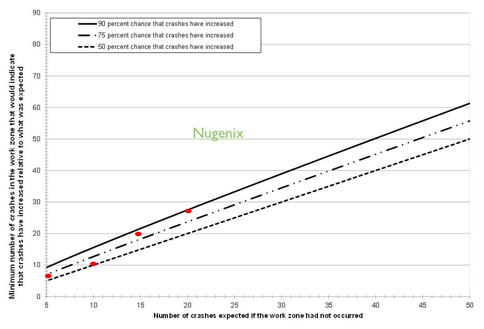
slide 38
Example: Tracking Crash Frequency Trends at a Work Zone
slide 39
Q&A
slide 40
Customer Satisfaction Performance Measures
- Who are our customers?
- Travelers, residents, and businesses
- Impact of Work Zones?
- Delays, congestion, and inconveniences are challenging for maintaining good relationships with customers
- Why are measures necessary?
- Infrastructure is largely publicly-owned and funded
Therefore...
Measuring customer satisfaction associated with work zones is critical to an agency's or contractor's set of work zone performance measures
slide 41
Existing Customer Satisfaction Data Sources (1 of 3)
- Focus Group Transcripts
- Participants opinions, experiences, and suggestions
- Not representative of overall driving population
- Anecdotal findings
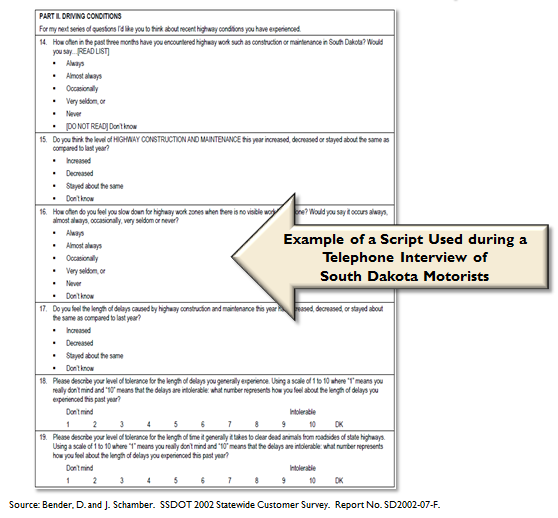
- In-Person or Telephone Interview Responses
- Responses may vary at location over time
- In-person interviews require short surveys
- Fairly labor intensive to administer
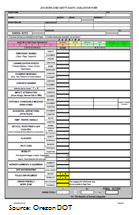
slide 42
Customer Satisfaction Data Example
slide 43
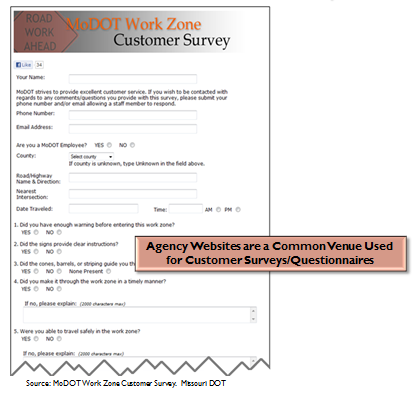
Existing Customer Satisfaction Data Sources (2 of 3)
- Mail, Email, or Website Survey Responses
- Quantitative statistical analysis
- Qualitative assessments
- Predetermined options
- Statistically significant findings
- High cost
- Slight negative bias
slide 44
Customer Satisfaction Data Example
slide 45
Existing Customer Satisfaction Data Sources (3 of 3)
- Customer complaint database entries
- Databases track complaint arrivals and disposition
- Some complaints easily associated with a work zone
- Some complaints may be more indirect
- Complaints effective for identifying operational or safety problems
- Not indicative of overall driver satisfaction
- Small sample sizes
Travelers, residents, or nearby businesses may embellish conditions somewhat when making a work zone-related complaint Those who are not unhappy generally do not contact the agency to indicate their general satisfaction |
slide 46
Future Customer Satisfaction Data Sources
|
 |
|
 |
slide 47
Considerations and Trade-Offs of Customer Satisfaction Data Sources
| Data Source | Key Considerations and Trade-Offs |
|---|---|
| Focus groups |
|
| One-on-One Interviews |
|
| Surveys/ Questionnaires |
|
| Complaints |
|
| Social Media Uses |
|
| On-Line Focus Groups |
|
slide 48
Identifying/Computing High Priority Customer Satisfaction Measures
- Ratings of the quality of work zone features seen while driving through a work zone
- Signs
- Information provided regarding delays, queues, work activities
- Satisfaction ratings with travel conditions through multiple work zones
- Multiple work zones
- Corridor in a region or network
- Frequency/rate of complaints
- Satisfaction ratings for traveling through work zone
slide 49
Agency/Contractor Productivity Performance Measures
|
 |
|
 |
slide 50
Key Considerations and Trade-Offs
| Data Source | Key Considerations and Trade-offs |
|---|---|
| Construction management system databases |
|
| Lane closure request and approval databases |
|
| Daily project diaries |
|
| Mobile applications for project activity entry |
|
| Maintenance management system databases |
|
slide 51
Identifying/Computing High Priority Agency/Contractor Productivity and Efficiency Performance Measures
- % of allowable or total days worked
- % of lane closure hours occurring outside of allowable "work windows"
- Production rates
slide 52
Resources
- Guidance on Data Needs, Availability, and Opportunities for Work Zone Performance Measures
- A Primer on Work Zone Safety and Mobility Performance Measurement
- Work Zone Performance Measures Pilot Test
- Domestic Scan on Work Zone Assessment, Data Collection, and Performance Measurement
Available at http://www.ops.fhwa.dot.gov/wz/decision_support/performance-development.htm
slide 53