Results and Discussion
This section presents the results of the 2006 WZSA. Results from the 2005 WZSA are also included for comparative purposes. Most agencies reported an increase in their overall WZ SA score between 2005 and 2006. The average score increased for 32 of 46 agencies (70%), decreased for 4 of 46 agencies (9%), and remained the same for 10 of 46 agencies (22%).[1] Table 3 shows the changes in average agency scores from 2005 to 2006.
| Score Change | Agencies | Percent of Agencies |
|---|---|---|
Increased by 10% or more |
9 |
20% |
Increased 6% to 10% |
10 |
22% |
Increased 1% to 5% |
13 |
28% |
No Change |
10 |
22% |
Decreased |
4 |
9% |
Total |
46 |
100% |
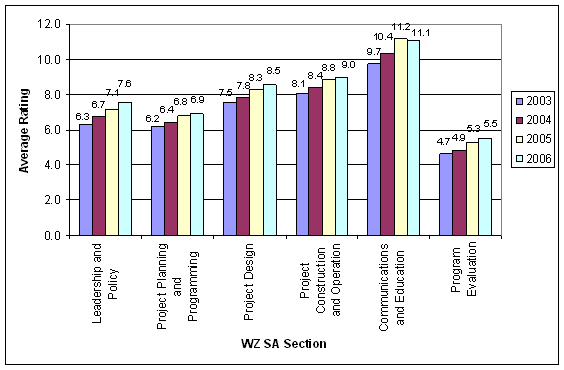
Table 4 shows the average ratings for each of the six sections and compares the 2006 results with the 2005 average ratings. The data from Table 4 show that the highest average ratings were assigned to Section 5 (Communications and Education), and Section 4 (Project Construction and Operation). The lowest average rating was assigned to Section 6 (Program Evaluation). This is consistent with the results of the 2005 WZ SA. Between 2005 and 2006, Section 1 (Leadership and Policy) and Section 6 (Program Evaluation) had the highest average rating increase (6% and 5%, respectively). A slight decrease (-1%) in the average from 2005 to 2006 was observed in Section 5 (Communications and Education).
| Section | # of Questions | 2005 | 2006 | Change | % Change |
|---|---|---|---|---|---|
1. Leadership and Policy |
10 |
7.1 |
7.6 |
0.5 |
6% |
2. Project Planning and Programming |
6 |
6.8 |
6.9 |
0.1 |
2% |
3. Project Design |
12 |
8.3 |
8.5 |
0.2 |
3% |
4. Project Construction and Operation |
9 |
8.8 |
9.0 |
0.2 |
2% |
5. Communications and Education |
5 |
11.2 |
11.1 |
-0.1 |
-1% |
6. Program Evaluation |
4 |
5.3 |
5.5 |
0.2 |
5% |
Overall |
46 |
8.2 |
8.4 |
0.2 |
2% |
Figure 1 shows the national average section ratings for each of the four years the WZ SA has been conducted.
Figure 1. National Average Section Ratings by Year 2003 to 2006
The remainder of this section presents the results at a more detailed level. For each section of the WZ SA, the information includes:
- An explanation of the intent of the section,
- The questions asked in that section,
- National average ratings for each question and comparative data from the 2005 WZ SA, and
- A question-by-question discussion of the scores, including the percentage of agencies rating themselves at 7 or higher (meaning they are implementing the practice asked about in the question), and a summary of comments included by respondents in the results they submitted.[3]
Many responders provided comments for some questions, while some did not submit any comments. The responders that provided comments offer helpful examples of some of the specific practices and efforts being done to make work zones work better.
Another rich source of examples is the series of implementation guides published by FHWA to provide guidance to transportation agencies as they implement the updated work zone regulations of 23 CFR 630 Subpart J (the Work Zone Safety and Mobility Rule). The Guides contain many good examples of state DOT practices in use and provides references to many helpful informational resources. The first guide in the series is the overall implementation guide, “Implementing the Rule on Work Zone Safety and Mobility,” which was published by FHWA in 2005. Three companion technical guides address specific related topics: “Work Zone Public Information and Outreach Strategies,” “Developing and Implementing Transportation Management Plans for Work Zones,” and “Work Zone Impacts Assessment: An Approach to Assess and Manage Work Zone Safety and Mobility Impacts of Road Projects.” The Guides, as well as other information on the updated Rule, are available from the FHWA Work Zone Program website at http://www.ops.fhwa.dot.gov/wz/resources/final_rule.htm. The website also contains a list of work zone publications, studies, links, and training resources. Additionally, hard copies of the Guides can be obtained by sending an email with the title(s), number of guides requested, and shipping information to WorkZoneFeedback@dot.gov.
- The 2005 sample size was 48 reporting out of 52 total Divisions, and the 2006 sample size was 50 of 52. The sample size for comparison between 2005 and 2006 is 46 of 52, as results for 6 different agencies were not available for direct comparison over the two year period.
- Numbers in this table and other tables in this report may not calculate exactly due to rounding. Non-rounded values were used in the calculations.
- The percentage of agencies implementing a practice (i.e., rating themselves at 7 or higher) is based on the 50 Divisions submitting scores for 2006.