Leadership and Policy
Agency leadership support should drive overall policy making for the agency. This support fosters an environment conducive to developing an effective work zone program. Project planning, design, and construction and maintenance activities should all incorporate work zone mobility and safety impacts and mitigation strategies. Agency management should facilitate and encourage a multidisciplinary approach to traffic management throughout all phases in the life of a project. Senior managers should be personally, visibly, and proactively involved in efforts to minimize work zone delays and enhance the safety of the motorist and workers in work zones.
Goals provide high-level direction and establish expectations for agency staff. Clear and specific goal statements such as “Reduce congestion and delay in work zones by 10% in 5 years” establish a basis on which to develop strategies and actions. Use of performance measures helps to assess progress toward fulfillment of a goal. For example, to track progress toward reduction of work zone delays, an agency may gather information regarding the total vehicle hours of delay in work zones and track these values over time.
Figure 2 shows the average rating by question for 2005 and 2006 for the Leadership and Policy section. Table 5 shows the actual values along with the percent change from 2005 to 2006 for each question. The average ratings increased for a majority of the questions in this section. For 2006, most of the questions had a national average score of 7.0 or greater, indicating that, on average, agencies are implementing the practices covered in this section. Only the national averages for questions 1, 4, and 10 are below the implementation threshold.
Figure 2. Results for Leadership and Policy Section
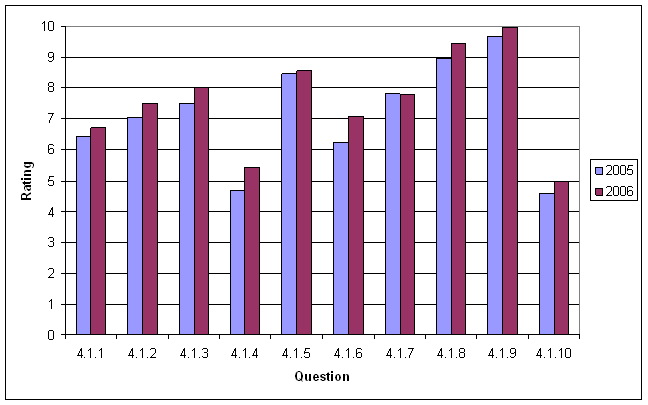
| Section | 2006 | 2005 | Change | % Change |
|---|---|---|---|---|
4.1.1 |
6.7 |
6.4 |
0.3 |
5% |
4.1.2 |
7.5 |
7.0 |
0.5 |
7% |
4.1.3 |
8.0 |
7.5 |
0.5 |
7% |
4.1.4 |
5.4 |
4.7 |
0.7 |
15% |
4.1.5 |
8.6 |
8.5 |
0.1 |
1% |
4.1.6 |
7.1 |
6.2 |
0.9 |
15% |
4.1.7 |
7.8 |
7.8 |
0 |
0% |
4.1.8 |
9.4 |
9.0 |
0.5 |
5% |
4.1.9 |
10.0 |
9.7 |
0.3 |
3% |
4.1.10 |
5.0 |
4.6 |
0.4 |
9% |
Questions 4 and 6 in this section increased substantially (15%) from 2005 to 2006. Both questions may have increased due to the impending deadline for compliance with the Work Zone Safety and Mobility Rule (Work Zone Rule). Question 6 may also have increased due to the continued FHWA focus on promotion of Transportation Management Plans as a tool to reduce work zone impacts.
4.1.1 Has the agency developed a process to determine whether a project is impact type I, II, III, or IV? Forty-six percent of the agencies have developed a process to determine the impact type of projects. These processes are located in a standard policy or sometimes done as an informal process during the construction phase. One agency noted a general process and explained that considerations to determine the project classification include the project size, complexity, construction time, and overall level of traffic volume expected. Another agency noted using a general project-by-project review process to determine what types of mitigation strategies may be needed for each project. Another agency recently developed a draft memorandum that contains a process for determining a project's impact to traffic. Another agency said that a new chapter in their design manual will have a three tiered approach in place to determine project impact type. Some agencies mentioned greater use of a project classification process due to the requirements of the Work Zone Rule.
4.1.2 Has the agency established strategic goals specifically to reduce congestion and delays in work zones? Over half (60%) the responding agencies indicated that they have strategic goals to reduce work zone congestion and delays. Goals to reduce congestion and delays in work zones are supported by practices such as the use of QuickZone (a queue analysis spreadsheet for work zones), ITS technologies, and lane closure policies that minimize closures during peak periods. One agency reported that they have established a goal of no more than 20 minutes of stopped delay and 30 minutes of total delay through certain projects. Another agency reported development of a Strategic Highway Safety Plan (SHSP) that addresses strategies to reduce congestion and delay in work zones, thereby increasing safety performance by reducing stop-and-go conditions that contribute to crashes. The same agency reported inclusion of congestion and delay goals in their project level Transportation Management Plans (TMPs). One agency has established strategic goal areas that include reliability (reducing delays due to work zones and incidents). Related to this goal area, the agency has begun a process of evaluating the causes and possible solutions for congestion at the end of queues upstream of work zones.
4.1.3 Has the agency established strategic goals specifically to reduce crashes in work zones? Out of 50 reporting agencies, over half of them (60%) have strategic goals specifically to reduce crashes in work zones. Many agencies commented that they have a specific goal to reduce work zone crashes and work zone fatalities by a certain percentage (often 10%). Some agencies reported pursuing a goal of zero fatalities in work zones. One agency noted establishment of a work zone fatal crash team that makes recommendations for implementation of safety strategies on appropriate projects. Another agency noted the use of a process to review the accuracy of crash data and recording techniques for contributing factors for work zone crashes. One agency has established strategic goal areas that include safety (to have the best work zone safety record in the nation) and reliability (reducing delays due to work zones and incidents). Related to these goals, the agency has begun a process of evaluating the causes and possible solutions for congestion at the end of queues upstream of work zones, which may lead to a reduction in end-of-queue crashes. The agency has established a committee to evaluate recommendations on how to reduce collisions, including monitoring through enhanced enforcement and possible monitoring by contractors.
4.1.4 Has the agency established measures (e.g., vehicle throughput or queue length) to track work zone congestion and delay? Although only 34% of the states are implementing measures to track work zone congestion and delay, the average score for this item increased from 4.7 to 5.4 (15%) between 2005 and 2006. The overall increase in average score is attributed to increased ratings from 15 agencies (with particularly strong increases in 3 agencies), while almost all of the other agencies’ ratings did not change. This result indicates that a number of agencies are placing more emphasis on this area. Queue lengths and travel time variability are the most common measures used to track work zone delay. Some agencies reported they have established maximum thresholds such as 15 minutes of delay or a one-mile maximum queue length. Additionally, some states noted use of technology to monitor performance and display information to the public in real-time (e.g., travel time through the work zone). One agency cited a large reduction in delay through implementation of lane closure policies and use of analysis tools in development of maintenance of traffic plans. Another agency noted that corridor operations must meet certain mobility thresholds, with the focus having shifted from specific project analysis to managing the entire system. The agency also noted that design build projects have requirements to measure queue lengths and the number of open lanes by time period.
4.1.5 Has the agency established measures (e.g., crash rates) to track work zone crashes? Thirty-five agencies (70%) have established measures to track work zone crashes. Strategies mentioned by respondents include coordinating with law enforcement personnel to improve reporting on work zone crashes and timely analysis of work zone crash data by project engineers. One state noted the need for better accuracy and detail in work zone crash reporting, while another cited the potential for using construction inspector diaries to analyze information on crashes.
4.1.6 Has the agency established a policy for the development of Transportation Management Plans to reduce work zone congestion and crashes? More than half (54%) of the states are implementing a policy for the development of Transportation Management Plans (TMPs) to reduce work zone congestion and crashes. The average score for this item increased by 15%, which may be due to the approaching compliance date (October 2007) of the Work Zone Rule, which requires TMPs for all projects. The significant increase for this question is due to increased ratings from 15 agencies, with half of these agencies showing large increases. Only 3 states decreased their scores. One agency cited that, while the process is not yet officially referred to as a TMP, they review project plans to determine what methods and procedures would have the least impact to the public. At the beginning stages of project development, the agency determines how the information will be distributed to the public based on the potential impacts. One agency cited use of components of a TMP including review of alternatives for traffic control to enhance effectiveness in the field. One agency noted a new chapter on TMPs in their design manual.
4.1.7 Has the agency established work zone performance guidance that addresses maximum queue lengths, the number of open lanes, maximum traveler delay, etc.? Standards for work zone performance guidance have been established in 33 agencies (66%). Several agencies reported consideration of work zone performance in the design stage, where traffic models are used to predict the performance of a particular traffic control plan and determine the appropriate timing of lane closures. One agency noted analysis of traffic volumes and available alternate routes to determine maximum queue lengths. Another agency noted use of a Road User Cost Manual and a Traffic Impact Report to predict work zone performance.
4.1.8 Has the agency established criteria to support the use of project execution strategies (e.g., nightwork, full closures) to reduce public exposure to work zones and reduce the duration of work zones? Forty-one agencies (82%) have established criteria to support the use of project execution strategies. Many agencies reported wide use of nighttime construction, especially on the interstate system and in high traffic volume locations. One agency reported restricting calendar finish dates to minimize overall public exposure. Agencies also cited the use of alternative contracting techniques and full road closure to reduce public exposure to work zones.
4.1.9 Has the agency developed policies to support the use of innovative contracting strategies to reduce contract performance periods? Of 50 reporting agencies, 44 of them (88%) have developed policies to support the use of innovative contracting strategies to reduce contract performance periods. Strategies used include A+B bidding, design-build, lane rental, and incentives/disincentives on major projects. Some agencies noted legislative and contracting regulation limitations in the use of certain strategies.
4.1.10 Has the agency established Memoranda of Understanding (MOU) between utility suppliers to promote the proactive coordination of long-range transportation plans with long-range utility plans, with the goal of reducing project delays and minimizing the number of work zones on the highway? Only 15 agencies (30%) have established an MOU between utility suppliers to promote the proactive coordination of long range transportation plans with long-range utility plans. One agency said that while it does not have formal MOUs with utilities, the agency does coordinate heavily and well in advance with them to minimize impacts. The same agency is developing a committee to enhance coordination on projects. One agency noted the use of master agreements with every major utility company and information sharing on planned projects for enhanced coordination of utility work. Several agencies have no policy to develop an MOU. Some agencies work informally to coordinate between the transportation agency and the utility companies, such as through monthly coordination meetings. One agency noted that this is done on a project-by-project basis, rather than program wide, since issues are typically project-specific.
previous | next