Task Order 5.2
Benefits Analysis for the Georgia Department of Transportation NaviGAtor Program
Final Report
Executive Summary
In the last several years, there has been a national focus on the reporting of benefits for Intelligent Transportation Systems (ITS). Agency management, as well as system planners and operators, need to determine the return on investment for ITS implementation to determine how to invest future transportation funds.
This report establishes a methodology to assess the various benefits of the Georgia NaviGAtor Intelligent Transportation System and reveals the resulting annual benefits upon implementation of the methodology. A previous study entitled “Calculating Benefits for NaviGAtor–Georgia’s Intelligent Transportation System” was prepared in September 1998. It documented a 23-minute reduction in incident duration during 1997 associated with NaviGAtor, resulting in cost savings of $44.6 million due to reduced delay time. However, this study did not take into consideration savings in fuel consumption, effects on air quality, or the benefits of the Highway Emergency Response Operator (HERO) motorist assistance service. The 1998 study also included a number of assumptions that could potentially be eliminated by incorporating more discrete parameters and augmenting the level of detail of the data analysis.
This report describes a new benefits methodology that minimizes the number of assumptions and includes an analysis of additional benefits that are obtained from the NaviGAtor system pertaining to the incident management program. While additional benefits related to reduced fuel consumption, improved air quality, reduced secondary crashes, and motorist assistance attributable to the NaviGAtor incident management program are incorporated in this analysis, this study does not quantify all of the benefits pertaining to the NaviGAtor system.
The real and substantial benefits associated with the NaviGAtor Advanced Traveler Information System (ATIS) including the public website, Changeable Message Signs (CMS) and *DOT service are difficult to quantify, and are not included in this report. While NaviGAtor’s CMSs have assisted in the successful conclusion to numerous Amber Alerts and thousands of travelers alter there commutes daily based upon information received from the CMSs, website, and *DOT services, these resulting benefits were not determined in this analysis. The benefits associated with the NaviGAtor Hurricane Evacuation system, Freeway Ramp Metering system, and the Macon and local county Transportation Management Centers were also excluded from the study.
The following is a synopsis of the annual benefits derived from the NaviGAtor system’s incident management program between May 2003 and April 2004:
| Mobility | 7,254,495 vehicle-hours of incident-delay savings |
| Environmental | 186.27 tons of Hydrocarbon (HC) emissions reduced. 2,457.01 tons of Carbon Monoxide (CO) emissions reduced. 261.63 tons of Nitrous Oxide (NOx) emissions reduced. 5,172,455 gallons of gasoline and, 1,658,170 gallons of diesel fuel consumption reduced. |
| Customer Satisfaction | 49,051 motorist assists provided to travelers. |
| Safety | 466 secondary crashes reduced. |
| Cost savings | $187,228,535 (see table below for individual items). |
The annual benefit/cost ratio of the NaviGAtor system in 2003/2004 was calculated to be 4.4:1 ($186.8M/$42.5M). Given this relatively high benefit/cost ratio and the numerous and substantial public benefits mentioned above, future expansion and enhancement of the NaviGAtor system are recommended.
Benefit Measure |
Cost Savings |
|---|---|
Mobility – incident delay savings |
$152,053,180 |
Environmental – reduced emissions |
$20,243,009 |
Environmental – reduced fuel consumption |
$10,365,969 |
Safety – reduced secondary crashes |
$1,611,054 |
Customer Satisfaction – motorist assistance |
$2,955,323 |
Total |
$187,228,535 |
1.0 Introduction
This report establishes a method to assess the benefits of the Georgia Department of Transportation (GDOT) NaviGAtor Intelligent Transportation System (ITS). The report provides a review of a previous NaviGAtor benefits study, discusses the shortcomings in the previous study, and describes methods for updating and supplementing the NaviGAtor benefits analysis. This report identifies additional benefits attributable to NaviGAtor’s incident management program and is not an all encompassing analysis of every benefit derived from the NaviGAtor system.
1.1 Background
The Georgia NaviGAtor system is a highly integrated transportation management system that uses a variety of technologies and processes to monitor the operation of the freeway and arterial system, respond to a variety of incidents, and disseminate traveler information. The goal of NaviGAtor is to reduce traffic congestion caused by both traffic incidents as well as secondary crashes that result from congestion caused by primary incidents, and to improve overall highway efficiency for the motoring public. This goal is reflected in the Transportation Management Center’s (TMC) mission statement:
The Transportation Management Center is committed to enhancing travel safety and transportation efficiency by managing incidents, controlling traffic, and providing accurate information to the traveling public.
At the center of the NaviGAtor system is the TMC. From the TMC, GDOT manages a number of strategies to achieve the goal of reduced traffic congestion. At the forefront of these strategies is a Freeway Management and Advanced Traveler Information System that is used to collect current traffic information, manage incidents, and disseminate information to travelers and the news media. Current traffic information is collected through an array of Closed Circuit Television (CCTV) cameras and Vehicle Detection System (VDS) cameras that cover about 155 (140 in 2003-2004) centerline miles of Atlanta’s freeway system. The VDS is capable of gathering lane-by-lane volume, speed and occupancy (density) data, and communicating the data to the TMC every 20 seconds. These data are used to populate a real-time Geographic Information System ( GIS) map to depict the current conditions on the freeway system and to provide travel time information for the public website and Changeable Message Signs ( CMS).
TMC operators use the information received from these surveillance devices to quickly identify and respond to incidents as they appear on the system. These incidents could be of a low effect, such as a stranded motorist on the shoulder of the roadway. Other incidents may have a high impact, such as a multi-vehicle incident blocking a number of lanes. In either case, the incident has an effect on freeway capacity, and a quick response by traffic incident responders allows the transportation system to return to normal as soon as possible.
Once a TMC operator identifies an incident, there are a number of potential responses, depending on the severity of the incident. In almost all cases on an assigned route, a HERO is dispatched to the scene to provide assistance. For a stranded motorist, this assistance may come in the form of providing fuel or changing a tire so that the motorist can resume travel as soon as possible. In the case of a crash, the HERO attempts to move the vehicle(s) out of the travel lane. If moving the vehicles is not feasible, traffic control is provided until the proper authorities arrive and clear the scene.
The TMC also responds to incidents by providing information to travelers and the news media by several means. For pre-trip information, NaviGAtor provides a website that contains real-time traveler information and includes a list and location of current incidents, a real-time map of travel speeds, and access to CCTV camera views throughout the system. This website, www.georgia-navigator.com, is used by both travelers and news media outlets. At the TMC, GDOT also staffs a 24-hour/7-day call center that provides real-time information to travelers. By calling *DOT on a cellular phone, or 404-635-8000 by landline, a live operator can provide information on current traffic conditions. This information enables pre-trip planners to avoid heavily congested routes or use alternate modes, such as transit. The *DOT service is also available to provide in-route traveler information to assist travelers in either altering their routing in response to congestion encountered during the trip, or having more piece of mind about the reason for the congestion.
Larger numbers of travelers are assisted by CMSs strategically placed throughout the system to alert travelers of incidents in their travel route so that they may take an alternate route, if possible.
1.2 Previous Benefits Documentation
In 1998, GDOT conducted an internal study in an attempt to quantify the benefits of the NaviGAtor system. This study was limited to an evaluation of the reduction in the duration of incidents as a result of reduced incident response and clearance times. The improved response times resulted from quicker detection of the incidents through the NaviGAtor surveillance system and through the roving HERO patrols. The reduced clearance time resulted from the ability of the HEROs to clear many incidents from the travel lanes without the assistance of public safety or GDOT maintenance forces. No other factors were considered.
1.3 Purpose of This Study
The primary objective of this current study is to improve the benefits methodology and update the results of the 1998 study. In doing so, the methodology for the calculation of delay reduction has been modified. The key to improving the methodology was to reduce as many assumptions in the calculation as possible because this was recognized as the greatest shortcoming of the way delay was determined in the 1998 study. The most important improvement in the new methodology comes from the fact that the delay resulting from each incident that NaviGAtor manages is now evaluated based on its individual characteristics, not on a set of assumptions. This study attempts to eliminate assumptions related to the incident timeline of events, the incident type and severity, and when and where an incident occurs. Since these assumptions were eliminated, the value for the delay calculation for NaviGAtor incidents is considerably more accurate.
The second improvement in this current study is to evaluate additional benefits attributable to the NaviGAtor system incident management program. The following is a list of new benefits evaluated in this study:
- Cost savings due to secondary crash reduction.
- Cost savings due to assistance to travelers.
- Reduction of emissions.
- Reduction in fuel consumption.
- Customer satisfaction .
By improving the delay calculation methodology and evaluating previously uncalculated benefit measurements, this study gives a more accurate representation of the total benefit resulting from the NaviGAtor system incident management program. Due to the various challenges associated with determining the benefits attributable to the NaviGAtor ATIS, these benefits were not included in this study.
1.4 Documentation Review
In the preparation of this analysis, previous studies were reviewed that dealt with the topic of calculating the benefits of ITS. The purpose of the literature review was to understand which benefits have been studied, how they were being calculated, and what magnitude the studied benefits had on the final results. This information was applied to the NaviGAtor system to determine if the methodologies that were previously used could be applied to this study. This exercise helped to establish and develop many of the measurable benefits chosen for evaluation in this study. While these studies were informative, they did not provide a clear methodology for determining benefits for this study because the NaviGAtor system contains a unique set of components and available data. Thus, a new set of methodologies were developed specifically for the NaviGAtor system.
1.5 Report Organization
The first chapter of this report briefly discusses the history of the NaviGAtor system that was initially deployed prior to the 1996 Summer Olympic Games and has expanded to cover over half the freeway miles in Metro Atlanta. This chapter also describes the benefits study, "Calculating Benefits for NaviGAtor," conducted in September 1998 and provides the results associated with the literature review.
The second chapter discusses the selection process for identifying the specific benefits and performance measures associated with the NaviGAtor system based upon United States Department of Transportation's (USDOT) "Few Good Measures."
The third chapter describes the methodology for calculation of these performance measures, and the formulae and calculation steps necessary to compute the performance measures are included.
The fourth and fifth chapters reveal the data collection requirements and methodology implementation process specifically relating to the NaviGAtor system and its archived databases.
Finally, the remaining chapters provide the results, conclusions, and recommendations that were identified as a result of conducting this benefits analysis.
2.0 Definition Of Benefits
The objective of this section of the report is to identify the benefits of the current NaviGAtor system. This is accomplished by expanding the scope of the 1998 study to include benefits of the NaviGAtor system that were not previously calculated.
2.1 Benefits Identification
Many types of benefits from freeway management have been postulated in various studies and documents, with benefits claimed in reduced travel time, lives saved and costs avoided, and environmental effects mitigated. For this effort, a proposed list of measurable benefits based on the "Few Good Measures" set forth by the USDOT for ITS benefit evaluation1 was defined. The USDOT Joint Program Office established these "Few Good Measures" to assist in tracking progress toward meeting ITS program goals. These program goals include improving mobility, safety, throughput, customer satisfaction, energy and environment, and productivity/cost savings.
From these goals, the following table of potential measurable benefits was developed.
Table C.1 Initial Set of Considered Benefit Measures
ITS Program Area Goals |
USDOT “Few Good Measures”
|
|---|---|
Mobility |
|
Safety |
|
Capacity/Throughput |
|
Customer Satisfaction |
|
Energy and Environment |
|
Productivity/Cost Savings |
|
The six program area goals come directly from the guidelines set forth by the USDOT for ITS benefit evaluations. The MOEs were chosen based on their potential to provide valid information regarding the benefits of the NaviGAtor system.
Using the high-level program goal areas defined by USDOT, each of the MOEs was associated with specific benefits that can be attributed to the NaviGAtor system. A brief description of the benefits is provided in the following subsections.
2.2 Benefits Definitions
Reduction in Travel Time and Delay is measured by a reduction in the average trip travel time. Average travel time is directly impacted by congestion delay for travelers on the highway network. A reduction in delay, and thereby a reduction in the average travel time, is typically the greatest potential savings that can be provided to the public by ITS.
Reduction in Travel Time Variation is measured by calculating the travel time on NaviGAtor roadway segments and comparing them over time to determine how much variation occurs. The goal of this benefit is to show that NaviGAtor decreases this variability and increases travel time reliability.
Reduction of Crash Rate is measured by the total number of crashes per year in the NaviGAtor coverage area. The desired outcome from NaviGAtor is a reduction in the overall crash rate.
Increase in Throughput is the number of vehicles that are able to pass a point in a given amount of time. It is typically the traditional traffic volume but is bounded by the highway capacity. The goal is to maximize throughput.
Improved Level of Service is based on the Highway Capacity analysis and is a measure of customer satisfaction for travelers.
Improved Survey Responses (results of a traveler survey conducted by the Schapiro Research Group under the TMC Support Contract) are used in this study to identify customer satisfaction.
Reduction of Emissions is measured by quantifying at a high level the reduction of emissions of Carbon Monoxide (CO), Hydrocarbon (HC) and Nitrous Oxides (NOx) emitted as a result of congestion.
Reduction in Fuel Consumption is measured by quantifying at a high level the decrease in the excess fuel expended as a result of congestion.
2.3 Cost Savings
Money Saved due to Delay Reduction is measured as the dollar amount associated with the reduction in travel time (delay) benefit described above. It is used to justify the cost of an ITS. The dollar savings are relatively easy to calculate once reduction in travel time (delay) has been calculated.
Money Saved due to Secondary Crash Reduction is measured as the cost savings that result from a decrease in secondary crashes due to the NaviGAtor system. The probability of a secondary crash occurring increases as the primary incident remains in the flow of traffic. NaviGAtor’s incident management system is able to reduce this probability by decreasing the incident duration.
Money Saved due to Reduced Emissions is measured by associating a cost savings with the reduction in emissions that can be attributed to the NaviGAtor system. The benefit can be calculated after the reduction in emissions has been determined.
Money Saved due to Reduced Fuel Consumption is measured by associating a cost savings with the reduction in fuel consumption that can be attributed to the NaviGAtor system. This benefit can be calculated after the reduction in fuel consumption has been determined.
Money Saved due to Motorist Assistance is measured by associating a cost value with the different types of assistance HEROs provide to stranded motorists. The goal of this benefit is to establish the value of the assistance and calculate the overall savings that result from the assistance.
2.4 Benefits Selection
2.4 Benefits selection The data availability and complexity associated with the computation of the above-described benefits were studied and a decision was made to concentrate efforts on those measures that could be reasonably quantified based upon the available data. Table C.2 summarizes the benefits and defines the method of measurement as either quantitative or qualitative.
Table C.2 Selected Benefit Measures
ITS Program Area Goals |
Benefit Measures |
Quantitative |
Qualitative |
Not Included In Study |
|---|---|---|---|---|
Mobility |
|
√
|
|
√ |
Safety |
|
|
√ |
|
Capacity/Throughput |
|
|
|
√ |
Customer Satisfaction |
|
|
√ |
√
|
Energy and Environment |
|
√ √ |
|
|
Productivity/Cost Savings |
|
√ √ √ √
√ |
|
|
3.0 Methodology
This section of the report provides a detailed explanation of each proposed benefit and a methodology for calculating the benefit. During the course of the description, both the "before," or baseline conditions, and the "after," or NaviGAtor conditions, are described. The baseline conditions represent the lack of NaviGAtor's incident management system or the lack of an incident-management system response. The NaviGAtor conditions represent the current deployment of NaviGAtor's incident management system. The benefits derived from the NaviGAtor system can be determined by comparing the baseline "before" conditions with the NaviGAtor "after" conditions.
3.1 Mobility
3.1.1 Travel Delay
3.1.1.1 NaviGAtor Effect on Delay
The NaviGAtor System reduces travel delay caused by traffic incidents on the freeway system where ITS coverage is present. This reduction in travel delay is a result of reduced incident detection times, reduced response times by emergency personnel, and reduced incident durations. The delay savings calculated in this analysis are the result of the reduction of time it takes to respond to and clear an incident using the NaviGAtor system when compared with a response to the same incident without the NaviGAtor system. Underlying this approach is the notion that without the detection and faster response afforded by NaviGAtor, delay times would be longer.
The timeline shown in Figure D.1 is an illustration of the events that happen during a highway incident from the time an incident occurs to the time traffic returns to normal flow. The types of highway incidents that cause the delay studied in this analysis are the result of traffic crashes, disabled vehicles, and debris in the roadway. These incidents result in travel delay due to the temporary reduction in capacity on the highway. The components of the timeline are discussed in the subsections following.

Figure D.1 Timeline of an Incident
The key to understanding the difference between an incident that is managed by NaviGAtor and an incident that is not managed by NaviGAtor is best described by using the incident timeline. As mentioned previously, NaviGAtor is a highly integrated system that is capable of quickly responding and clearing a highway incident. This is made possible by a combination of 24 hours a day/7 days a week monitoring of highways at the TMC, the ability to directly receive motorist calls, and a fleet of incident response vehicles patrolling the interstate that are capable of clearing an incident.
Prior to NaviGAtor, a loosely integrated system of organizations, including 911 call centers, police departments, wrecker companies, and others, would respond to and clear incidents. To determine the delay savings due to NaviGAtor, it is necessary to determine a baseline condition for how long incidents would last if NaviGAtor were not available to assist in the response. Since a true baseline (the condition without NaviGAtor and HERO units) is impossible to establish, a pseudo baseline needs to be estimated. The pseudo baseline condition (simply referred to as "baseline" henceforth) is determined by using the following three methods:
- Operators at the TMC enter incident information into the NaviGAtor System Logs. Such information is obtained from visual observations using the CCTV cameras for incidents within the NaviGAtor surveillance area. A situation when a HERO cannot respond provides a baseline condition where the incident information is logged accurately but non-involvement of HEROs precludes any NaviGAtor benefits that were identified as measurable earlier in this report.
- Customer Service Representatives (CSRs) and/or operators at the TMC enter incident information obtained through calls from the public to *DOT, GDOT maintenance crews, 911 Centers, and other sources into NaviGAtor System Logs. Incidents outside the NaviGAtor surveillance area where a HERO cannot respond present a baseline scenario. The non-involvement of HEROs precludes any NaviGAtor benefits in this scenario.
- Surveys of public safety personnel can be conducted to estimate timeline data for incidents not receiving assistance from the NaviGAtor system. This can also involve the extraction of incident timeline information from any available public safety dispatch logs.
In Figure D.1, the six time periods during the course of an incident are labeled 1 to 6. This provides a comparison of the timeline under baseline and NaviGAtor conditions. Below is a description of how these times are determined for an incident worked by NaviGAtor and its corresponding baseline condition.
3.1.1.1.1 Report Time
Definition: The period of time from when an incident occurs to when an incident is reported.
Baseline Condition: In the absence of NaviGAtor, an incident is typically reported by a call from a motorist to 911. There is no direct way to measure this time, so a survey of public safety personnel was conducted to estimate the average report time in the baseline condition.
NaviGAtor Condition: The time it takes for an incident to be reported is similar for both the NaviGAtor and baseline condition when the means of reporting the incident comes from a motorist calling in the incident. NaviGAtor is able to reduce the Report Time in cases when the incident is first detected by a HERO or a TMC operator through the CCTV system. HEROs can detect an incident while patrolling their route, and it is often the case that the incident has yet to be reported to any agency prior to the HERO's arrival. Likewise, TMC operators have predefined areas of highway to monitor using the CCTV system and often detect an incident before a motorist has reported it. This time is recorded in the HERO dispatch log or in the log file for the TMC operator.
3.1.1.1.2 Verification Time
Definition: The period of time from when an incident is reported to when it is verified.
Baseline Condition: Official verification for a baseline incident does not occur until the responder arrives on the scene of an incident. Because of this, the verification time for a baseline incident is the same as the time for when the initial responder arrives on the scene. Determining this time is discussed under the Response Time section.
NaviGAtor Condition: For the NaviGAtor condition, the verification of an incident is primarily done by TMC operators who use the CCTVs or when the CSRs take three phone calls regarding the same incident. A HERO or any GDOT or law enforcement personnel (trusted sources) can also verify the incident if he or she is already at the scene of the incident. NaviGAtor verifies each incident in real-time and records the time into its incident management software. This time is recorded in the log file for the TMC operator. If a HERO reports the incident, the verification time is the same as the report time in the HERO Dispatch Log.

A = Incident Occurs B = Incident Reported C = Incident Verified D = Response Dispatched |
E = Response Arrives F = Partial Clearance G = Full Clearance H = Normal Flow |
Note: Figure is not to scale
Figure D.2 Incident Timeline Comparison
3.1.1.1.3 Dispatch Time
Definition: The period of time from when an incident is verified to when the appropriate response is dispatched.
Baseline Condition: After a call from a motorist has been received, the appropriate response is then dispatched. This time is determined through the survey of public safety personnel mentioned earlier.
NaviGAtor Condition: With NaviGAtor, dispatch is handled by the HERO dispatcher who is notified that a HERO is needed on the scene when a TMC operator enters the verified incident. The time for a 911 representative to dispatch a police officer to an incident is probably similar to the time it takes NaviGAtor to dispatch a response. For non-crash incidents, such as stalls or debris in the roadway when 911 is potentially not called, the time to dispatch would be greater than with NaviGAtor. This is one of the reasons why a baseline for each incident type is determined. The dispatch time is recorded in the HERO dispatch log. If a HERO reports the incident, the dispatch time is the same as the report time in the HERO dispatch log.
3.1.1.1.4 Response Time
Definition: This is the period of time from when the appropriate response is dispatched until the time the response arrives at the scene of the incident.
Baseline Condition: This is the time period that it takes for the arrival of response personnel, which may include time to dispatch and the response time of additional resources not initially identified as needed. This time is determined through the survey of public safety personnel mentioned earlier. The response arrival time can also be measured by operators at the TMC using the CCTVs for incidents when a HERO cannot respond. This method could be used to supplement the surveys.
NaviGAtor Condition: The TMC operators enter the time the HERO arrives on the scene of the incident. The response time is then calculated from the dispatch time to the arrival time. This time is reduced using NaviGAtor because HEROs are patrolling the interstates and have the ability to quickly respond to incidents. Another reason to assume that NaviGAtor can reduce this time is because of the ability of TMC operators at the TMC to visually identify an incident using the CCTVs and give the HERO its exact location and determine the additional resources needed before the HERO arrives on the scene. Because other agencies and companies do not have the capability of visually identifying the incident from a remote location, they may not be able to get an accurate location of the incident from the person reporting it, thus making it harder to locate and respond.
3.1.1.1.5 Incident Clearance Time
Definition: This is the period of time from when the response arrives until the time the incident is cleared.
Baseline Condition: This is the time that it takes police, wreckers, and any additional agencies to clear an incident from the roadway. For the baseline condition, the clearance time can be measured by TMC operators using the CCTVs for incidents when a HERO cannot respond. Further information can be gathered in the public safety personnel surveys.
NaviGAtor Condition: This is a time period when NaviGAtor can considerably reduce the overall incident duration. This is due mainly to the HERO’s actions. The purpose of the HEROs is not to replace police and wreckers, but they do take on some of their traditional responsibilities. HEROs have the capability to remove stalls from the roadway, right overturned vehicles, give first aid, change tires, remove debris, provide fuel, and provide other types of motorist assistance. In some situations, such as motorist aid and debris removal, the HERO can clear an incident without assistance from any other agency such as police or wreckers. In other situations, such as a crash where police and wreckers are necessary, the HERO still plays a vital role in helping to quickly remove the incident from travel lanes and return the highway to its pre-incident capacity. The HEROs report the clearance times for NaviGAtor as they actually happen and record them in the HERO dispatch log.
3.1.1.1.6 Recovery Time
Definition: This is the period of time from when an incident is cleared until the traffic returns to normal flow.
This time is a function of the incident duration and the traffic volume on the highway when an incident occurs. If the total incident duration time for the NaviGAtor condition is less than the baseline condition, then the Dissipation Time for traffic to return-to-normal flow is also less for the NaviGAtor condition. This time is a calculated value for both the NaviGAtor and baseline condition and is discussed in the Calculating Delay section of this report.
The total incident duration time is a summation of the time periods 1 to 6. As explained above, NaviGAtor has the capability to reduce all of these time periods and therefore the ability to reduce total incident duration. The delay savings for an incident worked by NaviGAtor is graphically shown in Figure D.3, which compares the incident timeline for the baseline condition to the incident timeline for NaviGAtor conditions detected by the following three methods: a call into the TMC, by a TMC operator using the CCTV system, and a HERO in the field.
The incident duration time is one of the primary components used to calculate the delay associated with an incident. Therefore, NaviGAtor’s ability to decrease the incident-duration time results in a reduction in the total delay due to the incident. An explanation of how delay is calculated is detailed in the next section.
3.1.1.2 Incident Delay
The delay caused by the incident is a function of both the duration of the incident and the traffic demand during the incident. Figure 3.3 2 graphically shows the relationship of time and (cumulative) traffic volume on incident delay.
As discussed earlier, NaviGAtor can reduce the total duration of an incident by making reductions in the Detection, Response, and Clearance times of an incident. To measure the delay reduction benefits attributable to the NaviGAtor system, a comparison can be made between the baseline and NaviGAtor conditions.
Figure D.3 is essentially a timeline that describes what happens to traffic volumes during the timeline of an incident. Before an incident occurs, traffic volume equals demand as illustrated by the line labeled Demand Flow. When an incident occurs at point A, traffic throughput (volume) is decreased due to the reduction in highway capacity as shown by the line labeled Reduced Capacity. When the highway capacity drops below the demand flow, it results in delay. In Figure D.3, the total delay for an incident with NaviGAtor responding is represented as the shaded area on the left under the demand flow line. This volume/time relationship is measured in terms of vehicle-hours. The shaded area on the right is a graphic representation of the delay savings due to NaviGAtor (G1-G2-H2-H1). The total delay without NaviGAtor is a combination of the two areas shown (A-H2-H1). The delay is measured in terms of vehicle-hours. After the incident is cleared (pointG1 for a NaviGAtor incident), the theoretical capacity of the highway is restored and is referred to as the Getaway Capacity. The vehicles in the queue escape at the Getaway Capacity until the Demand Flow is reached (point G2 for an incident worked by NaviGAtor). At this point, the queue resulting from the incident has completely dissipated and has returned to its original volume. If NaviGAtor were not available to intervene, the recovery might not begin until point H1 and recovery would be complete at point H2.Appendix A shows the corresponding case for an incident which went from lane blockage to partial clearance to full clearance.

Figure D.3 Incident Delay
3.1.1.3 Incident Delay Calculation
The methodology described above is derived from deterministic queuing theory. Using this methodology enables one to mathematically represent both the baseline and NaviGAtor conditions.
The first step is the calculation of the capacity reduction associated with the incident. For any given lane-blocking incident, the capacity of the highway is reduced by both the reduction in available travel lanes and by motorist behavior in adjacent lanes. The reduction in available travel lanes is a geometric reduction in capacity, which is a linear function of the number of lanes blocked. For example, if two lanes of a four-lane highway are blocked, there is a 50% reduction in geometric capacity.
However, the true capacity of the highway is further reduced by other factors, such as “rubber-necking,” lane changes, and motorists maintaining adequate following distance between their vehicle and other vehicles entering their lane. Using the same example as above, the capacity is reduced by another 18% because of motorist behavior. Therefore, the total capacity reduction is 68% leaving only 32% of normal capacity. Results of recent studies, which are summarized in Table D.1, indicate that the blockage of shoulders also has an effect on the capacity of the highway.
The data given in Table D.1 are thus used in computing the capacity reduction caused by incidents. Because of the nature of the incident response operations, the number of lanes blocked due to an incident varies with time. As the incident is cleared over time, progressively fewer lanes are blocked. There are primarily two stages in a lane-blocking incident. The first stage involves the blockage of one or more lanes of the freeway for the period between the occurrence of the incident and the relocation of the involved vehicles to the shoulder. The second stage involves blockage of the shoulder. The effect of the incident is therefore not completely mitigated when the incident was moved off to the shoulder. Thus, it is necessary to divide an incident into two separate parts with separate effects on the capacity. The capacity reduction effect of the shoulder blockage is taken into account until the incident is entirely cleared.
The use of Table D.1 requires the determination of the location of the incident in order to identify the number of lanes in the facility. Incidents can usually be identified to the nearest freeway segment.
Table D.1 Reduced Capacity Factor Lookup Table 3
Number Of Lanes In Each Direction |
Shoulder Disablement |
Shoulder Crash |
Lanes Blocked |
||
|---|---|---|---|---|---|
One |
Two |
Three |
|||
2 |
0.95 |
0.81 |
0.35 |
0.00 |
N/A |
3 |
0.99 |
0.83 |
0.49 |
0.17 |
0.00 |
4 |
0.99 |
0.85 |
0.58 |
0.25 |
0.13 |
5 |
0.99 |
0.87 |
0.65 |
0.40 |
0.20 |
6 |
0.99 |
0.89 |
0.71 |
0.50 |
0.25 |
7 |
0.99 |
0.91 |
0.75 |
0.57 |
0.36 |
8 |
0.99 |
0.93 |
0.78 |
0.63 |
0.41 |
Once the real capacity reduction has been calculated, the reduced capacity on the highway can be determined. The reduced capacity is also a function of the getaway capacity, which is determined by multiplying the number of lanes on the highway section where the incident occurs by the theoretical capacity for each lane. The equation for determining reduced capacity is:
μR = μ * CR
μR = Reduced Capacity
μ = Getaway Capacity, (2250vph * # lanes)
CR = Capacity Reduction Factor (Table 3.1)
Time duration in queue is the time from when an incident occurs until the traffic returns to the normal flow rate that existed before the occurrence of the incident. This is illustrated in Figure D.1 and Figure D.3 as the Time to Normal Flow. The time duration in queue is a function of the duration of the incident. The incident-duration time is a field-measured value for a NaviGAtor condition and a computed value for the baseline condition. The time, location, and severity of the incident determine what value is used for the baseline incident duration; this is due to the effect that these parameters have upon the incident duration. The time duration in queue is used to determine the total delay caused by an incident and is calculated by the following equation:
ιQ(NaviGAtor) = tR(NaviGAtor) ( μ- μR)/( μ - λ )
ιQ(Baseline) = tR(Baseline) ( μ- μR)/( μ - λ )
ιQ(NaviGAtor) = Time Duration in Queue (NaviGAtor Incident)
tR(NaviGAtor) = Incident Duration, Field-Measured, (NaviGAtor Incident)
λ = Demand Flow
ιQ(Baseline) = Time Duration in Queue (Baseline Incident)
tR(Baseline) = Incident Duration (Baseline Incident)
For a lane-blocking incident that has a partial clearance (moving the vehicles to either shoulder) at some point before the full clearance, the time duration in queue is computed in two parts:
tQ1(NaviGAtor) = tR1(NaviGAtor) ( μ- μR1)/( μ - λ)
tQ2(NaviGAtor) = tR2(NaviGAtor) ( μ- μR2)/( μ- λ)
ιQ(NaviGAtor) = tQ1(NaviGAtor) + tQ2(NaviGAtor)
tR(NaviGAtor) = tR1(NaviGAtor) + tR2(NaviGAtor)
μR1 = Reduced Capacity (Before Partial Clearance)
μR2 = Reduced Capacity (After Partial Clearance)
t R1(NaviGAtor) = Incident Duration (Before Partial Clearance), Field-Measured
tR2(NaviGAtor) = Incident Duration (After Partial Clearance), Field-Measured
tQ1(NaviGAtor) = Time Duration in Queue (Before Partial Clearance)
tQ2(NaviGAtor) = Time Duration in Queue (After Partial Clearance)
Finally, the total delay caused by an incident, with and without NaviGAtor responding, can be determined using the following equations:
TD (NaviGAtor) = [ tR(NaviGator) + tQ(NaviGator) (λ - μR)] /2
TD (Baseline) = [ tR(Baseliner) + tQ(Baseline) (λ - μR)] /2
TD (NaviGAtor) = Total Delay for an Incident Managed by NaviGAtor
TD (Baseline) = Total Delay for a Baseline Incident
For a lane-blocking incident that has a partial clearance (moving the vehicles to either shoulder) at some point before the full clearance, the total delay is computed as4 :
TD(NaviGAtor)2 =
½( μ - λ)(tQ(NaviGAtor)- (tR1(NaviGAtor) + tR2(NaviGAtor)))2
+½(λ - μR1)(tR1(NaviGAtor) + tR2(NaviGAtor))2 + ½( μR1 - μR2)(tR2(NaviGAtor))2After calculating the total delay caused by an incident, the incident-delay savings can then be calculated. The calculated delay savings, in terms of vehicle-hours saved, are the result of a difference in time for the events of the incident timeline to occur with and without NaviGAtor responding to an incident
IDS (Veh-Hr) = TD (Baseline) - TD (NaviGAtor)
IDS (Veh-Hr) = Incident Delay Savings in terms of Vehicle-Hours Saved
For a two stage clearance:
IDS (Veh-Hr) 2 = TD (Baseline) - TD (NaviGAtor) 2
IDS (Veh-Hr) 2 = Incident Delay Savings in terms of Vehicle-Hours Saved for two-stage clearance
3.2 Customer Satisfaction
3.2.1Surveys
To collect data on customer satisfaction relating to the NaviGAtor system, the Schapiro Research Group conducted a survey of travelers in the Atlanta metro area in November 2002.
3.2.1.1 Determining the Survey Participants
The following criteria were used to determine a pool of participants for the survey. They must:
- Live in the 13-county metropolitan Atlanta area;
- Have a valid driver’s license;
- Personally drive on metro Atlanta freeways three or more times per week;
- Not be employed by GDOT .
3.2.1.2 Survey Topics Covered
The respondents were asked a broad range of questions relating to their commute. This included discussion-related to components of the NaviGAtor system, such as CMS, *DOT, the NaviGAtor website (www.georgia-navigator.com), and the HEROs. They were then asked questions relating to the use and, if applicable, the usefulness of these NaviGAtor components.
3.2.1.3 Survey Results
Some of the survey results regarding customer satisfaction benefits are listed below:
- Eighty-one percent of the respondents reported they often use the CMSs, and the majority found them useful.
- Eighty-four percent of the respondents reported they were familiar with the HEROs, and, of those, ninety-three percent found them useful.
- Those who use *DOT tend to find it very or somewhat useful.
- A vast majority of those who use the NaviGAtor website found it useful.
- A majority of those who use the NaviGAtor website are likely to change their route based on information they receive from the website.
3.3 Energy and Environmental
When an incident occurs, a vehicle queue typically forms upstream of the incident because of the resulting reduced capacity. The length of the queue that forms is a function of the incident-duration time and capacity reduction, as illustrated in Figure D.3 . As described in the Delay Savings section of this methodology, NaviGAtor reduces the incident duration time and therefore reduces the length and duration of queue that forms upstream of an incident. This reduction in queue results in a decreased amount of time that vehicles are on the highway, which translates into a decrease in amount of emissions that are released and fuel that is used.
A high-level approach to show this benefit of the NaviGAtor system is made in this analysis. This benefit is calculated by using the total delay savings to approximate the reduction in emissions and fuel consumption. Using an average speed for vehicles in congestion, the fuel consumption and amounts of CO, HC and NOx emissions are determined.
3.3.1 Reduced Emissions
Emission sensitivity tables, available from the U.S. Environmental Protection Agency, are used to calculate the reduced amount of emissions released because of the NaviGAtor system. (See Appendix B for a sample of an emission sensitivity table.) The appropriate emission sensitivity table, based on vehicle speed, gives the amount of emissions released in terms of grams/mile. For the purpose of this study, the tables used are converted to give emissions in terms of grams/hour. Delay savings, in terms of vehicle-hours, can then be used to determine the reduction of emissions due to NaviGAtor.
Total Reduced Emissions (convert to tons) = IDS (Veh-Hr)* Grams/hour of Emissions
IDS (Veh-Hr) = Incident Delay Savings in terms of Vehicle-Hours Saved
(calculated in the Delay Savings section of this report)
3.3.2 Reduced Fuel Consumption
Delay reduction due to NaviGAtor results in a reduction in the time that vehicles are on the highway. A high-level estimate of the reduction in fuel consumption is made using this reduction in delay. The first step in the calculation is to convert delay savings in vehicle-hours to vehicle-miles. This is done using the following equation:
Vehicle Miles = IDS(Veh-Hr)* Speed Avg
IDS(Veh-Hr) = Incident Delay Savings in terms of vehicle-hours saved(calculated in the Delay Savings section of this report)
Speed>Avg = The average speed of vehicles in the queue resulting from an incident (calculated based on the average queue length and the average time a vehicle spends in the queue)
Based on the average speed and vehicle makeup of the queue, the reduced fuel consumption can be determined. The fuel consumption, in terms of gallons per mile, for cars and trucks can then be entered into the following equation to determine the total fuel reduction.
Total Fuel Reduction (gallons) = Vehicle Miles* PCars * Gallons/Mile of Gas Cars
+ Vehicle Miles * P Trucks * Gallons/Mile of Gas Trucks
PCars = Percentage of cars in traffic, expressed as a fraction
PTrucks = Percentage of trucks in traffic, expressed as a fraction
3.4 Cost Savings
3.4.1 Savings Due to Delay Reduction
After calculating the total delay savings (vehicle-hours), the cost savings associated with delay reduction can be calculated. These savings result from the decrease in time that motorists spend in traffic, due to NaviGAtor, as related to a dollar figure estimate for the motorists value of time. The dollar amount used to estimate the value of motorists’ time is based on data from the Bureau of Labor Statistics. A study by the Clean Air Campaign states that the average vehicle occupancy on Atlanta freeways for persons driving from home to work is 1.165 persons per vehicle. The savings due to delay reduction calculation uses this occupancy value to capture the driver and passenger’s time. The percent cars and trucks are also determined, based on the segment where the incident occurs, to give a more accurate estimate of the value of time. The average truck’s value of time is different from the average value of time for an individual in a car, and different corridors in the Atlanta region have wide variations in percent trucks. The percentage of trucks on highway segments that NaviGAtor manages was determined by using data from GDOT count stations.
Below is the equation used to determine the individual incident cost savings due to NaviGAtor.
IDS (Cost) = IDS (Veh-Hr) * [(Cars (%) * Occ* Car (Cost)) + (Trucks (%) * Truck (Cost))]
From this calculation, the cost savings for all incidents worked by NaviGAtor are summed to give the total cost savings.
Total IDS (Cost) = ∑1x IDS(Cost)IDS(Cost) = Incident Delay Savings in Terms of Dollars Saved
Cars(%) = Percent Cars by Segment (Varies)
Occ = Vehicle Occupancy (1.165 persons/vehicle)
Cars (Cost) = Cost Per Passenger Per Hour ($19.14/hour)6
Trucks (%) = Percent Trucks by Segment (Varies)
Truck (Cost) = Cost Per Vehicle Per Hour ($32.15/hour)7
x = Number of Incidents Worked by NaviGAtor
3.4.2 Savings Due to Secondary Crash Reduction
A secondary crash is a result of the change in traffic patterns because of the effects of an upstream incident and can be defined by the occurrence of a crash within a predefined distance and time threshold from a primary crash.
3.4.2.1 Benefits of NaviGAtor in Reducing Secondary Crashes
The reduction in secondary crashes due to NaviGAtor is a result of the reduced incident duration time from the incident management program. (A more in-depth discussion of incident duration is in the Delay Savings section of this methodology.) Previous studies concluded that the probability of a secondary crash occurring is a function of the duration of the primary incident, so a reduction in primary incident duration due to NaviGAtor results in a decrease in the probability of a secondary crash occurring.
3.4.2.2 Assumptions
Previous studies have shown that 15% to 25% of freeway incidents that occur are secondary crashes8, 9. For this analysis, it is assumed conservatively that 15% of crashes that occur on the highway network covered by NaviGAtor are secondary crashes.
3.4.2.3 Calculating the Number of Secondary Crashes Reduced
The following equation is used to calculate the number of secondary crashes that would occur on average, based on the assumption that 15% of all crashes are secondary crashes. This equation determines the baseline condition for secondary crashes.
C1 = X * 0.15
C1 = Number of secondary crashes in the baseline condition
X = Total number of crashes in the baseline condition
This analysis disregards the secondary crashes that NaviGAtor prevents due to the removal of disabled vehicles from the roadway, which are a majority of the HERO response types. These are disregarded to provide a more conservative estimate.
The number of baseline secondary crashes is then entered into the equation below to determine the decrease in secondary crashes due to NaviGAtor.
C2 = C1 * [(T1 - T2)/T1]
C1 = Decrease in secondary crashes due to NaviGAtor over a time period
T1 = Average incident duration (baseline condition)
T2 = Average incident duration (NaviGAtor condition)
The second part of the equation, (T 1 - T 2)/T 1, is the average reduction in incident duration due to NaviGAtor. This reduction represents a decrease in the amount of time primary incidents are on the highway, which reduces the opportunity for secondary crashes to occur. This equation assumes that the decrease in exposure time of primary incidents due to NaviGAtor directly correlates to a reduction in the number of secondary crashes.
A study currently being conducted by The Georgia Institute of Technology on secondary crashes is researching the various attributes of secondary crashes and may provide additional information regarding the correlation between primary and secondary crashes, which could be applied to future secondary crash reduction benefit calculations.
3.4.2.4 Calculating the Cost Savings of Secondary Crashes Reduced
The calculated number of secondary crashes is next entered into the cost equation below to determine the total dollar savings.
Cost = (C2)(Acc$)
Acc $ = Average cost of a two-vehicle property damage only crash ($3458)10
The average cost associated with each crash is based on data provided by the National Highway Traffic Safety Administration. The rate used is for a low-impact crash (property damage only) involving two vehicles. While crashes that result from a vehicle queue can be severe and result in injuries, a low-impact crash assumption was chosen to give a more conservative estimate for the cost savings benefit.
3.4.3 Savings Due to Emissions Reduction
After the reduction in emissions (tons) has been determined, cost savings associated with the reduced CO, HC, and NOx emissions are calculated based on the following values 8.
Cost Savings of CO Reduced = Total Emissions CO (tons) * $6,360 (per/ton)
Cost Savings of HC Reduced = Total Emissions HC (tons) * $6,700 (per/ton)
Cost Savings of NOx Reduced = Total Emissions NOx (tons) * $12,875 (per/ton)
3.4.4 Savings Due to Reduction in Fuel Consumption
After the reduction in fuel consumption (gal) has been determined, cost savings associated with the reduced fuel consumption can be calculated. The cost per gallon of gas is based on current market rates when the benefit is measured. The cost per gallon of gas is then entered into the following equation to determine the cost of the reduced amount of fuel consumption.
Cost Savings of Fuel Reduction = Total Fuel Reduced (gallons)
* Fuel Market Rate (Cost/gallon)
3.4.5 Savings Due to Motorist Assistance
Each time a HERO clears a stall, provides a gallon of gas, or helps change a tire, there is some value for the motorist associated with the assistance given. In this analysis, a value is assigned to the various types of motorist assistance.
3.4.5.1 Value of Assistance to Motorists
Our research indicated that there is no clear quantitative data on the value of the assistance motorists receive from Freeway Service Patrols. To assign a value to the various types of assistance, results from a HERO Survey conducted by Schapiro Research Group were used.
The HERO Survey compiled results of a questionnaire provided by HEROs to each motorist they assisted. One of the survey questions is “What value would you place on this HERO service?” Motorists could respond with one of five answers:
- No Value
- $0 - $20
- $20 - $50
- $50 - $100
- More than $100
The questionnaire also asked, “For what reasons did you need assistance?” Motorists could respond with one of five answers:
- Mechanical problem
- Stalled in traffic
- Stalled out of traffic
- Crash
- Other
Using the data obtained from these surveys, a value to the motorist for each type of service can be obtained.
3.4.5.2 Calculating the Total Value of Assistance to Motorists
The following equation is used to determine the total assistance value for a particular type of assistance given:
Value (type) = # Assists(type) * Cost(type)
Next, the total value can be calculated by summing the savings of the individual types of assists:
Total Value = ∑ Value (type)
# Assists(type) = Total number of assists by NaviGAtor, for an assistance type
Cost(type) = Cost of an individual assist by NaviGAtor, for an assistance type
4.0 IMPLEMENTATION PLAN
As has been documented in Section Appendix C:, there are several benefits that result from the reduction of incident duration. Critical to the computation of the costs associated with such savings is the accurate measurement of the reduction in the incident duration resulting from the NaviGAtor system deployment. This reduction is used to compute the delay savings, which in turn are used to compute the other savings. The extent of the delay savings resulting from a reduction in the incident duration depends on several factors:
- Number of available lanes on the facility at the location,
- Number of lanes blocked by the incident,
- Demand volume on the facility,
- Incident duration,
- Typical duration of a baseline incident under similar conditions.
Since the methodology associated with this benefits analysis involves the computation of the individual delay savings for each incident, it is essential to obtain the above‑mentioned parameters for each incident. The location information for an incident helps identify the road segment involved and thereby the number of available lanes on the facility. Information about the number of lanes blocked by the incident is available from the logs. The demand volumes are obtained from traffic counts at different locations. In previous studies,11 traffic volumes have been found to demonstrate a weekly periodicity. It is assumed that this periodicity in the measured volumes is a direct result of the periodicity of the demand volumes. Therefore, typical demand volumes are determined for specific categories that are created according to the day-of-week and the time-of-day. The date and time of the incident is used to identify the demand volume category of the incident (see Section E.3). The parameters necessary to determine the above factors that can be obtained directly from the incident logs are:
- Location of incident,
- Number of lanes blocked,
- Time (Time-of-Day) of incident,
- Date (Day-of-Week) of incident, and
- Timeline of incident.
The sources of the above data are the following three incident logs:
- NaviGAtor System Logs,
- HERO Logs, and
- HERO Dispatch Logs
4.1 Data description
The following is a brief description of the data used.
Incident Timeline Data–Of the six data points on the incident timeline only two, Incident ReportTime and Incident Clearance Time, are necessary to calculate delay savings as stated in the above equations. However, all the points of the timeline should be collected to establish a breakdown of when delay occurs during an incident. This helps to determine how beneficial the NaviGAtor system is during the different segments of the incident timeline. A more detailed description of each point on the incident timeline can be found in section D.1.1A of this study.
Incident Location Data–This is the data needed to establish the location of the incident and the geometric characteristics of the highway. The incident location can be determined by identifying both the route and milepost of the incident or the NaviGAtor response plan segment in which the incident occurs. In the NaviGAtor software, the response plan segment is determined when a TMC operator locates an incident on the GIS map. In the case of those HERO incidents that are not tracked in NaviGAtor, dispatchers locate incidents based on the route and milepost information called in by the HEROs. Route and milepost locations can then be mapped to response plan segments. Once the location is obtained, the following data can be obtained:
- Number of Lanes–The number of travel lanes where the incident occurs.
- Demand Flow (Traffic Volume)—Demand flow is calculated for individual segment based on historic volume data collected by the VDS. For each predefined segment, there are average historical volumes based on Time-of-Day (30 minute increments), day of the week, and season. Anomalies, such as holidays where traffic is known to be atypical, are also taken into account. Using these historic volumes gives smoothed averages over time.
- Percent Trucks –This is the percentage of trucks on the highway segment where the incident occurs. This percentage varies based on the location of the incident.
Number of Lanes Blocked–This is the number of travel lanes that are blocked during the incident. This number can change over the duration of an incident. All changes to the number of travel lanes blocked and the time associated with this change were collected for this study.
Incident Level –The incident level is based on the severity of the incident that can range from a HERO giving motorist assistance to a level IV crash blocking all travel lanes.
Type of Assistance Given–This is the type of assistance that a HERO gives to stranded motorists, such as moving a stalled vehicle or changing a tire.
4.2 Establishing Baseline Incident Cases
Baseline incident cases are developed to facilitate a means of comparing the actual NaviGAtor incidents with a representative baseline incident of similar characteristics. Recognizing that an incident’s impact will vary significantly according to the freeway corridor, time-of-day, day-of-week, and severity of the incident, baseline incident cases are established according to each of these parameters.
The freeway-corridor definitions for the incidents are derived from the NaviGAtor segment definitions. Table E.1 and Figure E.1 show the 32 corridors within metro Atlanta that are used to differentiate incidents locations during the analysis. The four time-of-day intervals to be used in the analysis are defined in accordance with the Atlanta Regional Commission (ARC) definitions (Table 4.4). The day-of-week definitions for the purposes of this study are Weekends (Sat/Sun), Mondays, Weekdays (Tue-Thu), and Fridays. Finally, the incident severity levels (I–IV) are defined in accordance with GDOT’s definitions (Table 4.5)
Segment Definitions for the NaviGAtor Network
1. I-75 NB |
from I-285 to Wade Green Road |
1: I-75 SB |
from Wade Green Road to I-285 |
2. I-75 NB |
from I-85 to I-285 |
2: I-75 SB |
from I-285 to I-85 |
3. I-75/I-85 NB |
from I-20 to I-85 |
3: I-75/I-85 SB |
from I-85 to I-20 |
4. I-75 NB |
from I-85 to I-20 |
4. I-75 SB |
from I-20 to I-85 |
5. I-75 NB |
from I-285 to I-85 |
5. I-75 SB |
from I-85 to I-285 |
6. I-75 NB |
from Hudson Bridge Road to I-285 |
6. I-75 SB |
from I-285 to Hudson Bridge Road |
7. I-85 NB |
from I-285 to Old Norcross Road |
7. I-85 SB |
from Old Norcross Road to I-285 |
8. I-85 NB |
from I-75 to I-285 |
8. I-85 SB |
from I-285 to I-75 |
9. I-85 NB |
from Camp Creek Parkway to I-75 |
9. I-85 SB |
from I-75 to Camp Creek Parkway |
10. GA-400 NB |
from I-285 to Old Milton Parkway |
10. GA-400 SB |
from Old Milton Parkway to I-285 |
11. I-285 EB |
from I-75 to GA-400 |
11. I-285 WB |
from GA-400 to I-75 |
12. I-285 EB |
from GA-400 to I-85 |
12. I-285 WB |
from I-85 to GA-400 |
13. I-285 NB |
from US-78 to I-85 |
13. I-285 SB |
from I-85 to US-78 |
14. I-285 NB |
from I-20 to US-78 |
14. I-285 SB |
from US-78 to I-20 |
15. I-20 EB |
from I-285 to I-75/I-85 |
15. I-20 WB |
from I-75/I-85 to I-285 |
16. I-20 EB |
from I-75/I-85 to I-285 |
16. I-20 WB |
from I-285 to I-75/I-85 |
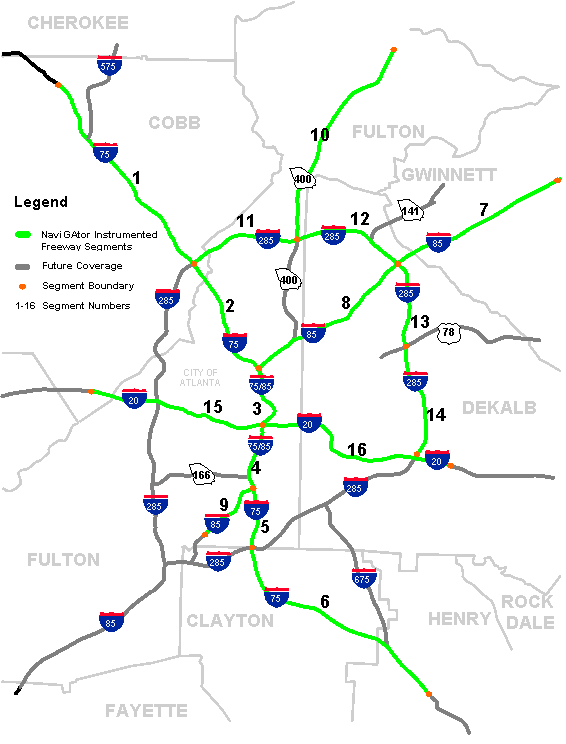
Figure E . 1 NaviGAtor Map Showing Segment Numbers
Table E.2 ARC Time-of-Day Intervals
TOD |
Definition |
|---|---|
1 |
06:00–09:59 |
2 |
10:00 - 14:59 |
3 |
15:00 - 18:59 |
4 |
19:00 - 05:59 |
Table E.3 GDOT Incident Severity Levels
Level |
Definition |
|---|---|
I |
Incident blocking shoulder |
II |
Incident blocking one lane in direction of travel |
III |
Incident blocking two or more lanes in direction of travel |
IV |
Incident blocking all lanes in direction of travel |
4.3 Demand Volume Estimation
VDS data from the NaviGAtor system was used to estimate the demand volume. The VDS data archive provides several years of 15-minute aggregates of average vehicle speeds, vehicle counts, and lane occupancy at detection points spaced approximately every 1/3 rd mile throughout the NaviGAtor coverage area.
- The average throughput volumes on each of the 32 segments were computed using a year of data from 2004. Over a one-year timeframe, each of the segments will have significantly more days without incidents than with incidents; therefore, the effects of the incidents on the annual throughputvolume average is expected to be minimal.
An average throughputvolume value was computed for each day-of-week and time-of-day category. The categories are shown in Table E. 4.
Table E . 4 Day of Week and Time-of-Day Categories
Day of Week Category |
Day of Week |
|
Time-of-Day Category |
Time-of-Day |
|---|---|---|---|---|
1 |
Monday |
1 |
06:00–09: 59 (Morning Peak) |
|
2 |
Tuesday, Wednesday, Thursday |
2 |
10:00–14: 59 (Day off Peak) |
|
3 |
Friday |
3 |
15:00–18:59 (Afternoon Peak) |
|
4 |
Saturday, Sunday |
4 |
19:00–05: 59 (Night off peak) |
- The average throughputvolume data were used to represent the demand volume ( λ) in the delay-computation formula. Except in free-flowing conditions, the throughput volume is not equal to the demand volume. However, this assumption renders the delay computations more conservative. Also, to some extent, it mitigates the effect of recurrent congestion on the incident delay computations.The average throughput volume values are provided in Appendix C.
4.3.1 Using Average Observed Throughput Volume to Estimate Demand Volume
Figure D.3, Figure B.1 and Figure B.2 present simplified forms of cumulative volume diagrams for representing the delay induced by incident congestion. Figure E. 2shows the effects of the different assumptions regarding the capacity of the highway on the computed incident delay. The plot has cumulative volumes on the Y-axis and the incident timeline (Time) on the X-axis. It can be shown that incident delay is equal to the area between the capacity curve and the demand curve. The demand curves have been represented as linear to simplify the discussion.
If the demand is less than the capacity when the incident occurs (see Figure E. 2), the incident delay is equal to the area of the triangle ACE. If the demand is greater than the capacity when the incident occurs and then it eventually decreases, the total delay is equal to the area ACFB. The area ABD contains the recurrent congestion delay. Therefore, the incident delay is defined by the area ACFD.
In the case of demand being greater than capacity at certain times if the average throughput is used as an estimator of demand, the estimated demand is represented by a straight line, such as AG. The incident delay is estimated as ACG. There are two inherent assumptions in this case:
- The demand is less than the capacity at the beginning and end of the peak period over which the average is being computed.
- The throughput can never exceed the capacity. Therefore, the slope of the average throughput line will always be less than the slope of the capacity line.
If it is assumed that the traffic flow returns to free flowing conditions by the end of the peak, the cumulative volume at the end of the peak should be exactly equal on both the actual demand curve and the average throughput curve. Therefore, these two curves should intersect at the time-point defining the end of the peak period. If the incident congestion clears up within the peak period, the intersection of the queue discharge curve with the average volume curve will be before the intersection of the queue discharge curve with the actual demand curve. Consequently, the incident delay will always be underestimated if the average throughput is used as an estimate of the demand volume. This yields a conservative estimate of the incident delay and thereby a conservative estimate of the incident-management related benefits.
If the incident happens to be a long one (see Figure E.3) such that its effect would extend into the off peak period, there would be congestion at the end of the peak period. This implies that there will be a disconnection between the actual demand and the average throughput at the termination of the peak period. The incident delay would then be represented by the area ALJM, using the average throughput curves. The incident delay computed using the actual demand would be equal to the area of ALKD, which is again higher than that using average throughput curves.

Figure E.2 Incident Delay under Different Demand and Capacity Assumptions with Incident Ending Within Peak Period

Figure E.3 Incident Delay under Different Demand and Capacity Assumptions with Incident Extending Beyond Peak Period.
4.4 Capacity Reduction
The Capacity Reduction table (See Table D.1) referenced from the Freeway Incident Management Handbook (FIMH) accommodates lane blockages of up to three lanes but does not address cases with more than three blocked lanes. For example, if a facility has four lanes and all four lanes are blocked, the reduced capacity is zero. However, if the facility has five lanes and only four out of the five lanes are blocked by an incident, the capacity reduction table in the FIMH does not have an estimate of the capacity reduction factor.
To accommodate incidents where more than three lanes were blocked on a multilane facility, an effort was made to extrapolate the values in the FIMH table. Since there were only three consecutive values available for each series (one-, two- and three-lane blockage), regression equations did not provide any credible results. It was observed in the table that in cases where 50% or more of the lanes were blocked, the open lanes operated at about 50% of their capacity. For example, in a three-lane facility with one lane open, the scaled capacity would be 1/3, whereas the actual capacity is 1/6 (0.17). This observation was extrapolated to obtain the values where more than three lanes were blocked in highway facilities with four to eight lanes. The extrapolated capacity reduction factors are presented in Table E. 5.
Table E.5 Capacity Reduction Factors for Lane Blockage Resulting from Incidents
| #Of Freeway Lanes in Each Directions | Sholder Disablement | Shoulder Crash | Lanes Blocked | ||||||
|---|---|---|---|---|---|---|---|---|---|
| One | Two | Three | Four | Five | Six | Seven | |||
| 2 | 0.95 | 0.81 | 0.35 | 0.00 | NA | NA | NA | NA | NA |
| 3 | 0.99 | 0.83 | 0.49 | 0.17 | 0.00 | NA | NA | NA | NA |
| 4 | 0.99 | 0.85 | 0.58 | 0.25 | 0.13 | 0.00 | NA | NA | NA |
| 5 | 0.99 | 0.87 | 0.65 | 0.40 | 0.20 | 0.10 | 0.00 | NA | NA |
| 6 | 0.99 | 0.89 | 0.71 | 0.50 | 0.25 | 0.17 | 0.08 | 0.00 | NA |
| 7 | 0.99 | 0.91 | 0.75 | 0.57 | 0.36 | 0.21 | 0.14 | 0.07 | 0.00 |
| 8 | 0.99 | 0.93 | 0.78 | 0.63 | 0.41 | 0.25 | 0.19 | 0.13 | 0.06 |
5.0 RESULTS
Georgia NaviGAtor data for 12 consecutive months – May 2003 to April 2004 – were processed to obtain the values of the required parameters, such as average incident duration, total number of incidents, etc. These parameters, along with the incident timeline data, were used in computing the annual (2003/2004) NaviGAtor benefits below. The specific processes and detailed calculations for computing the total and average incident durations for both the baseline and NaviGAtor conditions are outlined in Appendix D. The performance measures from each benefit category are presented in the following subsections with the cumulative cost savings calculated in the final subsection. The cost savings associated with these benefits are calculated based upon 2003 dollars.
5.1 Mobility
5.1.1 Average Incident Duration Reduction
The average reduction in incident-duration because of NaviGAtor is calculated as:
Average reduction in incident-duration = Baseline incident duration –
NaviGAtor managed incident duration
(See Appendix C: Sample Computations)
= 66.6 minutes - 20.7 minutes
= 45.9 minutes
5.1.2 Incident Delay Savings Total
The total vehicle-hours of incident delay savings is computed as:
IDS = ∑ TD (Baseline)–∑ TD (NaviGAtor) vehicle-hours
Where:
IDS = Incident Delay Savings in terms of Vehicle-Hours Saved
∑TD (NaviGAtor) = Total Delay for an Incident Managed by NaviGAtor
= 6,290,002 vehicle-hours (see Appendix C: Sample Computations)
∑TD (Baseline) = Total Delay for a baseline Incident
= 13,544,497 vehicle-hours
Therefore:
IDS = 13,544,497 vehicle-hours–6,290,002 vehicle-hours
= 7,254,495 vehicle-hours
5.2 Customer Satisfaction
Customer satisfaction is gauged on the basis of a study conducted by Schapiro Research Group, Inc. (SRG) for GDOT. This study was conducted by mail using a postcard-sized survey developed by SRG. The postage-paid postcard was addressed to SRG. The postcard surveys were distributed to HEROs at their dispatch center. HEROs gave the postcard survey to motorists they assisted and asked the drivers to complete and return the cards at their convenience. A total of 537 survey cards, considered both unique and useable, were received from travelers who were assisted by HEROs.
5.2.1 Survey Results
Some of the survey results regarding customer satisfaction benefits are listed below:
- Ninety-four percent of motorists surveyed were Georgia residents.
- Morning and evening incidents were equally represented in the surveys.
- A mechanical problem or flat tire was the predominant reason most motorists needed assistance.
- Sixty-four percent of drivers report ‘Driver saw me’ as how the HERO knew they needed assistance.
- Seventy-nine percent of motorists were assisted by a HERO in less than 20 minutes.
- Motorists tend to place the value of the HERO service over $20, with fairly equal portions selecting the ‘$20-$50,’ ‘$50-$100,’ and ‘More than $100’ ranges.
- The vast majority (ninety-five percent) of motorists gave the HERO service an excellent rating. Five percent gave the service a good rating, while no motorist who returned a survey gave a rating of fair or poor.
- One hundred percent of motorists report that their HERO assisted them in a courteous manner.
- When asked about HERO expansion, fifty-five percent of motorists want the service expanded to all Atlanta freeways, forty-seven percent want HERO expanded to other areas of the state, twenty-three percent want HERO to cover more Atlanta freeways, and one percent see no need for expansion.
In addition to evaluating the customer satisfaction associated with the assistance from HEROs and the efficiency of detection of incidents by NaviGAtor, this survey also facilitated the quantification of the value of the assistance to the motorist. The above results are specific to the HERO operations. The results of a broader survey covering other NaviGAtor operations have been presented in section D.2.1C.
5.3 Energy and Environmental
5.3.1 Reduced Emissions
The metro Atlanta area has been designated as a non-attainment area in accordance with the National Ambient Air Quality Standards (NAAQS) and significant efforts are being taken to reduce the harmful emissions from vehicles. The Clean Air Campaign, (www.cleanaircampaign.com), Congestion Mitigation and Air Quality (CMAQ) Improvement Program, and several transportation planning organizations are developing various measures to reduce these emissions and improve the air quality. This study revealed that substantial environmental benefits associated with reduced emissions that improve the quality of life for all residents in the metro Atlanta area are derived from the NaviGAtor system. The total reduction in emissions because of incident delay savings is computed as:
Total Reduced Emissions = IDS * tons per hour of HC emissions +
IDS * tons per hour of CO emissions +
IDS * tons per hour of NOx emissions
Where:
IDS = Incident Delay Savings in terms of Vehicle-Hours Saved = 7,254,495 vehicle-hours (Calculated in section F.1)
Therefore:
Total Reduced Emissions = 7,254,495 * (25.676 /10 6) tons of HC +
7,254,495 * (338.69 /10 6) tons of CO +
7,254,495 * (36.064 /10 6) tons of NOx
= 186.27 tons of HC +
2,457.01 tons of CO +
261.63 tons of NOx
5.3.2 Reduced Fuel Consumption
The reduction in fuel consumption related to incident-delay savings is computed as:
Reduction in Fuel Consumption = Vehicle Miles *
[Percentage Cars * Gal/mile for Cars
+ Percentage Trucks * Gal/mile for Trucks]
Where the vehicle-miles are obtained from the incident delay savings value as:
Vehicle Miles = IDS * Average Speed
IDS = Incident Delay Savings in terms of Vehicle-Hours Saved
=7,254,495 vehicle-hours (Calculated in section F.1)
The following values are used for the computation:
Average speed of vehicles in congestion = 20 mph
Percentage trucks in traffic = 8.00%
Percentage cars in traffic = 92.00%
Fuel consumption of cars = 0.0465 Gallons per mile12
Fuel consumption of trucks = 0.1429 Gallons per mile13
The average speed of vehicles in congestion was computed based on the assumption that vehicles traveling in the range of 0 - 45 mph are typically assumed to be in congestion on a highway with free flow speeds of 55 mph or higher. A value in the middle of the range (22.5 mph) would be a logical choice of the average speed of vehicles in recurrent congestion given the fact that this value is completely dependent on the level of speed and density that is considered as the boundary for separating congested and uncongested flow. Twenty miles per hour is typically used as the upper bound of severe congestion. Therefore the value of 20 mph, which is conservative from the point of estimating the benefits (a lower speed assumption will generate a higher estimation of benefits), is chosen to represent the average speed of vehicles in recurrent congestion.

Figure 5.1 Fuel Economy Graph14
From the above graph it is evident that there is a decrease in the fuel economy when the speed drops below 35 mph. The ratio between the fuel economy at 20 mph and 55 mph is 25/30. Using this factor,
Fuel consumption of cars at 20 mph = 0.03875 Gallons per mile
Therefore:
Vehicle Miles = 7,254,495 vehicle-hours * 20 mph
= 145,089,909 vehicle-miles
Reduction in Fuel Consumption = 145,089,909 vehicle-miles
* [92.00% * 0.03875 gal/mile of gasoline
+ 8.00% * 0.1429 gal/mile of diesel]
= 5,172,455 gallons of gasoline
+ 1,658,170 gallons of diesel
5.4 Cost Savings
5.4.1 Cost Savings Due to Delay Reduction
Cost savings from Incident Delay Reduction is computed as:
IDS (Cost) = IDS * [(Cars (%) * Occ * Car (Cost)) + (Trucks (%) * Truck (Cost))]
Where:
IDS (Cost) = Incident Delay Savings in Terms of Dollars Saved
Cars (%) = Percent Cars = 92.00%
Occ = Vehicle Occupancy = 1.16 persons per vehicle
Car (Cost) = Cost per Driver/Passenger per Hour = $17.23 15
Trucks (%) = Percent Trucks = 8.00%
Truck (Cost) = Cost per Vehicle per Hour = >$32.15 < per hour16
Therefore:
Total IDS (Cost) = 7,254,495 vehicle-hours * [(92.00% * 1.16 persons/vehicle *
$17.23 /hour ) + (8.00% * $32.15 /hour)]
= $152,053,180
5.4.2 Cost Savings Due to Secondary Crash Reduction
To compute the savings because of secondary crash reduction, the number of secondary crashes is estimated as follows:
Number of secondary crashes in the baseline condition = X * 15.00%
Where:
X = Total number of crashes in the baseline condition = 4512
The above number is the number of crashes with in the presence of the NaviGAtor system and is just an estimate to the number of crashes in the baseline condition. The baseline condition is expected to have a higher number of incidents; therefore, this number is a conservative estimate.
Number of secondary crashes in the baseline condition = 4512 * 15.00%
= 676 crashes
The estimated decrease in secondary crashes is computed as:
Decrease in secondary crashes because of NaviGAtor = Number of secondary crashes in the baseline condition * [(T1 - T2)/T1]
Where:
T1 = Average incident duration (baseline condition) = 66.6 minutes
T2 = Average incident duration (NaviGAtor condition) = 20.7 minutes
Therefore:
Decrease in secondary crashes because of NaviGAtor = 676 crashes
* [(66.6 minutes
- 20.7 minutes)/ 66.6 minutes]
= 466 crashes
The cost savings from the reduction in secondary crashes is:
Cost Savings = Decrease in secondary crashes because of NaviGAtor * Acc$
Where:
Acc$ = Average cost of a two-vehicle property damage only crash 10
= $3,458 per crash
Therefore:
Cost Savings = 466 crashes * $3,458 /crash
= $1,611,054
5.4.3 Cost Savings Due to Emissions Reduction
The cost savings associated with the reduction in CO, HC and NOx emissions are calculated as follows 8:
Cost Savings because of HC Reduction = Total Emissions HC (tons) * $6,700 (per/ton)
= 186.27 * $6,700
= $1,247,985
Cost Savings because of CO Reduction = Total Emissions CO (tons) * $6,360 (per/ton)
= 2,457.01 * $6,360
= $15,626,587
Cost Savings because of NOx Reduction = Total Emissions NOx (tons) * $12,875 (per/ton)
= 261.63 * $12,875
= $3,368,436
Total Cost Savings because of Emissions Reduction = $1,247,985 + $15,626,587 + $3,368,436
= $20,243,009
5.4.4 Cost Savings Due to Reduction in Fuel Consumption
After the reduction in fuel consumption (gal) has been determined, cost savings associated with the reduced fuel consumption can be calculated. The cost per gallon of gas or diesel is based on current market rates when the benefit is measured. The cost per gallon of gas or diesel is then entered into the following equation to determine the cost of the reduced amount of fuel consumption.
Cost Savings of Fuel Reduction = Vehicle Miles
* [ Percentage Cars * Gal/mile for Cars
*Gasoline Market Rate + Percentage Trucks
* Gal/mile for Trucks * Diesel Market Rate ]
= Passenger car vehicle-miles *Gasoline Market Rate
+ Truck vehicle-miles* Diesel Market Rate
The following values are used with the results from section F.3.2:
Average price of gasoline in 2003-2004 = $1.52 17
Average price of diesel in 2003-2004 = $1.51 18
Therefore,
Cost Savings of Fuel Reduction = [5,172,455 vehicle-miles * $1.52 /gal
+ 1,658,170 vehicle-miles * $1.51 /gal]
= $10,365,969
5.4.5 Cost Savings Due to Motorist Assistance
The average value of a HERO assist to motorists was determined through a survey of motorists who received such assistance. (See Section F.2.) The results are shown in Figure F.2. The value associated with a single instance of assistance to a motorist is shown on the X-axis. The Y-axis represents the percentage of motorists associating the above-mentioned value with his/her experience. The average value was computed as the weighted average of the means of the value classes.

Figure 5.2 Value of HERO Assistance to Motorist
The total value of motorist assistance was computed as:
Value of motorist assistance = # Assists * Cost
Where:
# Assists = Total number of assists by NaviGAtor = 49,051
Cost = Average value of an individual motorist assist = $60.25
The average value of an individual motorist assist ($60.25) was based on the average value identified by travelers receiving roadside assistance in the survey conducted by the Schapiro Research Group. This value is consistent with the membership costs of roadside assistance programs offered by auto manufacturers and various automobile clubs that range from $50 - $100 per year. These roadside assistance programs will typically reimburse members up to $100 per assist for roadside services when members obtain assistance from providers not affiliated with the program.
Therefore:
Value of Motorist assistance = 49,051 assists * $60.25 / assist
= $2,955,323
5.4.6 Total Cost Savings
The total cost savings are computed as the sum of the cost savings from the individual benefits as follows:
Total Cost Savings = Cost Savings because of Incident Delay Savings
+ Cost Savings because of Emissions Reduction
+ Cost Savings because of Fuel Consumption Reduction
+ Cost Savings because of Reduction in Secondary Crashes
+ Total value of HERO assists to travelers
= $187,228,535 (see Table F.1)
Table 5.1 Benefits Cost Savings
Benefit Measure |
Cost Savings |
|---|---|
Mobility – incident delay savings |
$152,053,180 |
Environmental – reduced emissions |
$20,243,009 |
Environmental – reduced fuel consumption |
$10,365,969 |
Safety – reduced secondary crashes |
$1,611,054 |
Customer Satisfaction – motorist assistance |
$2,955,323 |
Total |
$187,228,535 |
6.0 CONCLUSIONS
In addition to the specific performance measures calculated in the section above, many intriguing observations and conclusions were noted during the performance of the benefits analysis. The URS staff that conducted the analysis had the following conclusions.
1) The total annual benefit of the NaviGAtor system in terms of cost savings increased from $44.6 million in 1997 ($51.15 million in 2003 dollars) to $186.8 million in 2003/2004. The increase in total NaviGAtor cost savings can be attributed to the following factors relative to NaviGAtor operations:
- An increase in the freeway miles of NaviGAtor coverage from 37 in 1997 to 140 in 2003/2004.
- The additional benefits considered (Environmental, Safety, and Customer Satisfaction) in the 2003/2004 analysis.
- The revised methodology that reduces the number of assumptions in the 2003/2004 analysis
2) The Benefit/Cost ratio of the NaviGAtor system also increased from 2.3:1 in 1997 to 4.4:1 in 2003/2004. The NaviGAtor benefit/cost ratio of 4.4:1 for 2003/2004 was based upon the $186.8M cost savings benefit and an annual capital, operating, and maintenance expense of $42.5M (annual 2003/2004 capital - $26.5M, operating - $11M, and maintenance - $5M expenses). This increased NaviGAtor benefit/cost ratio is consistent with benefit/cost ratios identified for other ITS deployments throughout the nation and reveals that the public’s investment in the NaviGAtor system is achieving a high rate of return. An ITS National Investment and Market Analysis study conducted by the U.S. Department of Transportation revealed benefit/cost ratios of metropolitan areas ranging from 2.0:1 to 8.8:1. For example, Maryland’s CHART incident management program benefit/cost ratio was calculated as 5.6:1 and the Charlotte, NC, incident management program benefit/cost ratio ranged from 3.0:1 to 7.0:1.
3) While this analysis attempted to reduce the number of assumptions made in the 1997 study, not all assumptions could be eliminated. When assumptions were unavoidable, the URS staff used a conservative approach to define the assumptions to ensure that the calculations were not over-inflated. These assumptions often had a significant effect upon the calculations and ultimate results achieved. An example of the effect of one assumption that had a significant effect upon the ultimate results was how to address a NaviGAtor incident that had a duration longer than its corresponding baseline incident. In the conservative incident-delay savings computations, the effect of a NaviGAtor incident, which is longer than the corresponding baseline incident, has been assumed to nullify some of the delay reducing effect of the other incidents. However, if one chooses to discount these instances with negative delay savings on the assumption that none of the NaviGAtor-managed incidents will actually have an incident duration longer than a baseline incident under exactly the same conditions, the net-delay savings will be greater than those obtained in the conservative estimate. Thus, by using conservative assumptions during the analysis, the actual benefits obtained by the NaviGAtor system are much more likely to be underestimated rather than overestimated.
4) The analysis also revealed the critical importance of the NaviGAtor data in calculating the system’s benefits. Thorough, complete, and accurate incident data was required to conduct the analysis through the methodology established in this report. The ability to quickly obtain and process all of the incident timeline data required had a substantial effect upon the time and effort necessary to conduct the study. A recursive process of upgrading the automatic data-processing scripts with new logic learned during the manual verification and consolidation of the data progressively reduced the time and effort used to process the data during the later phases of the data-processing.
5) While attempting to identify the specific benefits of the NaviGAtor system, this analysis revealed that many ITS benefits are extremely difficult to quantify. For example, the NaviGAtor website (www.georgia-navigator.com) currently registers over half a million visits per month, clearly indicating that Georgians derive a significant benefit from the content (images, travel times, incident info, etc.) that it provides. Attempting to quantify the benefits of the NaviGAtor website and other Advance Transportation Information Systems (ATIS), such as the Changeable Message Signs and the *DOT phone service is very complex; however, and was not included in this analysis.
6) Finally, this analysis was confined to Atlanta freeways only and does not include benefits obtained by other jurisdictions in Georgia (cities and counties) that have been able to leverage GDOT’s investment in developing the NaviGAtor software.