4.0 Error Checking
Once the analyst is satisfied that the CORSIM model is fully coded, the analyst must then examine the model for completeness and errors. The error correction step is essential in developing a working model so that the calibration process does not result in parameters that are distorted to compensate for overlooked coding errors. There is a distinct difference between the error checking stage and the calibration stage. The error checking stage examines and removes the errors produced during model development. Conversely, the calibration stage involves adjusting the model parameters to assure the model will accurately reproduce local traffic conditions. The calibration process relies on the elimination of all major errors in demand and network coding before calibration begins. Error checking involves various reviews of the coded network, coded demands, and default parameters.
Error checking proceeds in three basic stages:
- Reviewing software errors.
- Reviewing input data.
- Reviewing animation.
The practitioner should manage the error checking step by controlling the resources assigned to error checking, ensuring a consistent process is followed, staying on task (i.e., not rushing into calibration or alternatives analysis), and completing the task on schedule. The analyst should document the errors and the approach and techniques used for resolving them.
4.1 Review Software Errors
The analyst should review the software and user group Web sites to ensure that he or she is aware of the latest known “bugs” and user workarounds for the software. The analyst should ensure that he or she is using the latest version and “patch” of the software.
Check the McTrans website (http://www-mctrans.ce.ufl.edu/) or the PCTrans website (http://www.ku.edu/~kutc/pctrans/) for known problems, issues, and updates of TSIS/CORSIM.
Software errors can be tested by coding simple test problems (such as a single link or intersection) where the result (such as capacity or mean speed) can be computed manually and compared to the model. Some software errors can only be resolved by working with the software distributor or software developer.
4.2 Review Input Data
It is good practice to have an analyst familiar with the project, but not involved in the base model coding, perform the review of the input data. Subtle coding errors may be easier to detect from someone that has not been personally involved in the base model development. The analyst should check for data coding errors that may be causing the simulation model to represent travel behavior incorrectly. Subtle data coding errors are the most frequent cause of unrealistic vehicle behavior in a CORSIM model. Subtle coding errors include apparently correctly coded input that is incorrect because of how it is used in the model to determine vehicle behavior. Input data errors may happen for different reasons including:
- Mistakes.
- Typographic errors: Simply entering data wrong will definitely cause errors. For example, entering a turn percentage as 63 percent instead of 36 percent can have a large impact on the results.
- Failure to set a value (accepting the default): For ease of use, CORSIM has many default values. If the default value was not the intended or most realistic value, the results will not be the desired results. Setting a parameter that is known to be different from the default value during the model development phase or the error checking phase will save time during the calibration phase.
- Implementation errors.
- Misuse of the software. Trying to use CORSIM for a purpose that was not intended could cause errors.
- Misunderstanding of the software. Not understanding all the implications of the implementation could cause errors.
- Poor data collection. The collected data may have been correctly entered into the model, but was not collected correctly. This will cause the model to not reflect the real world.
- Error in Analyst Expectations. The analyst should first verify the correct vehicle behavior in the field for the location and time period being simulated before deciding that the animation is showing unrealistic vehicle behavior. Many times, the analyst’s expectations of realistic vehicle behavior are not matched by actual behavior in the field. A videotape of the study area made during the data collection period is very helpful. Field inspection may also reveal the causes of vehicle behavior that are not apparent when coding the network from plans and aerial photographs. These causes need to be coded into the model if the model is expected to produce realistic behavior.
- Model run parameters.
- Check time periods and durations to ensure the full extent of congestion is captured.
- Verify fill time is long enough to allow the network to become fully loaded before collecting statistics.
- Link and node network geometry.
- Check basic network connectivity (are all connections present?).
- Check link geometry (lengths, number of lanes, free-flow speed, facility type, etc.).
- Check for prohibited turns, lane closures, and lane restrictions at the intersections and on the links.
- Demand.
- Check vehicle mix proportions at each entry node.
- Check identified sources and sinks for traffic.
- Verify volumes against traffic counts.
- Check vehicle occupancy distribution (if modeling HOV vehicles).
- Check turn percentages (if appropriate).
- Check origin-destinations of trips on the network.
- Control.
- Check intersection controls (control type, control data).
- Check ramp meter controls (control type, control data).
- Traffic operations and management data.
- Verify bus operations, such as dwell times and bus paths, are coded reasonably.
- Check parking operations.
- Verify pedestrian operations and delays are properly accounted for in the model.
- Driver behavior and vehicle characteristics.
- Check and revise, as necessary, the default vehicle types and dimensions.
- Check and revise, as necessary, the default vehicle performance specifications.
- Check and revise, as necessary, the default driver behavior specifications.
4.2.1 CORSIM Input Data
There are many ways to review the input data. For example, it may be easier to use other tools than those built into TSIS. Many companies and individuals have created scripts that perform data entry and data transfer tasks. Reviewing the input data using the TSIS provided tools are described below.
TRAFED
In TRAFED each network object (e.g., links, nodes, and controllers) can be clicked on so the input data can be viewed and checked.
The following techniques may be useful to increase the efficiency and effectiveness of the error-checking process:
- Overlay the coded network over aerial photographs of the study area to quickly verify the accuracy of the coded network geometry.
- Check for unintentionally superimposed links and nodes. Two or more nodes placed in the same location will look like a single node but the node numbers will overlap and not be readable in most cases. The links may connect to one of the nodes, but not to the other.
- For a large network, a report summarizing the link attributes should be created so that their values can be easily reviewed.
TRAFVU
In TRAFVU, each network object can be clicked on to view their properties and checked against the input data. TRAFVU also has the advantage of being able to show the links and lanes in both “map” mode and “link-node” mode.
A network does not have to run in CORSIM to be able to be viewed in TRAFVU. This is very useful for checking errors produced during a CORSIM run. TRAFVU can show links that do not connect correctly or the placement of network objects like bus stations or parking zones that produce errors.
Input Link Length vs. TRAFVU’s Calculated Length: TRAFVU also has the ability to compare the input link length to the “as drawn” link length. Each link’s property page shows both the input link length and the TRAFVU calculated link length. A list of links that are more than 6.1 m (20 ft) different between the input length and calculated length are accessible via the TRAFVU Window/Case Description menu item and by clicking on the Messages button on the Case Description dialog. These messages and distance advisories should be evaluated for validity. In some cases the input length is the correct length. In many cases however, TRAFVU’s calculation, which uses the stop bar to stop bar distance, is quite accurate.
TRF File Review
The TRF file is a text file that can be viewed with any text editor including the text editor built into TSIS. Comparing the TRF file parameters to the data collected during the data collection phase (stored in a spreadsheet format) is important to ensuring the correct data is being modeled. Unfortunately, reading the file is not the most straight-forward approach to data error checking and it does require knowledge of the TRF file record types. The records in the TRF file can be sorted so they are easier to review. Turn on sorting in the TRAFED preferences. The records will be sorted by their unique identifier (normally the first entry or the first two entries).
4.2.2 CORSIM Diagnostics
CORSIM itself can be used to check the network for errors and warnings. CORSIM checks all the network parameters to ensure they fall between the minimum and maximum values. It also checks against many other rules that exist. TRAFED checks many of these same ranges and rules to catch data input errors as they are input. However, TRAFED does not check every single rule that CORSIM checks so there may be error messages generated when the network is run through CORSIM. TRAFED can use CORSIM to do a diagnostic check of the input data by using the Network/Check menu item. Input errors will be displayed in the Output Window.
Review Error Messages
When running CORSIM there may be many errors and warnings. Some of these messages are due to input data errors, or they may be due to situations during the run that cause errors to occur. Error messages stop the execution of CORSIM. The errors must be corrected prior to continuing. It is advisable to fix the first error first and work down the list. Correcting the first error will sometimes correct subsequent errors.
Review Warning Messages
Warning messages may indicate significant potential problems that should be corrected or they may indicate conditions that should be evaluated and thereafter ignored. Each warning message should be investigated. If it is decided to allow the warning to remain, the reason for allowing it should be documented. A few such warnings are discussed below:
- Input link length is less than the node-to-node distance. CORSIM makes a very crude check of the input link length versus the node-to-node distance. In some instances the surface link length can be significantly different from the node-to-node distance because it should be input as the stop bar to stop bar distance. In some instances the freeway link length for right-hand on and off-ramps can be significantly less than the node-to-node distance because the node location, as drawn by TRAFVU, is on the left side of the main freeway lanes. The message needs to be evaluated for validity.
- Input speed versus curvature limited speed. The freeway free-flow speed calculated from the input values of roadway friction, curvature, and super elevation may produce a value that is less than the input free-flow speed. A message will be displayed to warn of the difference. The lower speed will be used during the simulation. The message needs to be evaluated for validity.
- Vehicles backed up behind node. During simulation CORSIM reports the number of vehicles backed up behind an entry node in fifty-vehicle increments. This is often an indication that some network data was not input correctly. For example, the link length of the downstream link does not allow the correct amount of storage or the actuated control at the downstream intersection may not be operating as it does in the real world. If this increases throughout the simulation, or it is obvious from the animation that the vehicles are still backed up to an entry link at the end of the simulation, the delay incurred by these vehicles that did not enter the network should be included in the delay calculations for the network.
4.3 Review Animation
The importance of a comparison of model animation to field design and operations cannot be overemphasized. More than just a presentation tool, animation is a great debugging tool. The network has not yet been calibrated so the network may not operate exactly as it does in the real world, but the animation should at least be viewed in this step to make sure the modeled network is in a reasonable range with the real world.
Animation output enables the analyst to observe the vehicle behavior that is being modeled and assess the reasonableness of CORSIM. Running the simulation model and reviewing the animation, even with artificial demands, can be useful to identify input coding errors. A two-stage process can be followed in reviewing the animation output:
-
Run the animation at an extremely low demand level (so low that there is no congestion). The analyst should then trace single vehicles through the network and see where they unexpectedly slow down. Uncharacteristic vehicle behavior (such as unexpected braking or stops) is a quick indicator of possible coding errors. These will usually be locations of minor network coding errors that disturb the movement of vehicles over the link or through the node. This test should be repeated along selected links in the network.
-
Once the extremely low demand level tests have been completed, then run the simulation at 50 percent of the existing demand level. At this level, demand is usually not yet high enough to cause congestion. If congestion appears, it may be the result of some more subtle coding errors that affect the distribution of vehicles across lanes or their headways. Check entry and exit link flows to verify that all demand is being correctly loaded and moved through the network.
The animation should be observed in close detail at key congestion points to determine if the animated vehicle behavior is realistic. If the observed vehicle behavior appears to be unrealistic, the analyst should explore the following potential causes of the unrealistic animation in the order shown below:
- Overlooked data values that need refinement. Entering the wrong number of lanes, or the wrong channelization, are common mistakes.
- Formation of persistent queues. Cyclical queues at signals that clear each cycle are not usually as critical unless they block some other traffic movement. Eliminating the cause of the persistent or primary queue may eliminate all secondary queuing. Thus, the analyst should focus on the few minutes just prior to formation of a persistent queue to identify the causes of the queuing.
- Uncharacteristic vehicle operations (e.g., vehicles stacked on top of each other). The input link length may be different from the TRAFVU calculated link length.
- Previously unidentified points of major ingress or egress (these might be modeled as an intersecting street).
- Operations that CORSIM cannot explicitly replicate, such as a two-way center turn lane (this might be modeled as an alternating short turn bay).
- Unusual parking configurations, such as median parking (this might be modeled operationally by reducing the free-flow speed to account for this friction).
- Average travel speeds that seem excessive.
- Turn bays that cannot be fully utilized because of being blocked by through traffic.
- Bus stations modeled as unprotected stations that block traffic when they are protected stations in the real world.
- Vehicles stopped or stuck on on-ramps. Check the on-ramp speeds, link lengths, lane types, and anticipatory lane changing parameters. Other parameters, such as the percentage of cooperative drivers may improve this problem.
- In general, localized problems that can result in a system-wide impact.
Someone who drives the area being modeled on a daily basis is normally quite familiar with the conditions that exist in the real world. These people are an excellent resource and should be used to review the animation of the network. With little effort, they can visually determine if the model is performing like the real world.
4.4 Key Decision Point
Before embarking upon model calibration, the analyst should confirm that error checking has been completed, specifically:
- All input data are correct.
- Values of all initial parameters and default parameters are reasonable.
- Animated results look reasonable based on judgment or field inspection.
Once the error checking has been completed, the analyst has a working model (though it is still not calibrated). If the error checking is satisfactory, the study can move to the next phase.
However, if the errors cannot be resolved a decision must be made whether to recheck all the data that was collected, recheck all the model input data, bring in an expert to try to solve the problem, work around the error, redefine the study, find a different tool, or cancel the study. It is important to decide if the study can successfully achieve its objectives. This is a major decision point because the calibration phase of the study can be quite time consuming. CORSIM may not be the right tool for the study if the analyst is not satisfied that the model is producing reasonable results. If CORSIM is too limited, the analyst might seek an alternate software program without the same limitations.
4.5 Example Problem: Error Checking
The focus of the example problem for this chapter is the HWY 100 project (as discussed in previous chapters) in the northbound direction between Excelsior Boulevard and Eastbound TH 7 (nodes 127 to 145).
Review Software Errors
The latest version of CORSIM was used to model existing conditions and alternatives for the HWY 100 project. The distributor’s website was visited to determine if there were any known problems or patches that may affect the analysis. There were no known problems found.
Review Input Data and Parameters
After the model was coded, an internal and independent review was made of the model inputs including the geometry, traffic demand, and signal timing data. The verification was made by comparing the model inputs against the source data and by visual inspection of the TRAFVU animation file.
The input data was reviewed by an independent party to ensure that data correctly reflected the source data. Different techniques were used to verify the input data against the real-world conditions. The following errors were found:
- Geometry – a lane drop was not coded.
- Geometry – a number of auxiliary lane lengths were not coded correctly.
- Geometry – freeway links with curvature had incorrect link lengths.
- Volumes – exit ramp turning volumes were incorrectly entered.
The following sections identify how the geometric errors were discovered using the error checking methods described previously in this chapter.
Geometry
The source data is illustrated in a lane coding schematic and a link-node diagram shown in Figure 36 and Figure 37. The schematic includes the link length data, radius of curvature and the auxiliary lane lengths. The information was synthesized from aerials, mapping files, and the field review.
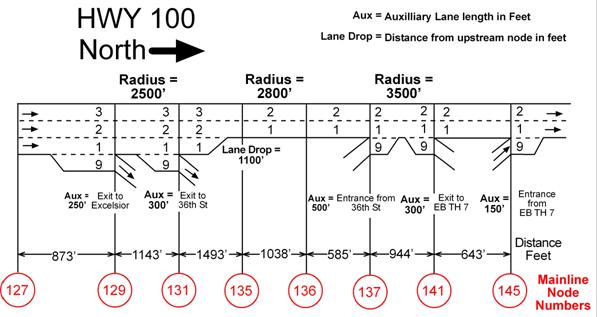
Figure 36 . Illustration. Example problem: HWY 100 northbound lane geometry schematic.
.
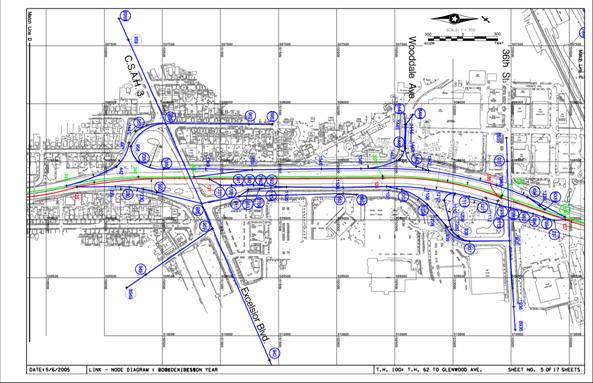
Figure 37 . Illustration. Example problem: link-node diagram of HWY 100 interchanges.
.
Review Geometric Inputs: Tabular Data
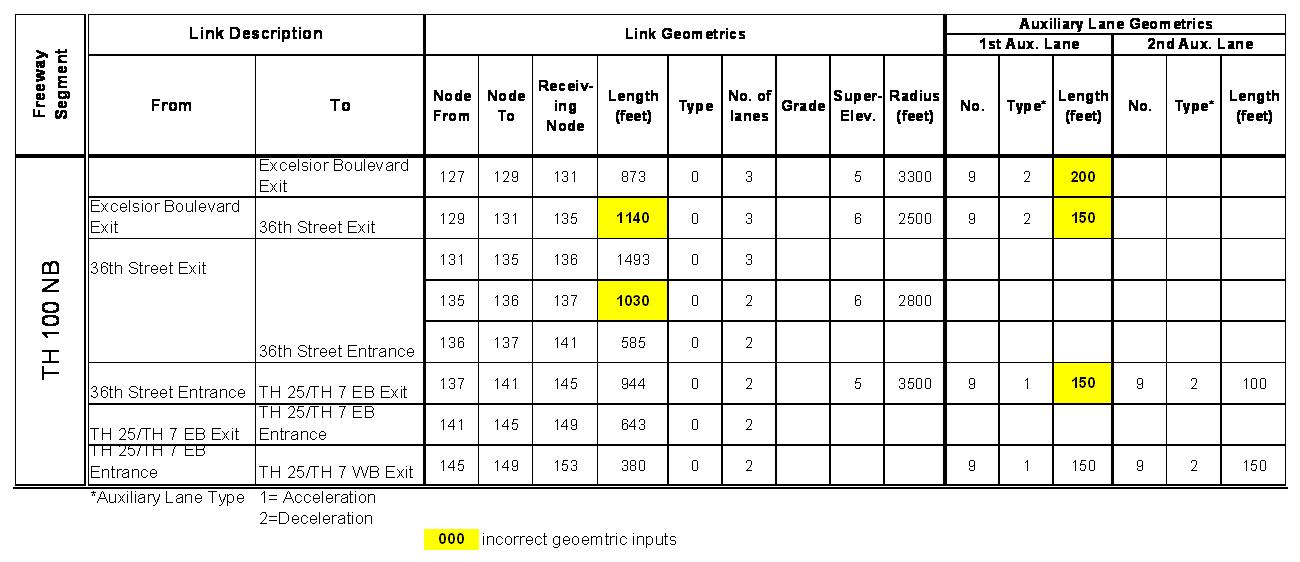
In order to verify that geometric data was input correctly a tabular summary of model inputs was reviewed and compared against the lane schematic figure. Table 9 is a summary of the base model in the key area being reviewed.
.
Table 9 . Example problem: geometric inputs with incorrect coding.
Review Volume Inputs: Tabular Data
Traffic volumes input into the model should be checked against the source database information. There are two basic methods for entering this information, manually or automated through an independent program. Regardless of the method, a back check of what is actually coded into the model versus what was intended should be conducted. The following table and figures illustrate how the volumes at the exit from southbound HWY 100 to westbound were verified.
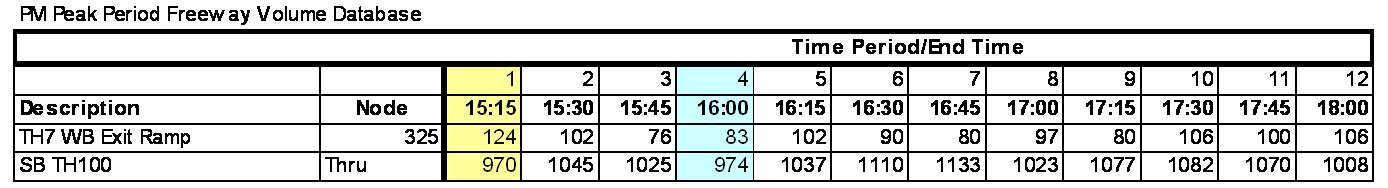
Table 10 below shows the portion of the freeway volume database required for coding the exit ramp volume to westbound TH 7 for Node 325.
Table 10 . Example problem: southbound HWY 100 at TH 7 westbound exit volumes.
.
Using TRAFED, Node 325 is selected and the dialog box for the “Freeway Node Properties” is displayed as illustrated in Figure 38. The different time periods are selected and the volume inputs are checked against the database. From Table 10, time period 1 shows the volume should be 124 veh/h exiting and 970 veh/h going through on southbound TH100. Figure 38 shows that time period 1 is coded correctly.
.
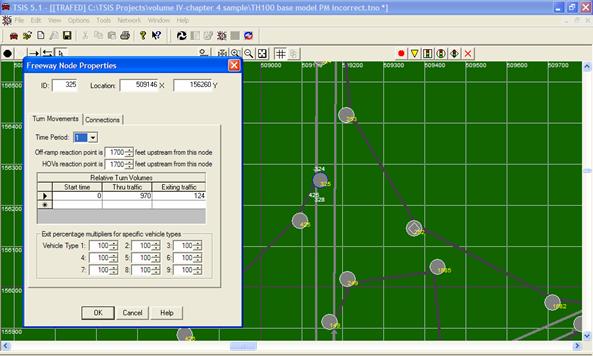
Figure 38 . Illustration. Example problem: volume error check at node 325, time period 1.
Continuing the error checking process, time period 4 from Table 10 was also checked. The table shows that there should be 83 veh/h exiting westbound and 974 veh/h going through on southbound TH 100. From Figure 39, time period 4 shows 830 veh/h exiting westbound indicating that there was an error when coding the volumes.
Figure 39 . Illustration. Example problem: volume error check at node 325, time period 4.
.
Review Signal Timing Data
Checking signal timing includes interpretation of the signal timing sheets and signal design plans. The signal timing sheets are used to verify that signal timings and phasings have been coded correctly in the model. Figure 40 shows a sample signal timing sheet. Typical data to review include pedestrian walk and clearance times and yellow and all red clearance times.
Figure 40 . Illustration. Example problem: sample signal timing sheet.
The primary emphasis from the signal design plans is to verify lane assignments, traffic signal phasing, and physical features such as inductive loop detectors. The signal plan can be used to compare against the TRAFVU animation with detectors turned on. Figure 41 illustrates a sample signal plan schematic showing detectors and phasing information. Figure 42 shows the same intersection in TRAFVU illustrating that a detector was not coded in the model that appears on the signal plan. For this example, the signals were coded as pre-timed to save time. Detectors were coded in the model in case future alternatives needed to show actuated signals. The illustration is provided as an example of a coding error.
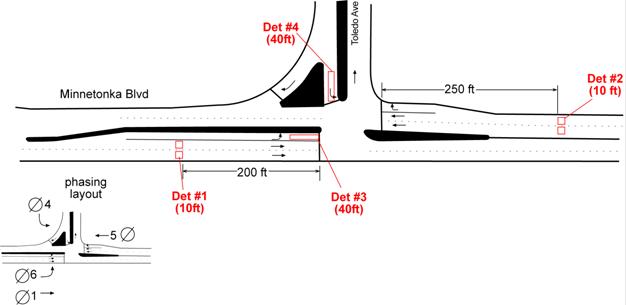
.Figure 41 . Illustration. Example problem: sample signal plan schematic.
.
Figure 42 . Illustration. Example problem: TRAFVU detector error check.
.
Review Warning Messages
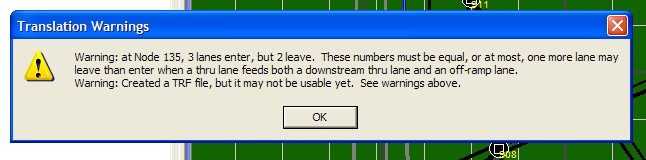
During the translation from TRAFED to CORSIM a warning message was produced as displayed in Figure 43. The analyst then decided to view the geometry at this node in TRAFVU to investigate this warning message.
.
.
Figure 43 . Illustration. Example problem: warning message from TRAFED-CORSIM translation.
Review Animation
Geometric Inputs
A review of the TRAFVU animation confirmed the lane drop warning shown in Figure 43 that the geometry in this section was not coded properly. From the lane schematic drawing shown previously in Figure 36, a lane drop occurs 335.3 m (1,100 ft) downstream of node 131, or 119.7 m (393 ft) upstream of node 135, and not directly at node 135 as is currently coded. In addition, the lane drop should occur in the right-hand lane, not in the left-hand lane as is currently coded. The analyst noticed both of these errors in reviewing the TRAFVU animation and was thereafter able to correct these errors.
Figure 44. Illustration. Incorrect coding of lane drop.
Key Decision Point
After carefully reviewing all areas of the network while the network was animated and correcting previously found errors, it was determined that the network was modeled correctly. It was decided to start the calibration of the network.