2009 Traffic Incident Management Self-Assessment National Analysis Report
Background and Methodology
The TIM SA was developed by the American Transportation Research Institute (ATRI) under contract to the Federal Highway Administration (FHWA) in 2002. It was designed as a tool by which state, regional and local TIM practitioners could assess progress in achieving successful multi-agency programs to manage traffic incidents safely and effectively. As originally designed, the TIM SA provided TIM program managers a way to identify areas where additional resources (human, financial, technical) could be deployed to improve program performance. Additionally, the TIM SA was intended to provide FHWA with a national picture of broader program areas on which to focus national program initiatives.
The TIM SA was launched in 2003 in the nation's top 75 urban areas. Those 75 census areas were subsequently redefined by FHWA Division Offices into 80 operational areas for the TIM SA. Initially intended to be completed on a biennial basis, in 2006 the TIM SA process was modified so that all 80 areas were requested to complete the assessment on an annual basis. In 2006, a total of 70 assessments were conducted and in 2007 that number dropped to 67.
A number of challenges with the TIM SA were identified since its inception and in 2007, FHWA initiated a process to review and revise the annual TIM SA. Among the challenges/issues associated with the TIM SA which this revision process was designed to address are the following:
- Lack of multi-agency participation in the annual assessment;
- Lack of consistent participation by the individuals completing the TIM SA;
- Missing or incomplete data and supporting documentation submitted with each individual TIM SA, making analysis of the results difficult; and
- Confusion over the meaning/intent of some of the TIM SA questions.
Additionally, since the initial TIM SA, a number of federal initiatives had advanced to the point where it was appropriate to examine where synergies between those initiatives and the TIM SA existed. Among the initiatives evaluated in the TIM SA revision process were:
- U.S. Department of Homeland Security National Incident Management System (NIMS);
- Requirements for state Departments of Transportation to develop and implement Strategic Highway Safety Plans (SHSP);
- National Traffic Incident Management Coalition (NTIMC) and its National Unified Goal (NUG);
- FHWA Traffic Incident Management Performance Measures Focus States Initiative (TIM PM FSI).
The TIM SA Revision process included a review of current TIM initiatives, case studies with select TIM SA participants and a thorough review of the TIM SA questions and scoring approach.
The TIM SA Revision completed in 2008 resulted in several key changes, implemented for the first time in the 2009 TIM SA. The program area categories were renamed to more closely align with current NIMS and TIM state of practice. Program and Institutional Issues was renamed Strategic; Operational Issues was renamed Tactical; and Communications and Technology Issues was renamed Support.
The 34 questions were reduced to 31 questions in seven subcategories as follows:
- Strategic
- Formal TIM Programs (2 questions)
- Multi-Agency TIM Teams (4 questions)
- Performance Measurement (5 questions)
- Tactical
- Policies and Procedures for Incident Response and Clearance (8 questions)
- Responder and Motorist Safety (5 questions)
- Support
- Data Collection/Integration/Sharing (5 questions)
- Traveler Information (2 questions)
The scoring was also revised from numeric (0-4) to Low/Medium/High per the descriptions below (Table 1). Supplemental scores were added to clarify specific program progress based on an initial score of Low or Medium. The supplemental scores are described in Table 2.
| Score | Description |
|---|---|
| LOW | Little to no progress in this area.
|
| MEDIUM | Progress in this area is moderate to good.
|
| HIGH | Progress in this area is strong to outstanding.
|
| Score | Description |
|---|---|
| LOW | No Activity
Some Activity
|
| MEDIUM | Fair Level of Activity
Good Level of Activity
|
The Annual TIM SA National Analysis Report provides progress in each program area over the Baseline score. The TIM SA Revision reduced the number of questions overall, through the elimination of some questions, the combining of others and the inclusion of several new questions. To ensure the fidelity of the analysis after the revision, a question-to-question map was created (Appendix A). Where two questions were combined into one, the Baseline for each was averaged to create a new Baseline score for that question. Questions that are new as a result of the revision will not have a Baseline score and the 2009 mean score for that question will become its Baseline. Examples of the question and subsequent scoring conversion are shown in Table 3.
| Programmatic Area | 2009 Question # | 2008 Question # | Baseline |
|---|---|---|---|
| Multi-agency agreements/MOUs | 4.1.1.1 | 4.1.1.2 | 1.71 |
| Formalized TIM Team meets regularly | 4.1.2.1 | 4.1.2.1 | 1.9 |
| Measure secondary accidents | 4.1.3.5 | -- | -- |
| Traffic flow around hazmat or fatal accidents | 4.2.1.7 | 4.2.3.2 and 4.2.3.3 | 2.71 |
The TIM SA Revision also included development of an online portal through which participants could provide answers to each of the questions. Also new in 2009 is the identification of high-scoring locations in each of the three program areas. The TIM SA Revision process noted the value of the TIM SA as a peer networking tool. However, prior to the revision, those locations achieving a high degree of success in specific program areas went unnamed. By noting the success of specific TIM programs, other TIM program managers can communicate with their peers to identify ways to advance program performance and subsequently improve TIM SA scores.
Results – Overall
A total of 86 assessments were completed in 2009 with an overall score of 60.6 percent, representing a 31.9 percent increase over the Baseline (Table 4). Scores for the questions in Support show the greatest percentage change (42.8 percent) over the Baseline and the highest section score was achieved in Tactical (68.8 percent).
| Section | # of Questions | Mean Score Baseline | Mean Score 2009 | % Change in scores from Baseline | Section Weights |
|---|---|---|---|---|---|
| Strategic | 11 | 36.3% | 51.1% | 40.9% | 30% |
| Tactical | 13 | 57.6% | 68.8% | 19.5% | 40% |
| Support | 7 | 41.3% | 59.0% | 42.80% | 30% |
| Overall Total | 31 | 45.9% | 60.6% | 31.90% | 100% |
The 31 TIM SA questions are further divided into category-specific subsections. The revised TIM SA has seven subsections, down from the original eight. Integrated Interagency Communications (4.3.1) and Transportation Management Systems (4.3.2) were combined into one section entitled Data Collection/Integration/Sharing (4.3.1) as part of the TIM SA Revision process. Table 5 shows the overall scores by subsection for the 2009 TIM SA and the Baseline, along with the percentage change from the Baseline.
In the Strategic section, the five questions in TIM Performance Measurement (4.1.3) continue to achieve the highest percentage change from the Baseline (104.5 percent). In 2008, TIM Performance Measurement experienced an 84.5 percent increase over Baseline.
Traveler Information (4.3.2), a subsection of Support, had the second largest increase over the Baseline (74.2 percent). The remaining subsections of questions show significant increases over the Baseline, though Policies and Procedures (4.2.1) had the smallest percentage increase (10.8 percent) of the subsections. Policies and Procedures had the highest score in the Baseline (2.61) and the only Baseline score over 2. This high baseline affords less opportunity for substantial percentage increases in the score year to year.
| Sections and Subsections | No. | Mean Score Range = 0 to 4 |
% Change in 2009 from Baseline | |
|---|---|---|---|---|
| Baseline (n=78) |
2009 (n=86) |
|||
| Strategic | 4.1 | |||
| Formal TIM Programs | 4.1.1 | 1.53 | 1.98 | 29.6% |
| Multi-agency TIM Teams | 4.1.2 | 1.83 | 2.60 | 43.6% |
| TIM Performance Measurement | 4.1.3 | 0.80 | 1.63 | 104.5% |
| Tactical | 4.2 | |||
| Policies and Procedures | 4.2.1 | 2.61 | 2.89 | 10.8% |
| Responder and Motorist Safety | 4.2.2 | 1.71 | 2.53 | 47.7% |
| Support | 4.3 | |||
| Data Collection/Integration/Sharing | 4.3.2 | 1.80 | 2.30 | 39.7% |
| Traveler Information | 4.3.3 | 1.52 | 2.52 | 74.2% |
Scores for all 31 questions for both the Baseline and the 2009 re-assessments are shown in Figure 1. Following Figure 1 is a section-by-section analysis of the change in TIM SA scores from the Baseline to 2009.
Questions appearing for the first time in the 2009 TIM SA (as a result of the 2008 TIM SA Revision) will not show a Baseline score. In the 2010 and subsequent TIM SA National Analysis Reports, the 2009 score for these questions will become the Baseline.
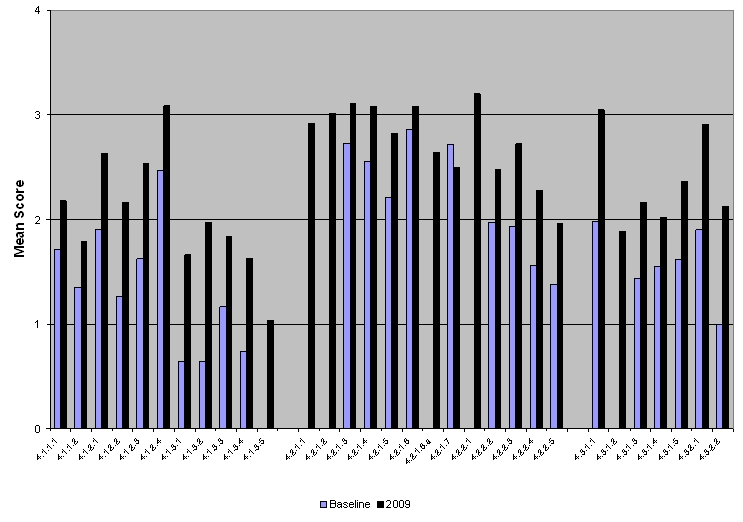
Figure 1. Mean Scores for All Questions Baseline – 2009.
Results - Strategic
Mean Score: 51.1% (15.3 of 30 points)
Strategic program elements provide the basis for organizing and sustaining TIM programs. The continued climb in scores in this section since 2003 (Table 6) illustrates the evolution of TIM programs from ad hoc operations to more formalized and sustained programs.
| Year | Mean Score |
|---|---|
| Baseline | 36.3 |
| 2006 | 48.5 |
| 2007 | 48.8 |
| 2008 | 51.0 |
| 2009 | 51.1 |
The 2008 TIM SA Revision maintained the three sections of questions in the Strategic program area:
- Formal Traffic Incident Management Programs
- Multi-Agency TIM Teams (formerly TIM Administrative Teams)
- TIM Performance Measures
The Formal Traffic Incident Management Programs subsection focuses on the underlying support mechanisms for TIM programs including multi-agency agreements or Memoranda of Understanding (MOU). The TIM SA Revision shifted the focus of this subsection from inter-agency agreements and the identification of budget and personnel needs to explicit resource sharing and integrated, budget processes that facilitate TIM program continuity and sustainability.
The Multi-Agency TIM Teams subsection targets TIM team formal meetings, training, post-incident debriefings and planning for special events. The TIM SA Revision removes the distinction between administrative teams and on-scene responders by emphasizing multi-agency TIM teams. Questions on specific types of training have been added to reflect current state of TIM practice, including NIMS training and training on the National Traffic Incident Management Coalition's (NTIMC's) National Unified Goal.
Questions in the subsection on TIM Performance Measurement target the two measures identified in FHWA's TIM Performance Measures Focus States Initiative (TIM PM FSI). The TIM PM FSI resulted in two consensus program performance measures; Roadway Clearance Time and Incident Clearance Time. The TIM PM FSI also added a third measure, which is now part of the TIM SA; tracking performance in reducing secondary accidents is queried in question 4.1.3.5.
Figure 2 shows the change from the Baseline for each of the three subsections in Strategic.
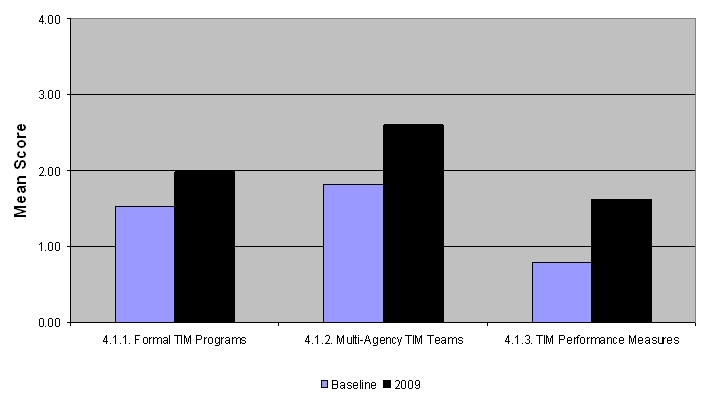
Figure 2. Strategic.
Table 7 shows the mean score (Baseline and 2009) for each of the 11 questions in Strategic, the percentage of assessments rating this question three or higher (indicating success) and the percentage increase in the mean score in 2009 from the Baseline.
| Question Number |
Question | Mean Score Range = 0 to 4 | % of Assessments Scoring 3 or Higher | % Change in 2009 Mean Scores from Baseline |
||
|---|---|---|---|---|---|---|
| Baseline | 2009 | Baseline | 2009 | |||
| 4.1.1.1 | Is the TIM program supported by multi-agency agreements/memoranda of understanding detailing resource sharing (facilities, services, personnel and budget)? | 1.71 | 2.17 | 18% | 37% | 27.2% |
| 4.1.1.2 | Is there a process in place to ensure the continuity of these agreements/memoranda of understanding through integrated planning and budgeting across and among participating agencies? | 1.35 | 1.79 | 12% | 28% | 32.6% |
| 4.1.2.1 | Have a formalized TIM multi-agency team which meets regularly to discuss and plan for TIM activities? | 1.90 | 2.36 | 28% | 57% | 38.3% |
| 4.1.2.2 | Conduct training?
|
1.26 | 2.16 | 9% | 49% | 71.7% |
| 4.1.2.3 | Conduct post-incident debriefings? | 1.62 | 2.53 | 18% | 52% | 56.5% |
| 4.1.2.4 | Conduct planning for special events?
|
2.47 | 3.09 | 35% |
88% | 25.0% |
| 4.1.3.1 | Have multi-agency agreement on the two
performance measures being tracked?
|
0.64 | 1.66 | 3% | 26% | 159.8% |
| 4.1.3.2 | Has the TIM program established methods to collect and analyze the data necessary to measure performance in reduced roadway clearance time and reduced incident clearance time? | 0.64 | 1.97 | 3% | 33% | 207.0% |
| 4.1.3.3 | Have targets (i.e. time goals) for performance of the two measures? | 1.16 | 1.84 | 4% | 33% | 58.4% |
| 4.1.3.4 | Have targets (i.e. time goals) for performance of the two measures? | 0.74 | 1.63 | 3% | 26% | 120.0% |
| 4.1.3.5 | Track performance in reducing secondary incidents? | -- | 1.03 | -- | 8% | -- |
The online TIM SA developed as part of the TIM SA Revision prompted respondents to submit comments on each of the 31 questions. This information was designed to provide additional insight into TIM program details, challenges and trends. While the number of comments submitted varied somewhat by question, in general about a third of TIM SA respondents provided comments for each question.
Comments submitted on Formal Traffic Incident Management Programs (Figure 3) reveal that while significant work has gone into the development of interagency agreements and MOUs, processes to ensure the continuity of the agreements remain somewhat informal, relying in many cases on ad hoc meetings to review the status of the agreements.
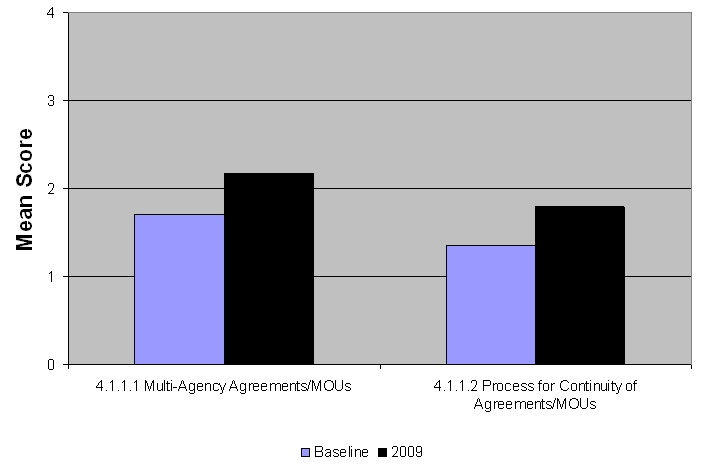
Figure 3. Formal Traffic Incident Management Programs
Average scores for the second subsection, Multi-Agency TIM Teams (4.1.2), have increased 43.6 percent over the Baseline. The highest mean score was achieved in planning for special events (4.1.2.4) with a mean score of 3.09. Planning for special events was the third highest scoring question overall in the 2009 TIM SA and is the question with the highest percentage (88 percent) of scores 3 or higher.
The score for this question is the aggregated average of individual scores in planning for the following types of events: Construction and Maintenance; Sporting Events, Concerts, Conventions; Weather-related Events and Catastrophic Events. Among those categories, Sporting Events, Concerts, Conventions (4.1.2.4.b) and Construction and Maintenance (4.1.2.4.a) achieved the highest mean scores of 3.27 and 3.15, respectively. The advanced notice of these events affords opportunities for planning, resulting in higher scores. However, planning for Weather-related Events and Catastrophic Events continues to lag, even though these events pose greater safety risks and have a higher likelihood of impacting larger segments of the general population. The relative infrequency of these events in most jurisdictions likely results in less advance planning.
The presence of a formalized TIM multi-agency team (Figure 4) which regularly meets (4.1.2.1) received a mean score of 2.63. Though "regularly" is not defined, the comments provided point to meetings held on a monthly or quarterly basis.
The training conducted by the TIM teams (4.1.1.2) is primarily NIMS training, with very few respondents indicating training on the NTIMC National Unified Goal (NUG). Scores in NUG training can be expected to increase in 2010 and subsequent years when the TIM Responder Training being developed as part of the Strategic Highway Research Program (SHRP II) is deployed. The Emergency Responder Safety Institute and the I-95 Corridor Coalition are also developing training based on key NUG objectives. Other types of training referenced in the comments included defensive driving, use of photogrammetry and responder safety.
Post-incident debriefing scores (4.1.2.3) continue to increase, achieving a mean score of 2.53 in 2009. The comments indicate that the debriefings typically occur after large incidents only and in many cases, are conducted by individual agencies and not as a multi-agency initiative.
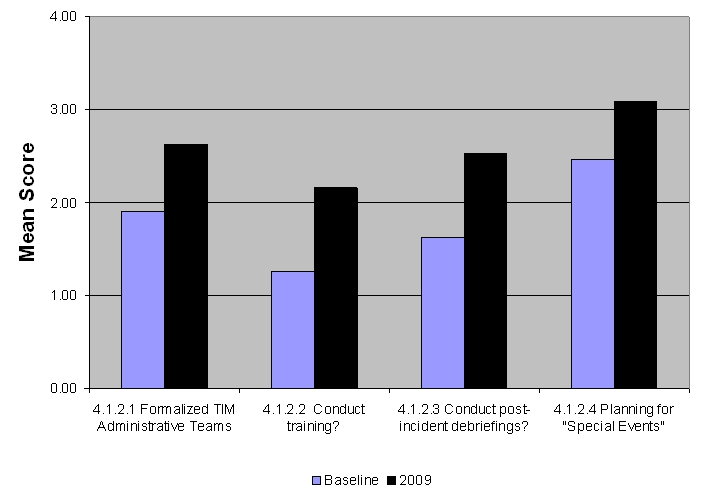
Figure 4. Multi-agency TIM Teams
TIM Performance Measurement (4.1.3) scores continue to be the lowest in the TIM SA. None of the five questions in this subsection has yet to score above 2. However, the questions in this subsection also continue to achieve the greatest percentage increase over the Baseline (Figure 5). Of the two measures, multi-agency agreement on tracking Incident Clearance Time scored higher (1.70) than multi-agency agreement on tracking Roadway Clearance Time (1.63). The third measure identified in the FHWA TIM PM FSI is tracking reductions in secondary incidents (4.1.3.5). The score of 1.03 for this question will serve as its Baseline as previous assessments have not queried the existence of this measure. The inability to link incidents to one another was cited in the comments as one reason for the low Baseline score. The issue of responder liability was also mentioned as a potential impediment to tracking secondary incidents.
The addition of the secondary incident question in 2009 and its low baseline score had an impact on the overall score for this subsection. Nonetheless, the mean score for TIM Performance Measurement (1.63) has more than doubled since the Baseline (0.80).
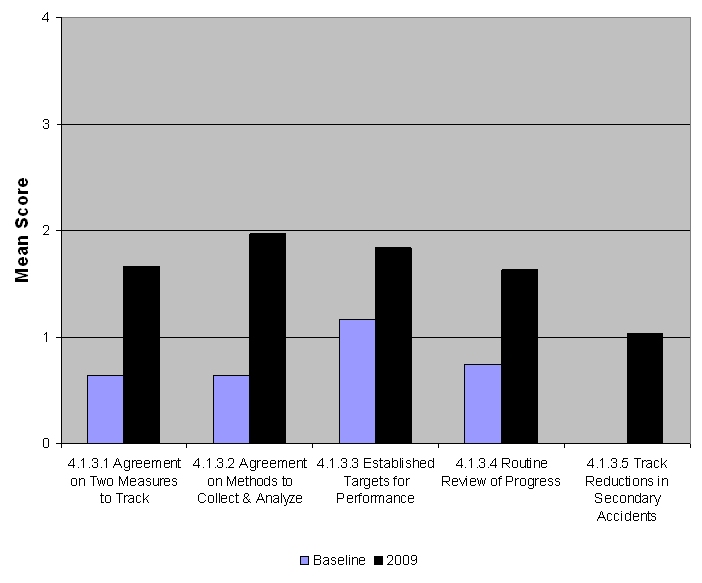
Figure 5. Traffic Incident Management Performance Measurement
The TIM programs achieving the highest scores in Strategic program areas are listed alphabetically in Table 8.
| TIM Program |
|---|
| Jacksonville, Florida Hampton Roads, Virginia Orlando, Florida St. Petersburg-Clearwater, Florida Suburban DC (Virginia) Tampa, Florida |
Results - Tactical
Mean Score: 68.8% (27.5 of 40 points)
The questions in Tactical focus on operational or on-scene activities and policies. Prior to the TIM SA Revision, Tactical issues were grouped into three subsections, including one on Procedures for Major Incidents and another on Response and Clearance Policies and Procedures. Recognizing that NIMS and ICS do not make the distinction between incident response actions, policies or procedures based on incident severity level, incident response policies and procedures are now queried in one subsection. The third subsection, Responder and Motorist Safety, was retained in the TIM SA Revision.
As a group, the questions in Tactical continue to score the highest in the TIM SA, achieving a 68.8 percent in 2009, more than 19 percent over the Baseline (Table 9).
| Year | Mean Score |
|---|---|
| Baseline | 57.6 |
| 2006 | 65.0 |
| 2007 | 66.0 |
| 2008 | 66.2 |
| 2009 | 68.8 |
Figure 6 shows the change from the Baseline for the two subsections in Tactical. Though the questions in Policies and Procedures (4.2.1) have the highest average score (2.89) of the two subsections, Responder and Motorist Safety (4.2.2) achieved a higher percentage (47.7) increase over the Baseline..
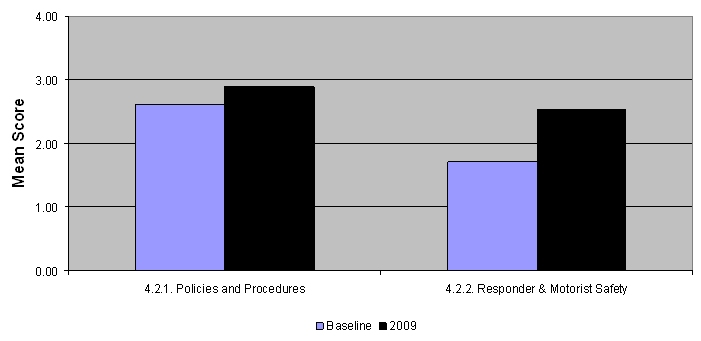
Figure 6. Tactical
Prior to the TIM SA Revision, quick clearance laws and polices were queried in one question in the subsection on Response and Clearance Policies and Procedures. The comments appended to that question often indicated confusion on the part of respondents as to the question's intent; Move Over laws, which provide responder safety, were typically referenced rather than the quick clearance laws allowing driver removal or authority removal.
A total of four new questions were added to the Tactical section as part of the TIM SA Revision. Three of the new questions ask about specific safe, quick clearance (SQC) laws:
- Authority Removal (4.2.1.1);
- Driver Removal (4.2.1.2);
- Move Over (4.2.2.1).
By specifically asking which laws are in place in each responding location, the revised TIM SA eliminates confusion on the part of respondents and provides ongoing direction for FHWA's SQC Outreach and Education. Question 4.2.2.1 on Move Over laws received the highest mean score (3.20) in the 2009 TIM SA, indicating a high degree of success in promulgating Move Over laws. Therefore, the SQC Outreach and Education can instead focus on greater awareness of and compliance with Move Over laws rather than the rationale for Move Over legislation. In the case of authority removal and driver removal, the lower scores indicate a need for the outreach effort to highlight the rationale for deployment as well as awareness and compliance.
| Question Number |
Question | Mean Score Range = 0 to 4 | % of Assessments Scoring 3 or Higher | % Change in 2009 Mean Scores from Baseline |
||
|---|---|---|---|---|---|---|
| Baseline | 2009 | Baseline | 2009 | |||
| 4.2.1.1 | Have “authority removal” laws allowing pre-designated responders to remove disabled or wrecked vehicles and spilled cargo? | -- | 2.92 | -- | 67% | -- |
| 4.2.1.2 | Have “driver removal” laws which require drivers involved in minor crashes (not involving injuries) to move vehicles out of the travel lanes? | -- | 3.01 | -- | 71% | -- |
| 4.2.1.3 | Utilize the Incident Command System? | 2.73 | 3.10 | 67% | 83% | 13.7% |
| 4.2.1.4 | Utilize the Incident Command System? | 2.55 | 3.08 | 58% | 76% | 20.8% |
| 4.2.1.5 | Have response equipment pre-staged for timely response? | 2.21 | 2.81 | 41% | 62% | 27.3% |
| 4.2.1.6 | Identify and type resources so that a list of towing, recovery and hazardous materials response operators (including operator capabilities and special equipment) is available for incident response and clearance? | 2.86 | 3.08 | 67% | 74% | 7.7% |
| 4.2.1.6a | a. Is that list organized so that resources are identified and deployed based on incident type and severity? | -- | 2.64 | -- | 58% | -- |
| 4.2.1.7 | Have specific policies and procedures for hazmat and fatal accident response that also address maintaining traffic flow around the incident? | 2.71 | 2.5 | 62% | 56% | -7.7% |
| 4.2.2.1 | Have “move over” laws which require drivers to slow down and if possible move over to the adjacent lane when approaching workers or responders and equipment in the roadway? | -- | 3.20 | -- | 85% | -- |
| 4.2.2.2 | Train all responders in traffic control procedures? | 1.97 | 2.48 | 28% | 51% | 25.7% |
| 4.2.2.3 | Utilize transportation resources to conduct traffic control procedures in compliance with the MUTCD? | 1.93 | 2.72 | 27% | 57% | 41.0% |
| 4.2.2.4 | Utilize traffic control procedures for the end of the incident traffic queue? | 1.56 | 2.28 | 17% | 49% | 46.1% |
| 4.2.2.5 | Have mutually understood equipment staging and emergency lighting procedures on-site to maximize traffic flow past an incident while providing responder safety? | 1.38 | 1.95 | 14% | 33% | 41.6% |
The 2007 TIM SA National Analysis Report identified an issue with the use of pre-identified resources for incident clearance and hazardous materials response (4.2.1.3), which has continued in the 2008 TIM SAs. For the third year in a row, question 4.2.1.3 has the highest mean score of the 34 TIM SA questions. In 2008, the score increased to 3.20, with 86 percent of respondents scoring this question a 3 or higher (Figure 7).
However, question 4.2.3.3 asks respondents to rate the use of policies and procedures for hazardous materials (HAZMAT) response, which also address traffic flow. For the third year in a row, this question has seen a decrease in the mean score, down to 2.73, representing a 5.6 percent decrease from the Baseline score of 2.89.
Identifying or typing resources for hazardous materials response is only part of the equation; effectively deploying those resources is critical to safely and quickly clearing the incident scene and restoring traffic flow. A continued decline in the score for policies and procedures to do so is a significant concern.
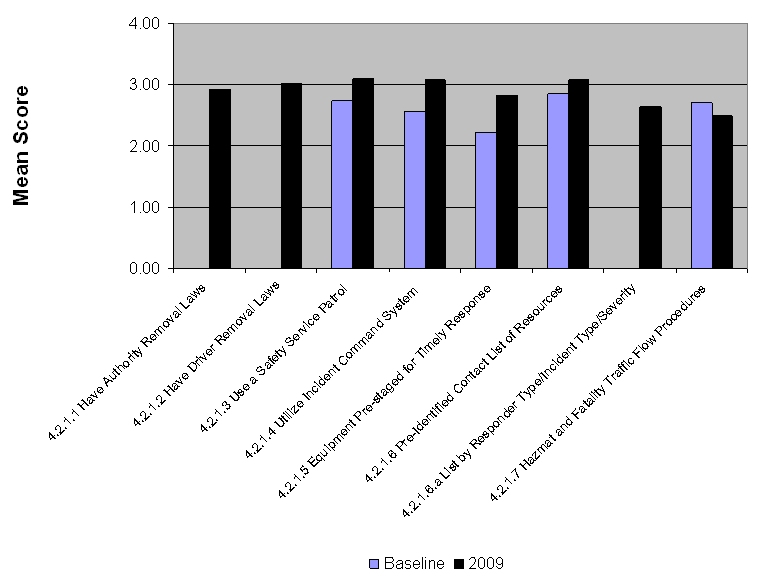
Figure 7. Policies and Procedures
The only question in the 2009 TIM SA to experience a lower mean score than its Baseline score was question 4.2.1.7 on specific policies and procedures for hazmat and fatal accident response (Figure 7). This continues a trend evident over the past several years of the TIM SA. Despite high scores in the identification and typing of resources for incident and hazardous materials response (4.2.1.6), the effective deployment of those resources through specific hazardous materials and fatal incident response policies and procedures is not as prevalent. Increased dissemination and use of FHWA's 2009 Traffic Incident Management in Hazardous Materials Spills in Incident Clearance primer containing specific best practices and procedures should result in increased scores for 4.2.1.7.1
With a mean score of 3.10, the use of safety service patrols for incident and emergency response (4.2.1.3), ranked second highest of all questions in the 2009 TIM SA. This reverses a trend noted in the 2008 National Analysis Report when nearly 10 percent of TIM SA respondents scored this question 0, indicating little, if any, progress toward the use of safety service patrols by those locations. This year, the percentage of TIM SA respondents scoring this question 0 is less than five percent.
The use of safety service patrols for incident response has numerous benefits including:
- Expedited response and clearance by operators trained in incident response, clearance and traffic control;
- Improved resource utilization as first responders are freed to focus on more traditional activities for which they are uniquely trained (law enforcement, fire/rescue, etc.).
The comments submitted with this question indicate that safety service patrols are generally operating during peak travel times only and are not yet operating 24/7. These service patrols would meet the definition of Baseline or Mid-Level Service Patrols, as described in FHWA's 2008 Service Patrol Handbook.2 The move to Full-Function Service Patrols (FFSP) is a key metric for FHWA and one that can be tracked through subsequent year TIM SA scores for question 4.2.1.3. The Service Patrol Handbook provides guidance on migrating service patrols to full-function. Additionally, FHWA's SQC Outreach and Education will populate the messages and outreach materials necessary to convince decision-makers to dedicate resources to FFSP deployment.
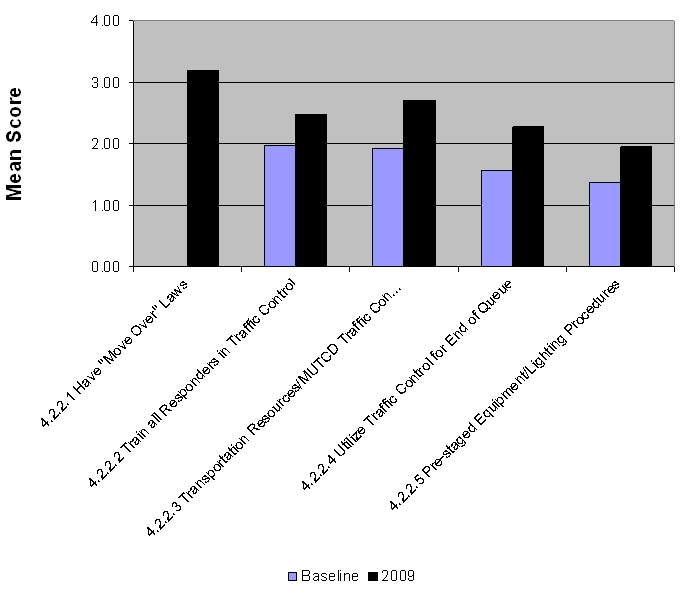
Figure 8. Responder and Motorist Safety
Safely moving traffic past an incident scene is key to protecting the safety of responders and motorists. Traffic control is the subject of the remaining four questions in this subsection. Question 4.2.2.2 asks about training responders in traffic control procedures. With a mean score of 2.48, just over half (51 percent) of the TIM SA respondents scored this question 3 or higher. The comments indicate that training, when conducted, is done by individual agencies and not coordinated across agencies. In some cases, the training provided is nothing more than on-the-job experience, creating increased risks for responders and motorists alike.
The use of MUTCD-compliant traffic control procedures (4.2.2.3) received a mean score of 2.72, representing a 41 percent increase over Baseline. However, the comments point to greater adherence by transportation responders than by other agency responders. This is an area where additional multi-agency training (like the SHRP II TIM Responder Training) may fill a void.
The TIM programs achieving the highest scores in Tactical program areas are listed alphabetically in Table 11.
| TIM Program |
|---|
| Hampton Roads, Virginia Knoxville, Tennessee Louisville, Kentucky Orlando, Florida Suburban DC (Virginia) |
Results – Support
Mean Score: 59.0% (17.7 of 30 points)
The questions in Support focus on the tools and technologies enabling improved incident detection, response and clearance. The 2009 TIM SA groups the questions into the following subsections:
- Data Collection/Integration/Sharing: These questions focus on how responders and support personnel (TMCs/TOCs) use transportation management systems (TMS) to collect, integrate and exchange incident information.
- Traveler Information: These questions focus on providing motorists with accurate and timely incident information to influence traveler behavior.
Previously, the TIM SA had three subsections in Support: Integrated Interagency Communications; Transportation Management Systems; and Traveler Information. The first two were combined in the 2008 TIM SA Revision to reflect the increasing interdependence between interagency communications and the technologies to support those communications.
The questions in Support collectively continue to experience the largest increase over the Baseline, up 42.8 percent (Table 12). In the 2008 National Analysis Report it was noted that scores in this section would likely level off or possibly decline due to the significant resource needs of these technologies coupled with dwindling state budgets. In 2009, the overall average scores for this group of questions did decline slightly from 59.4 to 59.0. When the six first-time TIM SA locations are removed from the analysis, the decline is even more pronounced. For the 80 re-assessments in 2009, the overall Support score declined to 57.7.
| Year | Mean Score |
|---|---|
| Baseline | 41.3 |
| 2006 | 57.1 |
| 2007 | 57.5 |
| 2008 | 59.4 |
| 2009 | 59.0 |
Figure 9 shows that of the two subsections, Traveler Information (4.3.2) had the higher score (2.52) and experienced the highest increase over Baseline (74.2 percent).
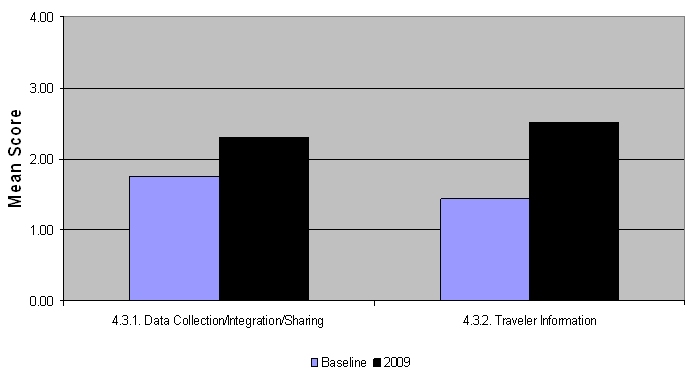
Figure 9. Support
Each of the questions in Support is listed in Table 13, with the Baseline mean score, the 2009 mean score, the percentage change and the percentage of assessments scoring each question 3 or higher. There is one new Support question (4.3.1.2) in 2009, which asks if public safety is co-located with transportation in the Traffic Management Center/Traffic Operations Center (TMC/TOC). As with all new questions in the 2009 TIM SA, there is no baseline score for this question. The 2009 average score 1.88 will be used as the Baseline score in subsequent TIM SA analyses.
| Question Number |
Question | Mean Score Range = 0 to 4 | % of Assessments Scoring 3 or Higher | % Change in 2009 Mean Scores from Baseline |
||
|---|---|---|---|---|---|---|
| Baseline | 2009 | Baseline | 2009 | |||
| 4.3.1.1 | Does the TIM program use a Traffic Management Center/Traffic Operations Center (TMC/TOC) to coordinate incident detection, notification and response? | 1.98 | 3.05 | 41% | 72% | 53.9% |
| 4.3.1.2 | Is public safety co-located with transportation in the TMC/TOC? | -- | 1.88 | -- | 41% | -- |
| 4.3.1.3 | Has the TIM program achieved TMC-CAD integration so that incident data and video information is transferred between agencies and applications? | 1.98 | 3.05 | 41% | 72% | 53.9% |
| 4.3.1.4 | Does the TIM program have specific policies and procedures for traffic management during incident response (i.e. signal timing changes, opening/closing of HOV lanes/ramp metering)? | 1.55 | 2.02 | 18% | 29% | 30.5% |
| 4.3.1.5 | Does the TIM program provide for interoperable, interagency communications on-site between incident responders? | 1.61 | 2.36 | 17% | 47% | 46.6% |
| 4.3.2.1 | Have a real-time motorist information
system providing incident-specific information?
|
1.90 | 2.91 | 27% | 78% | 53.0% |
| 4.3.2.2 | Are motorists provided with travel time estimates for route segments? | 0.99 | 2.13 | 12% | 42% | 114.9% |
In the Data subsection, the highest scoring question is 4.3.1.1 on the use of a TMC/TOC to coordinate incident detection, notification and response. The average score in 2009 is 3.05 and nearly three-quarters (72 percent) of respondents scored this question 3 or higher. Additionally, the score represents a 53.9 percent increase over the Baseline.
However, lower scores throughout this section indicate that the potential of TMCs/TOCs is not yet being fully realized (Figure 10). Of the locations scoring the TMC/TOC question 3 or higher, over a third (37 percent) do not yet have public safety co-located in the center. This co-location of transportation and public safety resources is a key indicator of success in data sharing and improved incident response. Another key indicator of success, TMC-CAD integration (4.3.1.3) is also lagging behind. Of the locations scoring the TMC/TOC question 3 or higher, nearly 13 percent do not yet have TMC-CAD integration.
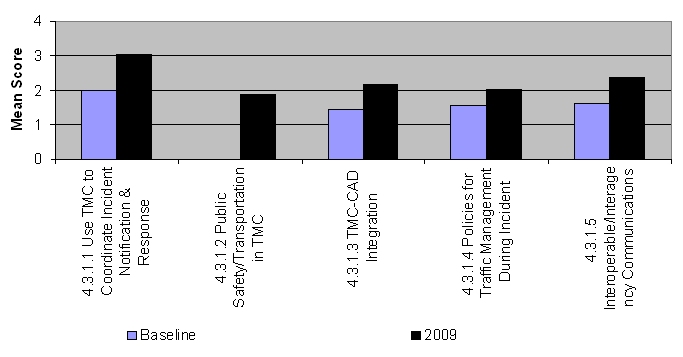
Figure 10. Data Collection/Integration/Sharing
Figure 11 below shows the changes in scores from the Baseline for the two questions in Traveler Information (4.3.2). The average score for question 4.3.2.1 is a composite score of three sub-questions regarding traveler information delivered via 511 (4.3.2.1.a), traveler information website (4.3.2.1.b) or through traffic media access to TMC/TOC data/information (4.3.2.1.c). Of the three types, 511 is the least utilized; 27.9 percent indicate little to no activity in 511 deployment/utilization.
The provision of travel time estimates to motorists (4.3.2.2) achieved one of the highest percentage increases in 2009 from the Baseline (114.9 percent). However, the mean score still remains in the lower range (2.13) and 36 percent of the TIM SA respondents indicated little to no activity in this area. Where travel time estimates are being provided to motorists, changeable message signs (CMS)/dynamic message signs (DMS) are the primary means for delivering that information based on the comments.
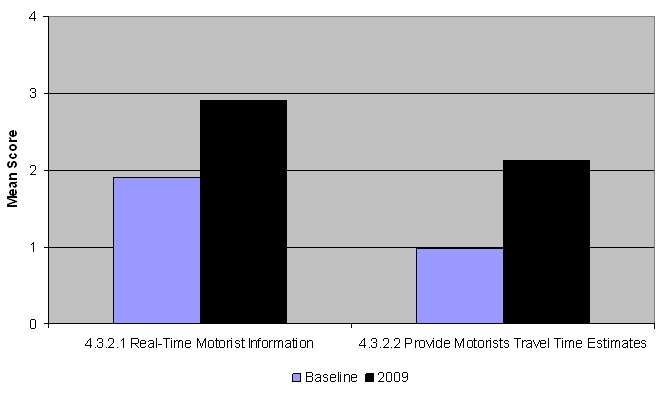
Figure 11. Traveler Information
The TIM programs achieving the highest scores in Support program areas are listed alphabetically in Table 14.
| TIM Program |
|---|
|
Cincinnati, Ohio Jacksonville, Florida Oregon (Statewide) Orlando, Florida St. Petersburg-Clearwater, Florida Tampa, Florida |
Opportunities for FHWA
A primary objective of the TIM SA is to identify those program areas where resources can be deployed to address TIM program gaps, both at the local level and nationally. First and foremost in the gap analysis is a review of the questions achieving the lowest mean scores. However, additional opportunities for FHWA are apparent in a review of program areas achieving little change in mean score from year to year and in those where the mean score may be declining.
TIM Performance Measures
Four of the five questions achieving the lowest mean scores in 2009 are in TIM Performance Measurement. The lowest score overall was achieved in secondary incident tracking (4.1.3.5). The lack of technical capabilities to link incidents was cited as one of the primary drivers for the lower scores. The lack of a consistent definition of "secondary incident" and the liability concerns that arise from quantification of secondary incidents are also cited as challenges in the ability to track performance in this area.
FHWA has already accomplished much in the area of TIM Performance Measurement. The TIM PM Focus States Initiative led to the identification of the two consensus measures queried in the post-revision TIM SA; incident clearance time and roadway clearance time. The TIM PM FSI also resulted in the tracking of secondary incident performance as a third metric.
The planned launch of the TIM PM Knowledge Management System (KMS) later this year should facilitate greater awareness of TIM PM and how it is accomplished. FHWA should capitalize on the TIM PM KMS and its Listserv function to further disseminate TIM PM best practices and technical guidance. The TIM PM KMS may also facilitate consensus building on secondary incident definitions.
Safety Service Patrols
The use of safety service patrols received one of the highest scores in the 2009 TIM SA, reversing a trend noted in the 2008 National Analysis Report. While the majority of TIM SA respondents indicate use of (or progress toward the use of) safety service patrols, limitations on the functionality of those patrols continue. Based on the comments submitted, resources are not available to migrate the service patrols to full-function. FHWA should utilize the SQC Outreach and Education initiative to build greater understanding among decision-makers of the critical role of FFSP and of the quantifiable return-on-investment provided by FFSP.
HAZMAT Response Policies and Procedures
The 2008 National Analysis Report recommended dissemination of HAZMAT response best practices as a means for increasing the scores on question 4.2.1.7. FHWA has since released its primer on TIM in Hazardous Materials Spills3 and should focus now on increased dissemination of the primer. Additionally, this topic would be appropriate for an educational webinar hosted by FHWA and potentially coordinated through the NTIMC.
Leveraging Other Programs
There are a number of concurrent efforts underway that can and should be leveraged to improve TIM performance, and therefore, increase TIM SA scores.
National Traffic Incident Management Coalition
The NTIMC, representing the broad range of TIM stakeholders, should be utilized to build greater awareness of the TIM SA and to actively engage in the development and dissemination of outreach, education and training to address issues identified in the gap analysis. As noted above, the NTIMC can partner with FHWA in a webinar focused on HAZMAT response best practices.
Similarly, the NTIMC membership should be engaged in the development and vetting of outreach messages on safety service patrols. As has been done previously with FHWA products like the TIM Handbook, NTIMC members can review and provide comment on products coming out of the SQC Outreach initiative.
NCHRP 20-7 (282) Research Needs Assessment for Roadside Worker and Vehicle Visibility
This research initiative, to launch in late 2009, is designed to develop a comprehensive, multiyear research program roadmap to improve visibility and conspicuity within work zones and at incident scenes; improve highway user response to the presence of first responder and roadway personnel and vehicles; and contribute to more effective multidisciplinary solutions for responder safety in keeping with the goals of the TIM National Unified Goal (NUG). The first task will be a gap analysis of existing research in this area. The TIM SA results will be reviewed as part of that gap analysis.
The research program roadmap developed will include collection and dissemination of best practices for improving responder and motorist safety. This will include best practices targeting incident scene traffic control procedures (questions 4.2.2.2 - 4.2.2.5).
Traffic Incident Management Responder Training
Several new TIM responder training courses are under development which could be leveraged for improving TIM program performance and subsequently TIM SA scores. The Strategic Highway Research Program (SHRP II) Traffic Incident Responder Training will be ready for deployment in 2010. Likewise, the I-95 Corridor Coalition is finalizing a three-dimensional, multi-player computer gaming simulation technology to train incident responders on best practices. These training efforts can be utilized to improve the knowledgebase and performance in specific TIM program areas where the TIM SA identifies a need through lower and/or decreasing scores. Additionally, as a result of both training initiatives focusing on the National Unified Goal objectives of safe, quick clearance, responder safety and prompt, reliable, interoperable communications, increased deployment of the training should raise scores on Question 4.1.2.2 on NUG training.
What to Expect in 2010
The 2010 TIM SA process will include several improvements resulting from the use of the online portal. Participants in the 2009 TIM SA were sent a summary report of their responses to each question, allowing for review and revision prior to the start of the analysis. When the 2010 TIM SA is initiated, the 2009 summary reports will be resent as a reference to the TIM SA point of contact (POC) for each location. Knowing how each question was scored previously, along with reviewing any comments submitted the year prior should allow for more objective evaluation of progress year over year.
Additionally, upon completion of the 2010 online TIM SA, participants will be sent a 2010 summary report to review and provide any revisions or additional comments prior to the 2010 analysis.
Based on feedback from the 2009 TIM SA training webinars and to more closely align the TIM SA questions with the actual performance measures being tracked by FHWA and the states, a review of the questions will be conducted prior to the 2010 TIM SA launch. It is probable that this review will result in minor revisions to the TIM SA questions, though the overall structure of the TIM SA will not change.
Summary
A total of 86 TIM SA were completed in 2009, with an average overall score of 60.6 percent (out of a possible 100 percent). Overall scores are up 31.9 percent over the Baseline scores. The highest scores were achieved in Operational Issues (68.8 percent) and the largest percentage increase in scores from the Baseline was in Support (42.8 percent).
Tables 15 and 16 show the highest and lowest mean scores, respectively. Both sets of questions, along with the largest change in mean score (Table 17) and smallest change in mean score (Table 18) present both challenges and opportunities for FHWA. Specifically, the 2009 TIM SA scores highlight a need for additional guidance in the following areas:
- Safety Service Patrols
- Hazardous Materials Response Policies and Procedures
- TMC-CAD Integration
The 2009 TIM SA is the first to identify top performing locations in each of the three program areas in order to facilitate peer-to-peer networking among all TIM SA respondents. Other opportunities for advancing TIM program success and improving TIM SA scores are available through the NTIMC, the TIM Responder Training in development as part of the Strategic Highway Research Program (SHRP II) and the upcoming NCHRP 20-7 (282) Research Needs Assessment for Roadside Worker and Vehicle Visibility.
Additionally, FHWA programs and publications which target specific issue areas in the TIM SA should be leveraged, including:
- TIM Performance Measures Knowledge Management System and Listserv
- Safe, Quick Clearance Outreach and Education
- Traffic Incident Management Quick Clearance Laws: A National Review of Best Practices
- Safe, Quick Clearance Primer Series
- Traffic Incident Management in Hazardous Materials Spills in Incident Clearance
- Traffic Control Concepts for Incident Clearance
- Service Patrol Handbook
| Mean Score Rank in 2009 / Baseline | Question Number | Question | 2009 Mean Score (n=86) | % Scoring 3 or Higher (2009) | % Change in 2009 /Baseline Mean Scores |
|---|---|---|---|---|---|
| 1/-- | 4.2.2.1 Tactical | Have "move over" laws which require drivers to slow down and if possible move over to the adjacent lane when approaching workers or responders and equipment in the roadway? | 3.2 | 85% | -- |
| 2/2 | 4.2.1.3 Tactical | Use a safety service patrol for incident and emergency response? | 3.1 | 83% | 13.70% |
| 3/5 | 4.1.2.4 Strategic | Conduct planning for special events? | 3.09 | 88% | 25.00% |
| 4/4 | 4.2.1.4 Tactical | Utilize the Incident Command System? | 3.08 | 76% | 20.80% |
| 4/1 | 4.2.1.6 Tactical | Identify and type resources so that a list of towing, recovery and hazardous materials response operators (including operator capabilities and special equipment) is available for incident response and clearance? | 3.08 | 74% | 7.70% |
| Mean Score Rank in 2009/ Baseline | Question Number | Question | 2009 Mean Score (n=86) | % Scoring 3 or Higher (2009) | % Change in 2009/ Baseline Mean Scores |
|---|---|---|---|---|---|
| 31/-- | 4.1.3.5 Strategic | Track performance in reducing secondary incidents? | 1.03 | 8% | -- |
| 30/23 | 4.1.3.4 Strategic | Routinely review whether progress is made in achieving the targets? | 1.63 | 26% | 120.00% |
| 29/24 | 4.1.3.1 Strategic | Have multi-agency agreement on the two performance measures being tracked (roadway clearance time and incident clearance time)? | 1.66 | 26% | 159.80% |
| 28/19 | 4.1.1.2 Strategic | Is there a process in place to ensure the continuity of these agreements / memoranda of understanding through integrated planning and budgeting across and among participating agencies? | 1.79 | 28% | 32.60% |
| 27/21 | 4.1.3.3 Strategic | Have targets (i.e. time goals) for performance of the two measures? | 1.84 | 33% | 58.40% |
| Mean Score Rank in 2009/Baseline | Question Number | Question | 2009 Mean Score (n=86) | % Scoring 3 or Higher (2009) | % Change in 2009 Mean Scores from Baseline |
|---|---|---|---|---|---|
| 24/24 | 4.1.3.2 Strategic | Has the TIM program established methods to collect and analyze the data necessary to measure performance in reduced roadway clearance time and reduced incident clearance time? | 1.97 | 33% | 207.00% |
| 29/24 | 4.1.3.1 Strategic | Have multi-agency agreement on the two performance measures being tracked? | 1.66 | 26% | 159.80% |
| 30/23 | 4.1.3.4 Strategic | Routinely review whether progress is made in achieving the targets? | 1.63 | 26% | 120.00% |
| 22/22 | 4.3.2.2 Support | Are motorists provided with travel time estimates for route segments? | 2.13 | 42% | 114.90% |
| 20/20 | 4.1.2.2 Strategic | Conduct training?
|
2.16 | 49% | 71.70% |
| Mean Score Rank in 2009/ Baseline | Question Number | Question | 2009 MeanScore (n=86) | % Scoring 3 or Higher (2009) | % Change in 2009 Mean Scores from Baseline |
|---|---|---|---|---|---|
| 15/3 | 4.2.1.7 Tactical | Have specific policies and procedures for hazmat and fatal accident response that also address maintaining traffic flow around the incident? | 2.5 | 56% | -7.70% |
| 4/1 | 4.2.1.6 Tactical | Identify and type resources so that a list of towing, recovery and hazardous materials response operators (including operator capabilities and special equipment) is available for incident response and clearance? | 3.08 | 74% | 7.70% |
| 2/2 | 4.2.1.3 Tactical | Use a safety service patrol for incident and emergency response? | 3.1 | 83% | 13.70% |
Table 19 shows the urban areas completing the TIM SA each year since the Baseline assessments in 2003 and 2004.
| State – Urban Area | 2003 | 2004 | 2005 | 2006 | 2007 | 2008 | 2009 |
|---|---|---|---|---|---|---|---|
| AK | NA | RA | |||||
| AL – Birmingham | B | RA | RA | RA | RA | RA | |
| AR – Little Rock | B | RA | RA | RA | RA | RA | |
| AZ – Phoenix | B | RA | RA | RA | RA | ||
| AZ – Tucson | B | RA | RA | RA | RA | ||
| CA – Bakersfield - Fresno | RA | ||||||
| CA – Los Angeles | B | RA | |||||
| CA – Orange County | NA | ||||||
| CA – Sacramento | B | ||||||
| CA – San Bernardino-Riverside | NA | ||||||
| CA – San Diego | B | RA | RA | ||||
| CA – San Francisco | B | RA | RA | ||||
| CO – Denver | B | RA | RA | RA | RA | RA | |
| CT – Hartford | B | RA | RA | RA | RA | RA | |
| DC – Washington | B | RA | RA | RA | RA | RA | |
| FL – Ft. Lauderdale | B | RA | RA | RA | RA | ||
| FL – Miami-Dade | B | RA | RA | RA | RA | ||
| FL – Jacksonville | B | RA | RA | RA | RA | ||
| FL – Orlando | B | RA | RA | RA | RA | ||
| FL – Sarasota-Bradenton | B | RA | RA | RA | |||
| FL – St. Petersburg-Clearwater | B | RA | RA | ||||
| FL – Tampa-Hillsborough | B | RA | RA | RA | |||
| FL – West Palm Beach | B | RA | RA | RA | RA | ||
| GA – Atlanta | B | RA | RA | RA | RA | ||
| HI – Honolulu | B | RA | RA | RA | RA | ||
| IL – Chicago | B | RA | RA | RA | RA | RA | |
| IN – Indianapolis | B | RA | RA | RA | RA | RA | |
| KY – Lexington | NA | RA | RA | ||||
| KY – Louisville | B | RA | RA | RA | RA | ||
| LA – Baton Rouge | B | RA | RA | RA | RA | ||
| LA – New Orleans | B | RA | RA | RA | RA | ||
| MD – Baltimore | B | RA | RA | RA | RA | RA | |
| MD – Suburban Wash DC | B | RA | RA | RA | RA | RA | |
| MA – Boston | B | RA | RA | RA | RA | ||
| MA – Springfield | NA | RA | RA | RA | |||
| ME – I-95 Corridor | NA | RA | |||||
| MI – Detroit | B | RA | RA | RA | RA | RA | |
| MI – Grand Rapids | B | RA | RA | RA | RA | RA | |
| MN – Minneapolis | NA | ||||||
| MO – Kansas City | B | RA | RA | RA | RA | RA | |
| MO – St. Louis | B | RA | RA | RA | RA | RA | |
| MS | NA | ||||||
| NE – Omaha | B | RA | RA | RA | RA | RA | |
| NJ – (Statewide) | NA | ||||||
| NV – Las Vegas | B | RA | RA | RA | RA | RA | |
| NM – Albuquerque | B | RA | RA | RA | RA | RA | |
| NY – Albany | B | RA | RA | RA | RA | RA | |
| NY – Buffalo | B | RA | RA | RA | RA | RA | |
| NY – New York | B | RA | RA | RA | RA | RA | |
| NY – New York-North NJ | NA | ||||||
| NY – Rochester | B | RA | RA | RA | RA | RA | |
| NY – Syracuse | B | RA | RA | RA | RA | RA | |
| NC – Charlotte | B | RA | RA | RA | RA | RA | |
| NC – Greensboro-WS-HP | B | RA | RA | RA | RA | RA | |
| NC – Raleigh-Durham | B | RA | RA | RA | RA | RA | |
| OH – Cincinnati | B | RA | RA | RA | RA | RA | |
| OH – Cleveland | B | RA | RA | RA | RA | RA | |
| OH – Columbus | B | RA | RA | RA | RA | RA | |
| OH – Dayton | B | RA | RA | RA | RA | RA | |
| OH – Toledo | B | RA | RA | RA | RA | RA | |
| OH – Youngstown | B | RA | RA | RA | RA | RA | |
| OK – Oklahoma City | B | RA | RA | RA | RA | ||
| OK – Tulsa | B | RA | RA | RA | RA | ||
| OR – Portland | B | RA | RA | RA | RA | RA | |
| PA – Allentown-Bethlehem | B | RA | RA | RA | RA | ||
| PA – Harrisburg | B | RA | RA | RA | RA | ||
| PA – Philadelphia | B | RA | RA | RA | RA | RA | |
| PA – Pittsburgh | B | RA | RA | RA | RA | RA | |
| PA – South New Jersey | NA | RA | |||||
| PA – Wilkes Barre-Scranton | B | RA | RA | RA | RA | ||
| PR – San Juan | B | RA | RA | RA | RA | RA | |
| RI – Providence | B | RA | RA | RA | |||
| SD (Statewide) | NA | ||||||
| SC – Greenville-Spartanburg | B | RA | RA | RA | RA | ||
| SD (Statewide) | NA | RA | |||||
| TN – Chattanooga | NA | RA | RA | ||||
| TN – Knoxville | B | RA | RA | RA | RA | RA | |
| TN – Memphis | B | RA | RA | RA | RA | RA | |
| TN – Nashville | B | RA | RA | RA | RA | RA | |
| TX – Austin | B | RA | RA | RA | RA | RA | |
| TX – Dallas-Ft. Worth | B | RA | RA | RA | RA | RA | |
| TX – El Paso | B | RA | RA | RA | RA | RA | |
| TX – McAllen (Pharr Dist) | B | RA | RA | RA | |||
| TX – Houston | B | RA | RA | RA | RA | RA | |
| TX – San Antonio | B | RA | RA | RA | RA | RA | |
| UT – Salt Lake City | B | RA | RA | RA | RA | RA | |
| VA – Norfolk-Virginia Beach | B | RA | RA | RA | RA | RA | |
| VA – No. VA-Sub. Wash DC | B | RA | RA | RA | RA | RA | |
| VA – Richmond | B | RA | RA | RA | RA | RA | |
| WA – Seattle | B | RA | RA | RA | RA | RA | |
| WI – Milwaukee | B | RA | RA | RA | RA | RA | RA |
| WV (Statewide) | NA | ||||||
| WY (Statewide) | NA | RA | |||||
| Legend: B = Baseline. RA = Re-assessment. NA = New assessment. | |||||||
1 U.S. Department of Transportation, Federal Highway Administration. Traffic Incident Management in Hazardous Materials Spills in Incident Clearance. January, 2009. https://ops.fhwa.dot.gov/publications/fhwahop08058/default.htm
2 U.S. Department of Transportation, Federal Highway Administration. Service Patrol Handbook. November, 2008. https://ops.fhwa.dot.gov/publications/fhwahop08031/ffsp_handbook.pdf.
3 U.S. Department of Transportation, Federal Highway Administration. Traffic Incident Management in Hazardous Materials Spills in Incident Clearance. January, 2009. https://ops.fhwa.dot.gov/publications/fhwahop08058/default.htm
 You will need the Adobe Acrobat Reader to view the PDFs on this page.