Empirical Studies on Traffic Flow in Inclement Weather
6.0 Recommendations for Next Phase of Study
The study of the impact of inclement weather on traffic flow thus far has provided insight into the limitations of existing data and the resulting analysis and gaps in existing research, as well as a vision for future exploration of the topic. This section will outline the direction for research in the next phase of the study.
6.1 Lessons Learned from Completed Research
High-quality traffic and weather data is critical to accurate analysis of the effects of inclement weather on traffic flow and driver behavior. The data must be accurate, complete and representative of the geographic, functional (i.e., freeways, arterials), and geometric (i.e., grades, curves) areas of interest. In this phase, researchers were limited by the extent of existing traffic and weather data collection. Better, more comprehensive data will result in better modeling and analysis.
In addition, information on roadway surface conditions is critical to an accurate analysis of inclement weather impacts on traffic flow and driver behavior. Consequently, video or roadway sensors are required to gather roadway surface conditions.
In many major metropolitan areas, traffic sensor data are collected and archived. However data quality is not always as high as desired. It is important that the sensors and communications equipment are maintained and data are reviewed regularly for quality control.
Weather data collected by state DOT’s and other transportation agencies are typically not as robust as the traffic data. While meteorological concerns are often considered in the siting of Environmental Sensor Stations (ESS), they are most often used for winter maintenance activities, and as a result, are located with those needs in mind. The availability of communications and power are also important considerations and compromises from the ideal location may be necessary. Some agencies are now trying to colocate new ESS with traffic counting stations, but for the most part they are not found in the same locations. One of the major problems with using DOT ESS data in this project was that many ESS only report the presence of precipitation, not the rate. Therefore the data have limited utility.
The study has shown that while traffic and weather data sets are often sufficient for day-to-day operations, the combination of the two data sets is lacking for analysis of this detail and sensitivity. Therefore, it is recommended that the current study – evaluating the macroscopic traffic flow parameters – be replicated with better, complimenting, sets of traffic, weather, and roadway surface data.
Enhancement of Macroscopic Analysis
The macroscopic analysis conducted for this project should be enhanced through a data collection procedure as outlined below:
- Select sites with dual loop detectors that collect high-quality and robust traffic data elements of volume, speed, and occupancy. The set of locations should provide enough uniformity to have a large data set and enough variety of functional classification or geometric configuration to provide direction for further research.
- Place ESS near traffic loop detectors. The ESS should have a weather sensors, a roadway surface sensor, and a video detection system to collect atmospheric (temperature, precipitation, visibility, wind) and pavement condition (pavement temperature, surface condition) environmental data. It is important to use roadway surface conditions when evaluating the impact of inclement weather on traffic flow to capture the true conditions of the roadway (e.g., wet, slushy, icy) and consider splash from vehicles.
- Collect traffic and weather data during dry, rainy, and winter conditions. A potential source of both traffic and weather data is VTTI’s Mobile Traffic Laboratory (MTL), a fully self-contained modular laboratory that provides real-time traffic data, such as traffic volume, vehicle speed, lane occupancy, and pedestrian detection. The MTL van is equipped with a weather station that measures wind speed, direction, temperature, relative humidity, and rainfall. In addition, the van is equipped with an Autoscope Solo Pro™ wide-area video vehicle detection system, an Autoscope Image Sensor™ (AIS), a pneumatic mast (13.71-meter maximum raised height) with color pan/tilt/zoom cameras, a computer system, and a videocassette player/recorder. The equipment racks are easily configurable and the MTL has a modular design that allows for extension and enhancement. A mobile collection approach will enable the collection of relevant field data at multiple geographic locations.
Additionally, there were a number of research issues identified in the research synthesis report that were not adequately studied in the current research due to data restrictions:
The Impact of Precipitation on Macroscopic Traffic Flow Indicators on a Wide Range of Facilities
After a review of existing sources during the development of the data collection plan it did not appear that arterial data could be obtained that meet the criteria above. Most arterial detectors are located at intersections making it difficult to calculate average speeds along a stretch of highway. Speed and volume data are also difficult to obtain on nonurban stretches of arterial roadway. While only freeways will be included in this analysis, different types of freeway facilities will be incorporated into the study. One potential categorization is by function, with the hypothesis that radial and circumferential/crosstown freeways may experience different impacts from adverse weather. More likely is that the size of the facility will result in different traveler responses to weather events. As a result, the study tried to incorporate different freeway capacities into the analysis, including four-lane, six-lane, and eight-lane sections. While there was some variation in the freeways sampled, including both radial and circumferential highways, the number of stations observed was not adequate to identify differences in behavior. A good research goal for the future would also be to analyze adverse weather impacts on different types of roadway geometry. Given the relatively sparse distribution of RWIS in most metropolitan areas this analysis would require collection and analysis of additional observations from a dense network such as the NWS Cooperative Observer program.
Study of Regional Differences in Reaction to Precipitation
The limitation of this study to three cities limited the ability to draw conclusions about regional differences in driver response to adverse weather. Given the limited number of cities and detector stations, it was difficult to isolate the impact of weather events from other factors such as roadway geometry, signing and in the case of snow, winter maintenance. A more thorough analysis of regional differences will require a larger sample of cities with more detailed data from each.
Study the Macroscopic Impacts of Reduced Visibility
Some of the RWIS stations identified for this study included visibility sensors. The findings related to visibility are documented in Section 5 but conclusions are limited due to the limited number of locations studied and lack of refinement in some of the sensor data. More detailed analysis is needed in the future to separate the impact of fog from other factors. This is clearly an important area of emphasis but it is not clear whether there are adequate data to support this analysis.
6.2 Microscopic and Human Factors Analysis
In addition to refining the macroscopic analysis with better data, future research on weather-sensitive traffic flow modeling should focus on individual driver behavior and resulting vehicle movements under different weather and pavement conditions. Proposed microscopic and human factors analyses are outlined below.
Empirical evidence regarding the microscopic effects of weather on individual drivers is deficient in the literature. Similarly, research into human factors has been limited to vehicle safety investigations, with minimal consideration of traffic flow. These gaps in research provide a need and motivation to study both microscopic parameters (i.e., desired speed, acceleration, minimum gap acceptance, and lane changing) and human factors (i.e., reaction times, demographics, driver workload). The following tasks will focus on enhancing knowledge in this field.
Use of Existing Naturalistic Driving and NGSIM Data
The Federal Highway Administration is collecting a significant amount of detailed vehicle trajectory and driver behavior data as part of the Next Generation Simulator (NGSIM) Project. Additionally, previous work in developing driver behavior models has resulted in numerous, detailed vehicle data. Subsets of this data can be extracted and analyzed to characterize driver longitudinal motion in clear, rainy, and snowy weather conditions. The trajectory data should be augmented with historical ASOS weather data. If the dataset includes inclement weather conditions then an analysis of driver behavior during inclement weather conditions could be compared to driver behavior during clear conditions to establish differences in driver behavior.
In addition to the NGSIM data, a number of naturalistic Field Operational Test (FOT) data sets are available. The 100-Car Study was the first instrumented-vehicle study undertaken with the primary purpose of collecting large-scale naturalistic driving data. Drivers were given no special instructions, no experimenter was present, and the data collection instrumentation was unobtrusive. In addition, the majority of the drivers drove their own vehicles (78 out of 100 vehicles). The dataset contains data at 10 HZ for many extreme cases of driving behavior and performance, including severe drowsiness, impairment, judgment error, risk taking, willingness to engage in secondary tasks, aggressive driving, and traffic violation.
The data collection effort resulted in the following dataset contents: a) approximately 2 million vehicle miles of driving, b) almost 43,000 hours of data, c) 241 primary and secondary driver participants, d) 12- to 13-month data collection period for each vehicle; 18-month total data collection period, e) 15 police-reported crashes, f) 67 non-police-reported crashes (some producing no damage), g) 761 near-crashes, h) 8,295 incidents, and i) five channels of video and many vehicle state and kinematics variables.
If the naturalistic driving data are augmented with weather and pavement data, it will be possible to study the effect of inclement weather on driver behavior.
Acceleration, lane changing and gap acceptance models should be evaluated for differences based on varying precipitation and visibility conditions.
Controlled Field Studies
In addition, vehicle trajectory data and driver behavior/response data should be collected from instrumented vehicles in a controlled field study to model individual decisions drivers make under different weather conditions. We recommend that a combination of controlled field and naturalistic driver studies be conducted as part of the next phase of the project.
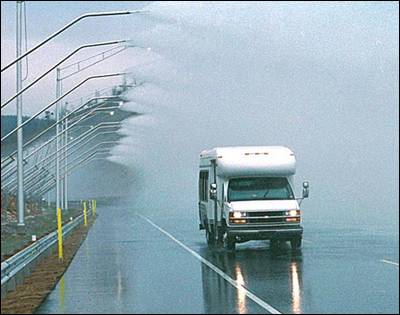
The Smart Road, a 3.5 kilometer fully instrumented two-lane road in southwest Virginia, is a joint project of the Virginia Department of Transportation (VDOT), VTTI, and the FHWA. The facility is an operational test-bed for detailed, real-world performance of vehicles in a controlled environment. It is a real roadway environment that has the capability to generate and monitor all types of weather and pavement conditions. Data will be collected on drivers under generated weather conditions of rain, snow, and dense fog. DGPS will be utilized to track exact trajectories of test vehicles and in-vehicle camera systems will be used to record driver reactions. Environmental monitoring stations will record conditions on the roadway. The facility has the following unique capabilities:
- All-Weather Testing Capability. The facility is capable of producing rain, snow, and a fog-like-mist over a one-half-mile stretch of roadway. At maximum output, the system produces up to five inches of rain per hour and 10 inches of snow per hour. A 500,000-gallon water tank feeds the system and allows for multiple research events. The all-weather testing towers are automatically controlled and can produce rain and snow at multiple intensities. In addition, water can be sprayed by the towers onto freezing pavement to create icy conditions.
- Environmental Monitoring. VTTI has installed a permanent visibility sensor and three weather stations to provide direct data for operational conditions to the research staff. Available data includes temperature, humidity, wind speed, wind direction, and visibility measured in miles. These data are used in conjunction with the All Weather Testing section to provide quantitative measurements of test conditions as subjects complete research tasks.
- On-Site Data Acquisition Capabilities. The roadway has an underground conduit network with manhole access every 60 meters. This network houses a fiber optic data network and interfaces with several on-site data acquisition systems. The facility also has a complement of Road Weather Information Systems (RWIS) stations connected to the data network. The fiber network has an interface with a card that will allow RWIS data to be transmitted via wireless communications.
- Wet Visibility Section. VTTI recently constructed a Wet Visibility road section that runs alongside a section of the Smart Road. This roadway section is a “crownless” road: it has no arch in the middle and runs as flat across as is possible. On such a road, water will not drain off onto the sides and will pool in the middle. This section of roadway is being used to test pavement markings in wet-weather conditions. This two-lane road connects with the Smart Road intersection. It joins the intersection on the opposite side of the Smart Road and runs parallel to the Smart Road up to the first turnaround. In addition, 35 portable rain towers were constructed to be used along the wet visibility section.
- In-House Differential GPS System. Precise vehicle location can be tracked on the road with a military-grade global positioning systems (GPS) base-station. This system can track the location of a vehicle on the road to 2.0-centimeter accuracy at four samples per second, or 5.0-centimeter accuracy at 10 samples per second.
- Surveillance Camera Systems. In 2001, VTTI installed a complete video surveillance system consisting of nine permanently mounted, low-light color cameras. Also on hand are two portable cameras that can be moved to any location on the roadway for project-specific needs. Six of the cameras use dedicated fiber optic links to transmit video and data signals to the control room. The cameras are fed directly to the Smart Road Control Room and monitored by staff. VTTI has the ability to pan/tilt/zoom all of the cameras via custom software on the video wall computer.
- Variable Lighting Test Bed. VTTI and Virginia DOT, in conjunction with FHWA, developed a highway lighting test bed on the Smart Road. The system consists of overhead light poles with the following spacing: 40-20-20-40-40-20-20-40-40-20-20 meters. This spacing, combined with wiring the poles on three separate circuits, allows for evaluating lighting systems at 40, 60, or 80 meters. The poles incorporate a modified design to allow for easy height adjustment of the bracket arm. In addition to evaluating spacing and bracket height, various luminaries are available as well, including metal halide and high-pressure sodium. If desired, differing levels of roadway lighting also can be simulated concurrently with the variation in visibility produced by the all-weather testing equipment. This allows a multitude of visibility conditions to be created, on demand, for testing purposes.
Figure 6.1 Image of Smart Road Weather Making Capabilities
These data will be used to estimate differences in microscopic models in varying weather conditions, especially different precipitation and visibility combinations.
Pretrip Driver Decisions
A survey should be developed and conducted to determine how weather events and forecasts impact driver’s pretrip decisions, including departure time, route choice, expected travel time, and aggressiveness. There are several options for conducting such a survey. One is a traditional telephone survey that would identify regular commuters and ask them about their use of pretrip information. A survey conducted by Cambridge Systematics for Michigan DOT asked commuters in the Detroit region whether they used pretrip information to change their time of departure or route of travel. The survey found bad weather to be one of the major factors in the decision to change departure time but much less of a factor in changing route choice. It also indicated that the sensitivity to weather information is much greater during the a.m. peak commute than the p.m. peak commute. This is an expected result since weather is less likely to vary by route than traffic conditions.
Table 6.1 Reasons for Changing Routes
West Sector (Washtenaw, Livingston and Western Wayne Counties, Michigan)
Reasons for Changing Routes |
A.M. Commute |
P.M. Commute |
|---|---|---|
Traffic Accident or Incident |
57% |
51% |
Roadway Construction |
38% |
40% |
Normal Traffic Congestion |
23% |
27% |
Bad Weather |
4% |
2% |
Business or Personal Reasons |
2% |
5% |
Don’t Know/No Reason |
[no value] |
2% |
Source: Michigan ITS Predeployment Study: West Sector Report, prepared by Cambridge Systematics and Kimley-Horn Associates for Michigan DOT, 2003.
Table 6.2 Reasons for Changing Departure Time
West Sector (Washtenaw, Livingston and Western Wayne Counties, Michigan)
Reasons for Changing Departure Time |
A.M. Commute |
P.M. Commute |
|---|---|---|
Traffic Accident or Incident |
51% |
35% |
Roadway Construction |
22% |
35% |
Normal Traffic Congestion |
29% |
39% |
Bad Weather |
24% |
8% |
Business or Personal Reasons |
10% |
4% |
Don’t Know/No Reason |
2% |
4% |
Source: Michigan ITS Predeployment Study: West Sector Report, prepared by Cambridge Systematics and Kimley-Horn Associates for Michigan DOT, 2003.
This survey was focused on general uses of ITS and also obtained information on how commuters might value different types of emerging technology and new information sources. Table 6.3, for example, summarized commuters’ ranking of various technologies and information sources on a scale of 1 to 10.
Table 6.3 Stated Importance
Total Sample (Oakland, Genessee, Washtenaw, Livingston, Monroe, Western Wayne and southern Wayne Counties, Michigan)
and West Sector (Washtenaw, Livingston and Western Wayne Counties, Michigan) Results
Stated Importance |
Total Sample |
West Sector |
|---|---|---|
Obtaining traffic information from a variety of sources, like the radio and TV |
8.3 |
8.3 |
Obtaining information about alternate routes as a result of accidents, congestion or weather |
8.3 |
8.5 |
Having a device in your vehicle to automatically call an emergency number during an accident |
8.1 |
7.7 |
Providing continuous traffic advisory information on a dedicated radio station |
8.0 |
7.9 |
Having immediate access to traffic information in your vehicle |
7.8 |
7.9 |
Using electronic highway message signs to obtain traffic information |
7.5 |
7.4 |
Having immediate access to traffic information at home |
7.3 |
7.1 |
Having a collision avoidance device in your vehicle |
7.2 |
7.1 |
Providing automatic traffic and accident reports on a device in your vehicle |
6.9 |
7.0 |
Having a device in your vehicle that gives maps and directions |
6.8 |
6.9 |
Obtaining information on public transportation at home or at work |
6.2 |
6.0 |
Using a toll-free mobile phone to obtain traffic information |
5.8 |
5.4 |
Offering a customized paging service that gives traffic information about routes you take |
5.6 |
5.2 |
Accessing traffic information on the Internet |
4.4 |
4.2 |
Source: Michigan ITS Predeployment Study: West Sector Report, prepared by Cambridge Systematics and Kimley-Horn Associates for Michigan DOT, 2003.
This chart indicates the importance of alternate route information to commuters and also indicates that it is the information that is important, not the technology that delivers it.
A survey focused on weather response would expand on some of these questions and use some of the questions used in previous studies that are documented in the literature search in Section 2. In particular, the survey effort should attempt to obtain more detail on what type of weather phenomena impact pretrip decisions and what level of detailed information is desired. For example, do commuters respond to generalized regional forecasts or are they more likely to respond to maps showing estimated snowfall totals around the region? What is the best way to express the impact of weather on road conditions? One method may be to read a weather forecast or road weather information scenario to the respondent and ask them whether they would modify their trip based on that forecast. This method could be used in a focus group setting as well as a phone survey.
It is important to note that other methods are now available for collecting data on traveler pretrip preferences. While most of them would not achieve the statistical validity found in a survey sample, they could be less expensive and still provide strong insight into customer preferences:
Web Site Surveys – Volunteers may be solicited from regular users of traveler information web sites. They would be asked to report any changes in their trip patterns based on weather and traffic information. The data could provided directly over the Internet.
E-mail Surveys – A preselected group of commuters could be e-mailed on a daily basis to obtain information on their use of pretrip information and their travel habits.
In-Vehicle Devices – Volunteers could be solicited among subscribers to in-vehicle information and navigation services. They could report their trip patterns, such as time of departure on a daily basis, and this could be matched against weather data for that time period.
Another important consideration is the geographic scope of such surveys. They may be more effective if concentrated in a small number of cities that represent a range of climates. While this study may be location-specific, it also may identify some overlying trends in how weather impacts driver behavior prior to entering the vehicle.
| Previous Section | Next Section | Home | Top