|
|
|
Travel Time Reliability:
Making It There On Time, All The Time
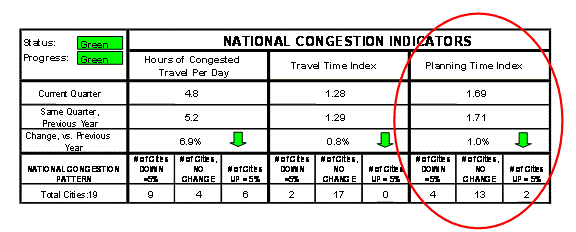
This figure shows a table that is titled "National Congestion Indicators" and has a column highlighted that is titled "Planning Time Index." This column has rows that correspond to the planning time index for the current quarter, the same quarter in the previous year, and the percent change versus the previous year. The bottom row shows the number of cities where the planning time index increased, decreased, or had no change.
Figure 8. A reliability measure is included in FHWA's Monthly Congestion Dashboard Report.
