An Assessment of the Expected Impacts of City-Level Parking Cash-Out and Commuter Benefits OrdinancesExecutive SummaryFor many workers, the decision to drive to work is an economically rational one that minimizes their commute costs. Shoup (1997) estimated that nationwide, 95 percent of commuters receive free parking at work.1 Compare this to data from the U.S. Bureau of Labor Statistics (BLS) (2021a) that only 9 percent of private industry employees, on average, have access to subsidies to help them pay transit, vanpool, or bicycle commute costs. In many cases, the value of free parking can be substantial; for example, in New York City, the cost of a monthly parking pass in the central business district (CBD) is $655, while even in a mid-sized city such as San Diego, California, the cost is $138 per month (Parkopedia 2020). In most cases, the value of free parking is greater than the cost of riding transit. In effect, employers are incentivizing a behavior that increases roadway congestion, reduces physical activity, and increases emissions. Moreover, since lower-income households are less likely to own and have access to a private vehicle than moderate and higher-income households (FHWA 2020), free parking is a financial benefit that many lower-income employees cannot access. Data from the U.S. BLS (2021b) shows that only 3 percent of employees earning the lowest 10 percent of wages have access to subsidized commuting benefits, compared to 20 percent of employees earning in the highest 10 percent of wages. Multiple strategies exist to level the playing field among travel modes, provide more equitable benefits, and support more environmentally friendly options. The USDOT’s FHWA developed this report to understand the congestion, emissions, crashes (i.e., safety), and equity impacts that may result from parking cash-out, pre-tax commuter benefits, and related policies. The report is part of the agency’s ongoing efforts to increase awareness of solutions to address the transportation issues affecting communities in the United States. It was created in coordination with a peer review group made up of representatives from academic institutions and the public sector who provided guidance throughout the study process. BackgroundParking Cash-OutParking cash-out is an option that provides employees with a more balanced set of benefits across all modes of transportation. With parking cash-out, employers that provide free or subsidized parking at work also offer employees the option to take an equivalent cash payment, tax-free transit benefit, or tax-free vanpool benefit instead of the parking subsidy. As discussed in the report, this strategy can be (but is not always) revenue neutral for employers while allowing employees to make travel choices that are the most sensible for them. Shoup (1997) studied eight firms in southern California and found that the implementation of parking cash-out policies resulted in a 13 percent reduction in drive-alone commute trips and a 12 percent reduction in commute vehicle-miles traveled (VMT). In a study similar to Shoup’s, Van Hattum (2009) examined seven employers that implemented parking cash-out programs in the Minneapolis-St. Paul area and found a 12 percent reduction in single occupancy vehicle (SOV) travel. Likewise, Glascock, Cooper & Keller (2003) found a 10 percent reduction in employee parking demand resulting from parking cash-out in Seattle. Outside the U.S., De Borger and Wuyts (2009) found parking cash-out to be associated with a nearly 9 percent reduction in driving commutes and a 17 percent increase in transit use based modeled Belgian data. Due to its potential to affect travel behavior, multiple government agencies have adopted legislation that encourages or requires employers to offer cash-out to their employees. California, Rhode Island, and Washington, D.C., have laws that require some employers to offer parking cash-out. Other States, including Maryland, Colorado, Delaware, Connecticut, Oregon, and New Jersey use their tax codes to encourage employers to implement parking cash-out programs (MDOT, 2021; Liston et al., 2022; U.S. Environmental Protection Agency (EPA), 2005). Employer-Paid Commuter BenefitsAs a qualified transportation fringe benefit under the Tax Cuts and Jobs Act, Pub. L. No. 115-97, employers may pay up to $280 per month (as of 2022) for their employees’ transit or vanpool commuting (as is also the case for employee parking expenses2) without any payroll tax or employee income tax obligation being incurred.3 Employer-provided transit benefits have been demonstrated to result in an increase in the number of employees using transit. A 2005 Transit Cooperative Research Program analysis of 21 surveys conducted in 12 regions from 1989 to 2004 found that employer-paid transit passes generally increase transit ridership 10 percent or more at participating worksites (ICF and Center for Urban Transportation Research (CUTR), 2005). Pre-Tax Commuter BenefitsRather than pay for employee commute expenses, an employer can allow employees to set aside their own income on a pre-tax basis to pay for qualified transit or vanpool expenses. As with employer-paid commuter benefits, the pre-tax benefit is also limited to $280 (as of 2022) per month for transit and vanpool costs. Employees save money by reducing their transit and vanpool costs by an amount equal to their marginal tax rate, often 15 percent to 35 percent when accounting for State and Federal income taxes and Social Security and Medicare taxes. In California, the cities of San Francisco, Richmond, and Berkeley have laws that require employers to offer employees the option to set aside pre-tax dollars for the purchase of transit passes or to pay vanpool expenses (San Francisco Department of the Environment, 2022; City of Richmond 2022; City of Berkeley 2022). Employers that implement these programs save costs on payroll taxes. By reducing out-of-pocket costs for riding transit or vanpools to work, pre-tax commuter benefits can increase the use of these travel modes. Additionally, employers and employees may benefit from transit- or vanpool-based commuting compared to solo driving, as employees are able to use commute time riding these modes more productively. Results from the Metropolitan Washington Council of Governments’ (MWCOGs’) State of the Commute survey (2020) showed that more than half of commuters surveyed who traveled to work via carpool/vanpool or transit (bus and train) performed work-related tasks during their commute. The rate was highest for transit commuters (58 percent) compared to carpoolers/vanpoolers (38 percent). As suggested in the MWCOG survey, employers may benefit from additional productive time employees are able to spend during a transit commute, while employees may benefit from having additional time to catch up on work tasks, making actual time spent at the workplace less stressful. ScenariosThis report analyzes the vehicle travel, congestion, emissions, crashes, and equity impacts that city-level parking cash-out, commuter benefit, and related ordinances4 can have. Cities were selected based on criteria that prioritized those where substantial impacts were expected (i.e., large drive-alone employee populations, higher-priced parking, or high propensity to use transit) and the availability of data to support the analysis. The analyzed cities are as follows:
Five core policy scenarios were analyzed for nine cities, with the goal of providing a resource for municipalities considering enacting parking cash-out and related policies. The scenarios are meant to provide an overview of potential policy options cities can pursue with regard to cash-out and commuter benefits. The core scenarios analyzed include:
AnalysisThe scenarios were analyzed independently using unique methodologies that included some shared assumptions and methods. Scenario 1 served as a baseline for much of the analysis. Impacts associated with Scenario 1 were estimated two ways. First, impacts were estimated using the Trip Reduction Impacts for Mobility Management Strategies (TRIMMS) model, which was developed by the University of South Florida (CUTR, 2018). This methodology applies estimated changes in the costs of parking to estimate mode shifts. In cities with low initial drive-alone rates, the shift to non-drive-alone modes seemed unreasonably high, likely due to an internal calculation within the TRIMMS model that accounts for initial mode share. To overcome this issue, a second methodology was used to calculate resulting mode shares for Scenario 1 impacts. The second methodology calculated travel behavior change directly using a demand elasticity of -0.30. The elasticity value was selected after significant literature review and in coordination with the peer review group. The mode share results derived from the two methodologies were averaged to arrive at a single value. Then, VMT reductions were estimated using the average mode shares along with vehicle trip length, occupancy, and employee population data. The impacts of Scenarios 2 through 5 were estimated using results or methodologies from Scenario 1. The impacts of daily cash-out were estimated to facilitate an additional 16 percent shift away from driving alone compared to monthly cash-out based on results from a study of a form of daily cash-out in Minneapolis (Lari et al., 2014). The impacts of pre-tax commuter benefits were estimated manually using a transit elasticity of -0.15 (reflecting the response of transit use in relation to a change in transit price), which was similarly selected after significant literature review and in coordination with the peer review group. The methods applied in this report assume that employers will fully adopt and comply with hypothetical ordinances and that no transit capacity restrictions interfering with mode shifts to transit will occur. Baseline data were collected for each city and included work-trip mode split, average auto commute trip length, monthly parking prices, and the percentage of employees with access to free parking. The analysis assumed expected near-term conditions associated with commuting patterns accounting for post-COVID-19 pandemic telework expectations (i.e., assumes a higher level of telework than data showed for cities pre-COVID). ResultsTable 1 and figure 1 show the reductions in daily commute-related VMT that were estimated for each scenario and each city. Results are shown with respect to citywide commute-related VMT, not just for affected commuters.
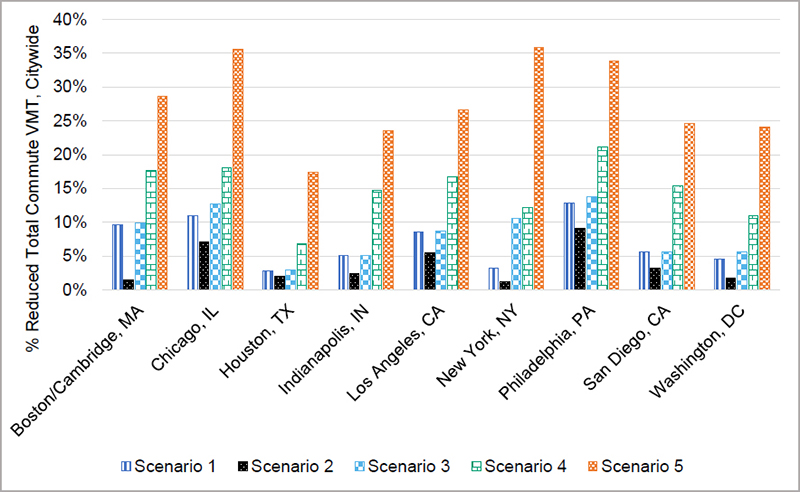
Source: FHWA. A bar graph with the y-axis as the percentage reduced total commute VMT, citywide and the x-axis showing Boston/Cambridge, Chicago, Houston, Indianapolis, Los Angeles, New Work, Philadelphia, San Diego, and Washington DC results for each scenario. For Scenario 5, Chicago saw a 36% reduction in the daily citywide commute VMT. The data in this bar graph is shown in full in Table 1.
The impacts vary by scenario and city based on a range of factors, including parking prices, transit fares, and the share of employees receiving free/subsidized parking and transit benefits.
Across all scenarios, it is clear that strategies designed either to make employer-provided commute incentives mode neutral or to specifically disadvantage drive-alone commute trips could have a significant impact on vehicle travel associated with employee commute trips. Scenario 1, the basic monthly cash-out requirement, reduces commute-related VMT by an average of over 7 percent across all analyzed cities, with wide variation among the cities—from about a 3 percent reduction in New York City, where few employees currently receive free parking, to a 13 percent reduction in Philadelphia. Daily versus monthly cash-out policies may yield greater impacts. Given that most of this reduction would occur during peak commute hours, the potential of parking cash-out to reduce congestion and minimize other negative externalities associated with vehicle travel is significant. Impacts on other driving-related externalities (i.e., congestion, emissions, and crashes) generally reflect the observed patterns of VMT reduction when comparing scenarios within each city. Namely, Scenario 5 achieves the greatest impacts to reduce congestion, emissions, and crashes given its high VMT reduction potential relative to other scenarios. In addition to maximizing VMT reduction potential, Scenario 5 is also thought to maximize the benefits offerings across the analyzed scenarios, given the equal distribution of non-SOV benefits between employees receiving and not receiving free parking (especially where the lowest-income commuters may be less frequently offered free parking as a commuter benefit). 1 More recent data from the Society for Human Resource Management (SHRM) estimates that 87% of employers offer free on-site parking for their employees (SHRM 2022). While this figure may be slightly different from the number of employees offered free on-site parking, this demonstrates that the vast majority of employees are likely still offered free on-site parking since Shoup’s 1997 study. [ Return to Note 1 ] 2 Federal law allows these benefits to be combined if, for example, an employee would incur costs to park at a transit station and also to use transit. [ Return to Note 2 ] 3 Federal tax laws underwent some changes in tax year 2018 as a result of the December 2017 enactment of Pub. L. No.115-97. Prior to 2018, an employer could also deduct the expense of providing these benefits from its taxes. [ Return to Note 3 ] 4 FHWA has no position on any ordinance discussed or whether an ordinance should be adopted. [ Return to Note 4 ] 5 Note that pre-tax transit laws typically allow employees to pay for both vanpools and transit service in a pre-tax manner. In estimating the impact of pre-tax transit benefits for employees without subsidized workplace parking, Scenarios 3 and 4 relied on a transit elasticity reflecting changes in transit ridership specifically with respect to transit costs. Given this was a transit-specific measure, it was applied only to estimate changes in transit ridership (vs. transit/vanpool ridership) for this population under this policy. The research team expected such results to be reasonable, even with vanpool impacts unaccounted for, given low (<1%) starting vanpool mode shares for this population. Additional information on methodologies can be found in this report’s main body, as well as in Appendix C. Data And Analysis Methodology. [ Return to Note 5 ] | |||||||||||||||||||||||||||||||||||||||||||||||||||||||||||||
|
United States Department of Transportation - Federal Highway Administration |
||