Approaches for Communicating Third Performance Management Rule Measures, Metrics, and Targets
Chapter 2. Sample Communication Approaches
This chapter provides approaches for communicating PM3 measures, metrics, and targets, including those used by the Michigan DOT (MDOT), the North Jersey Transportation Planning Authority (NJTPA), and a pair of agencies in Virginia.
Michigan Department of Transportation
MDOT reports PM3 measures among other measures of delay and reliability at the corridor level in a Congestion and Reliability Performance Report subdivided by region.5 The reports not only provide LOTTR maps for freeways and speed profiles over the day, but also explain these measures graphically in an introduction. The reports are produced in collaboration with Wayne State University annually through a process that has been automated, with macros generating new reports when National Performance Management Research Data Set (NPMRDS) data is provided.
The content in the reports emerged from approximately 100 initial ways to slice and dice the data. Key measures were selected based on several desired qualities:
- Legibility to MDOT employees.
- Accessibility to the public.
- Ease of reproduction.
- Importance of information.
MDOT chose to pull some measures out of the report when the underlying data sources were changing too frequently. The department worried that if the answer to, “Why did this number change?” was the fact that the data itself was in flux, it would undermine confidence in the entire report. MDOT also responded to the changes in underlying data by setting conservative performance targets.
Beyond the reports, MDOT uses LOTTR as a scoring metric for Transportation Systems Management and Operations and infrastructure project selection and post facto before-and-after analysis of project work. Some local governments and MPOs also use all three CMAQ measures in their investment strategies. Before-and-after project analysis using the PM3 measures allows staff to explain impacts in real terms. Previously, “money was always going toward roads.” With these added metrics, staff can ask, “Is this really the best project we could come up with?”
MDOT has found that reliability and delay measures are easier to communicate to the public when they are at the project or corridor level, as any impact felt statewide would be too small in magnitude to be meaningful to most people. MDOT also has found that the public understands dollars and cents more readily than hours. When communicating internally, MDOT reported that the most frequent question is: How will I be held responsible for this?
When the PM3 measures were first introduced, the responsible working groups generated short fact sheets on the measures that the interview participants still reference today to remind themselves how the metrics are calculated.
North Jersey Transportation Planning Authority
NJTPA personalized a PM3 metric with its 5-minute video explaining the PHED CMAQ traffic congestion measure in plain English.6 NJTPA personalized PHED by directly connecting it to a hypothetical family's daily travel and using clear, effective visuals.
In general, NJTPA has folded PM3 measures into its internal planning and communications, reducing duplicative explanations to stakeholders, though the authority supplements its communications with other measures as needed. It is from NJTPA that the research team was cautioned on congestion as an inevitable consequence of a healthy economy: It’s not wasted money if it’s supporting your economy.
In addition to the PHED video, NJTPA also developed visualizations, a fact sheet on each measure, and slide decks to communicate PM3, including an online dashboard.7 NJTPA encourages taking a less technical approach, assuming a less technically informed audience, and augmenting with detail when audiences can handle it. NJTPA also uses contextual details and trends to understand measures where a full-time series is not available: Can we get an idea of where this might go?
Virginia Department of Transportation and Virginia Office of Intermodal Planning and Investment
Two agencies in Virginia—the Virginia Department of Transportation (VDOT) and the Virginia Office of Intermodal Planning and Investment (collectively to be referred to as Virginia)—have developed a complementary suite of measures to describe highway performance. The agencies have responded to their concerns with how to communicate around some elements of PM3 measures, including the dynamic nature of reliability over time (i.e., the fact that both the numerator and denominator are variables); the tendency of TTTR to identify the overnight hours as the “most congested” period on rural Interstates (note that TTTR is the metric that is used in calculating the freight reliability measure); and the large amount of rural highway mileage in Virginia that the PM3 measures register as reliable, which is in disagreement with the VDOT’s understanding of many Virginians’ lived experience. All three concerns underpin key messages in chapter 3.
Virginia attempts to communicate the error inherent in the PM3 metrics—particularly TTTR—that are developed from multiple data sources (e.g., annual changes to roadway segmentation, also known as Traffic Message Channel [TMC], length in NPMRDS, 2-year lag for annual average daily traffic from the Federal Highway Administration (FHWA) Highway Performance Monitoring System, and inaccuracy in speed limit records). The research team observes that Virginia reports the PM3 measures with error bars, but this can be confusing once a target is set because the target is not met when the top error bar passes it, and targets can be missed by small intervals when the margin of error is large.
The Virginia Office of Intermodal Planning and Investment leads quarterly meetings with MPOs to discuss Federal and non-Federal performance measures. Virginia holds training sessions for MPOs to walk them through how underlying assumptions impact results and estimates and to establish a consistent computational approach.
East-West Gateway Council of Governments
The East-West Gateway Council of Governments (EWGCOG), which is the MPO responsible for the St. Louis, MO metropolitan area, communicates the first performance management rule (PM1), second performance management rule (PM2), and PM3 measures to the public via its public-facing website. Within the system performance page, the MPO provides its PM3 measures in a simplified, infographic-type format, effectively communicating them to all types of audiences.8 For instance, the use of histograms to visualize on-road mobile source emissions helps viewers understand the distribution of different emissions sources. Commonly known graphics, such as those of passenger vehicles and Interstate and State highway symbols, help viewers recognize the data they are being presented.
Figure 1 presents similar graphics, placing various PM3 conditions and targets together with other PM3 measures.
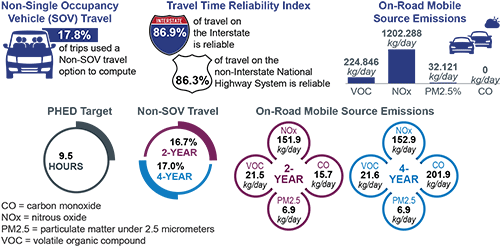
Figure 1. Infographic. Metropolitan Planning Organizations system performance.
(Source: FHWA. Adapted from EWGCOG
>.)9
Georgia Department of Transportation
The Georgia Department of Transportation (GDOT) presents its PM3 measures and targets through performance period progress reports, the results of which are summarized on the FHWA State Performance Dashboards web site.10 One approach GDOT uses is to visualize their measures and targets via scorecards. A version of how these scorecards can be used is shown in figure 2 using GDOT data. The scorecard presents various PM3 targets and measures simultaneously. Certain design choices, such as the use of checkmarks and directional arrows, provide viewers with an easier understanding of trend directions and goal-setting progress. Combined with the use of histograms to show the data behind the measures, the scorecards incorporate good visualization principles to communicate progress on PM3 measures. Aside from an improved understanding of overall performance, the inclusion of targets and forecast trends can inform future target setting and transportation investment prioritization.
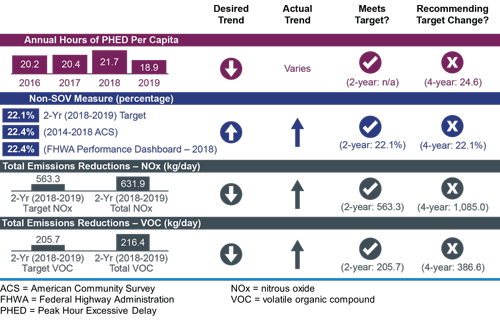
Figure 2. Chart. Summary and scorecard—Congestion Mitigation and Air Quality Improvement Program performance measures.
(Source: FHWA. Data from State Performance Dashboard - Georgia.)11
This scorecard lists four measures: annual hours of Peak Hour Excessive Delay per capita, non-Single Occupancy Vehicle measure (percentage), and total emissions reductions for both nitrogen oxide and volatile organic compound (kilograms/day). Each measure shows if the desired trend is up or down, what the actual trend is, and whether a performance measure has met its target or if a target change is recommended.
Additional Approaches
In addition to the three case studies above, the following examples may be useful for agencies looking to communicate PM3 measures:
- The Ohio–Kentucky–Indiana (OKI) Plan, developed by the Kentucky Transportation Cabinet, Ohio DOT, and Indiana DOT, which thoroughly discusses concepts of congestion before defining, discussing, and visualizing all the PM3 measures.12
- The Florida DOT Source Book, which is an interactive online dashboard that includes many performance measures, including planning time index (the 95th percentile travel time divided by the free flow travel time on a segment), vehicle-hours of delay, and person-hours of delay.13 While none of these measures are included in PM3, the structure of the dashboard—which includes key messages, methodology, visualizations, definitions, and a link to download the underlying data—could be applied to PM3 measures.
- The Washington State DOT Multimodal Mobility Dashboard, which includes the PM3 NHPP reliability measure and the percentage of person-miles traveled (PMT) that are reliable both at the statewide level and broken down by region and by road.14
- Iowa DOT System Performance and Freight Measures, which offers a detailed methodology for PM3 measures on NHPP reliability and freight reliability and discusses ways in which they can and cannot be used.15
- Utah DOT Highway Reliability Dashboard, which visualizes and defines PM3 measures of NHPP reliability and freight reliability, built in Microsoft® Power BI®.16
- Capital District Transportation Committee Freight Performance Measure Factsheet, which provides Federal guidelines for the establishment of targets, information on New York State DOT’s target-setting process, historical data, and initial targets.17 In discussing its process for setting targets, the agency describes various data challenges and their solutions, as applicable, as well as the process for setting baselines and calculating targets.
- The EWGCOG System Performance Report, which visualizes and discusses all PM3 measures.18